Download to read offline

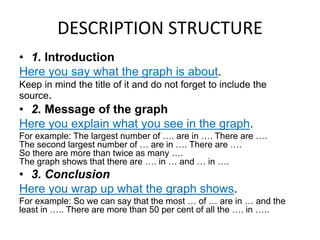

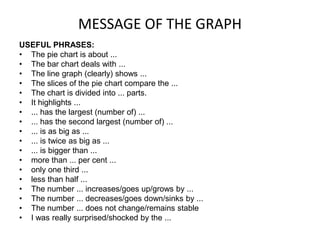
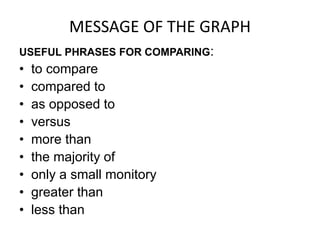
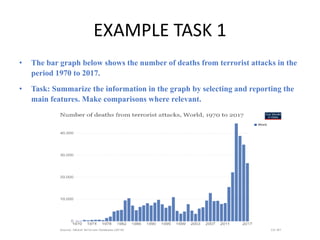
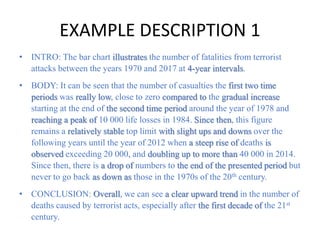
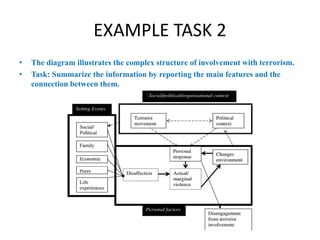
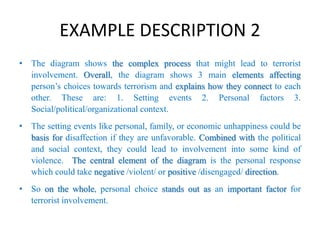

The document provides guidance on describing graphs and examples of graph summaries. It outlines a structure for graph descriptions, including an introduction stating the graph topic and source, explaining the graph's message and key findings, and concluding with a summary. Useful phrases are provided for each section. An example task and description summarize a bar graph showing increasing terrorism deaths over time and a diagram outlining factors influencing terrorism involvement.


