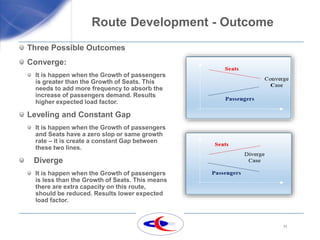
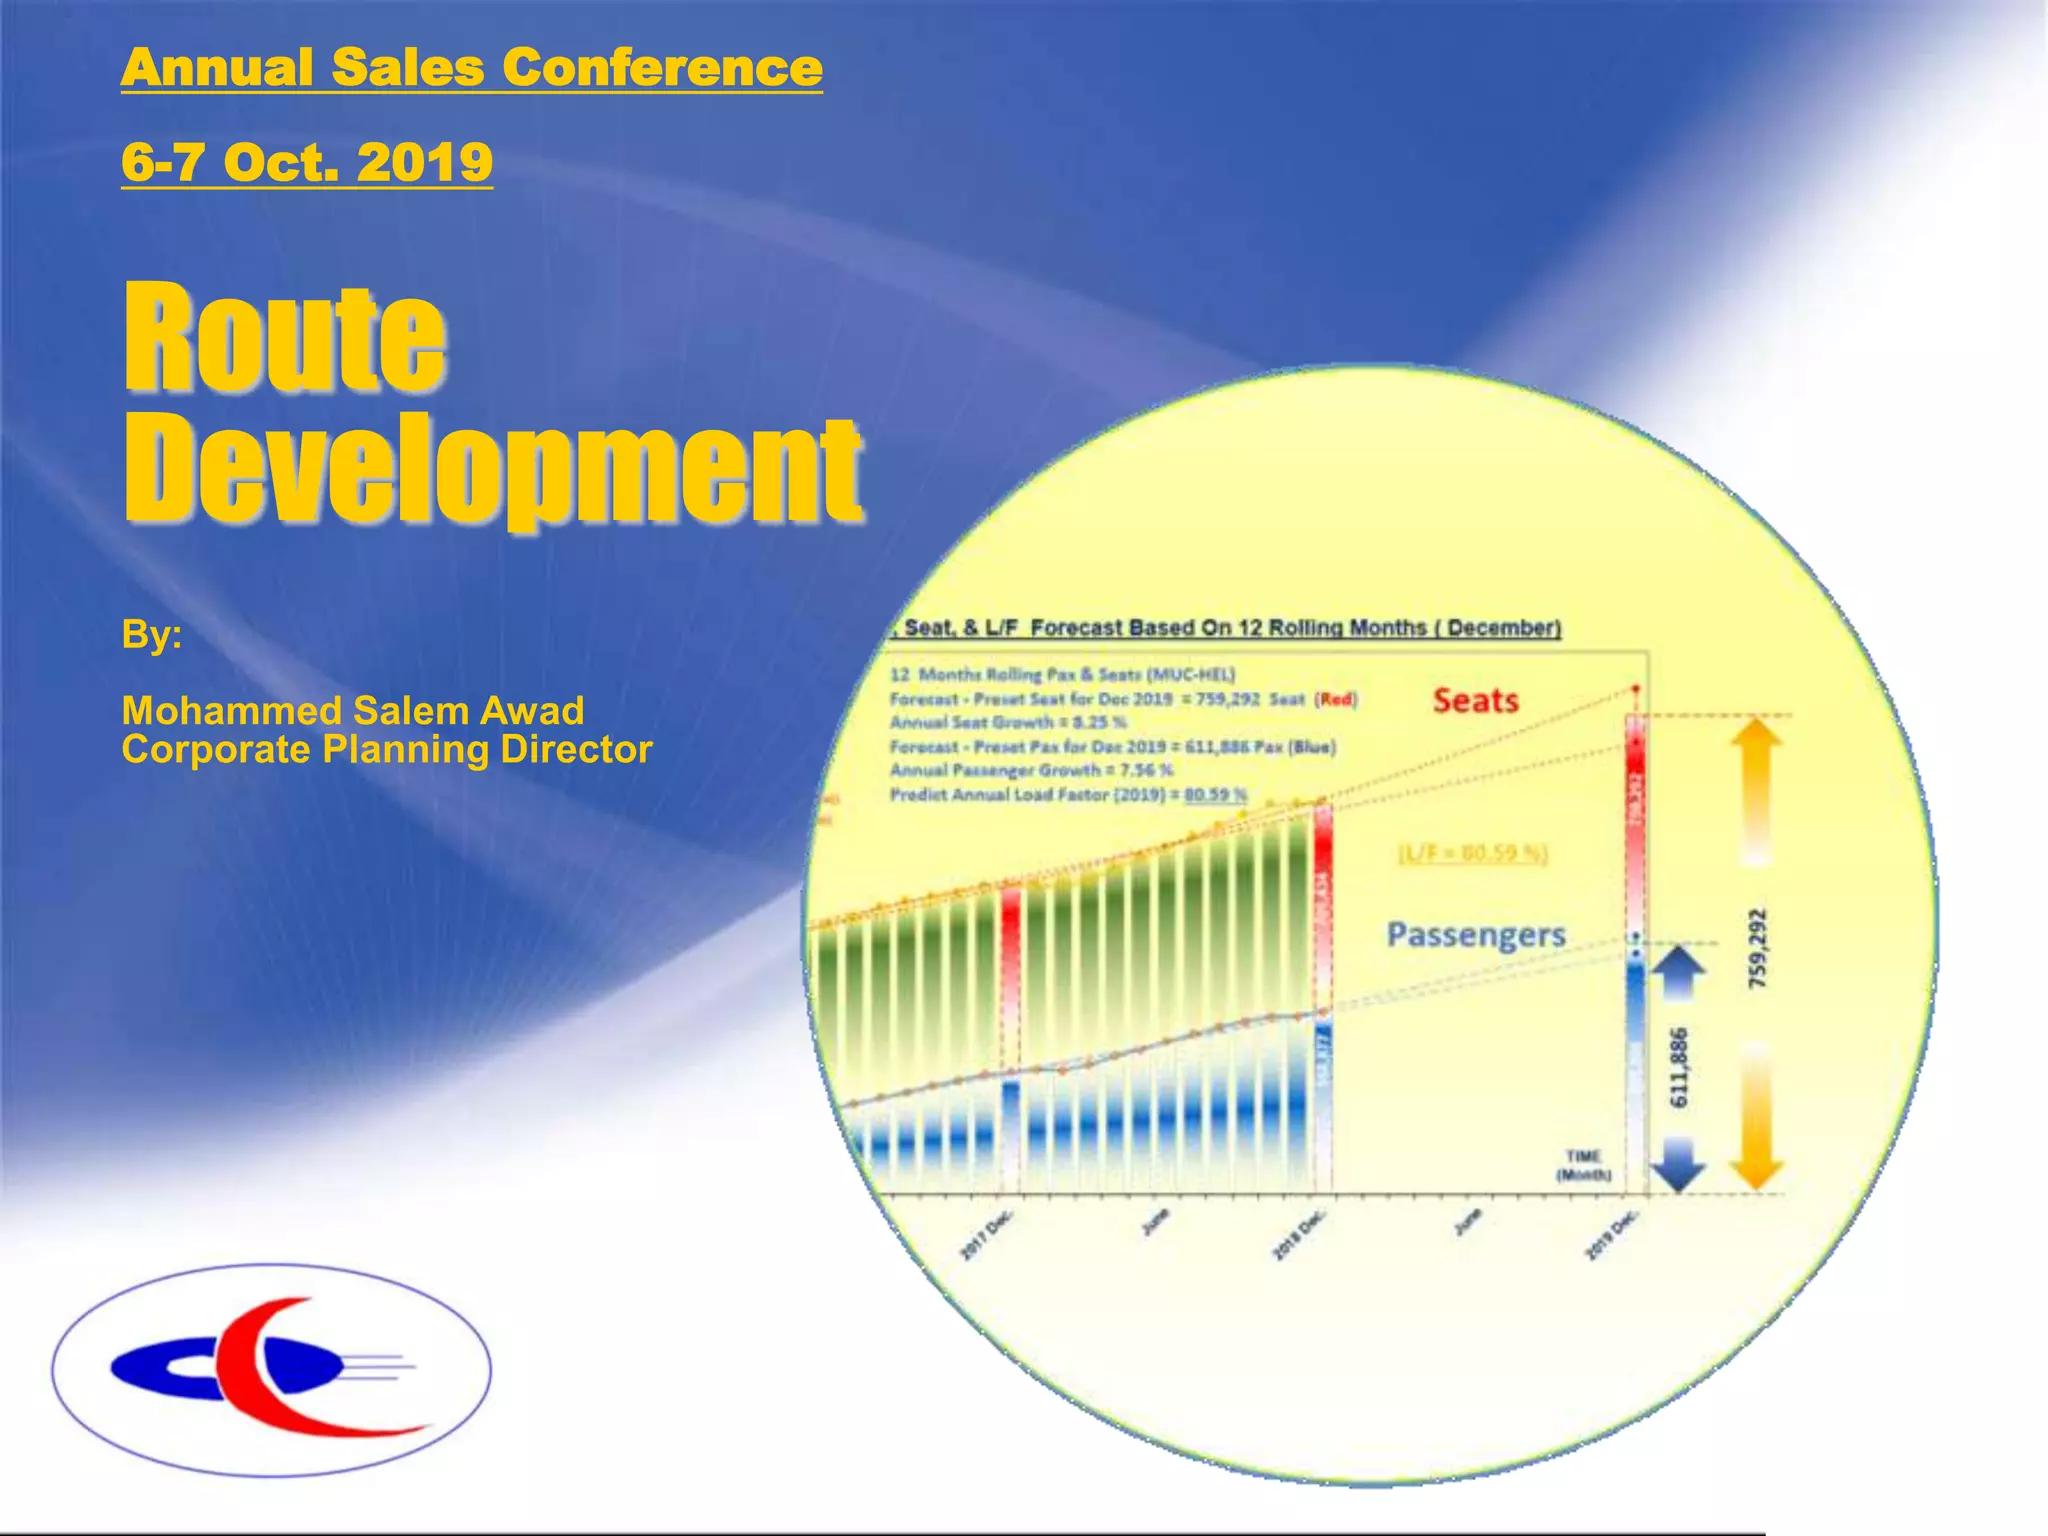
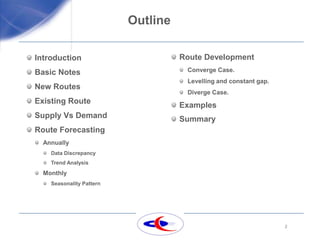
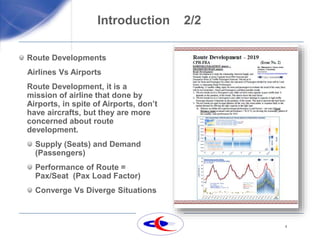
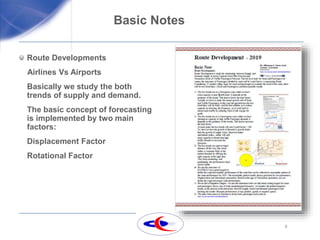
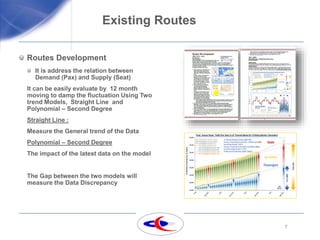
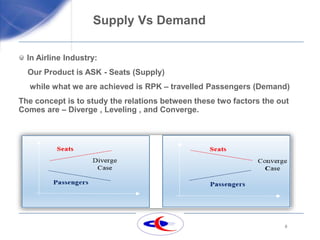
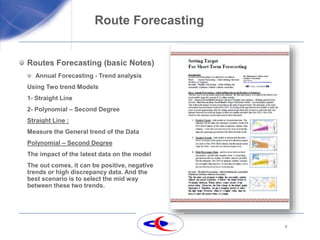
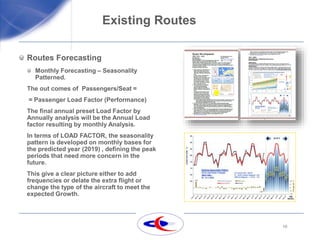
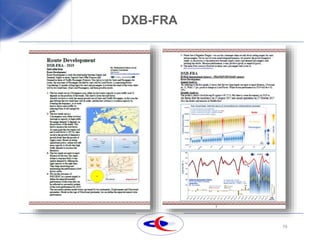
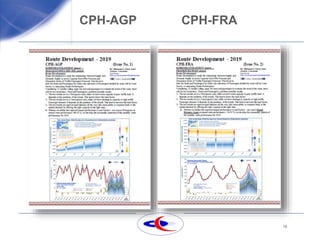
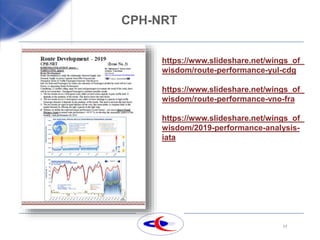
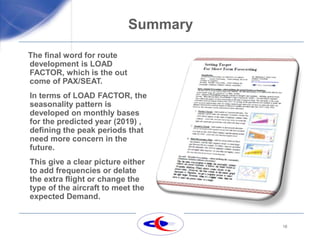
Route
Development
By:
Mohammed Salem Awad
Corporate Planning Director
Annual Sales Conference
6-7 Oct. 2019
2
Outline
Introduction
Basic Notes
New Routes
Existing Route
Supply Vs Demand
Route Forecasting
Annually
Data Discrepancy
Trend Analysis
Monthly
Seasonality Pattern
Route Development
Converge Case.
Levelling and constant gap.
Diverge Case.
Examples
Summary
3
Introduction 1/2
Route Developments
All concern about Route
Development, and today Airline
Industry suffering by the
competition from the new concept
of LCC, resulting more Airline
declare their bankruptcies, the
reason of that, they are not able to
adjust their cost to meet their
expenditure, at a very tight profit
margin in Aviation Industry.
So the passengers experience,
study the basic behavior mode
and practice by passengers and
this lead us to Study Route
Development in terms supply
(seats) and demand (passengers)
4
Introduction 2/2
Route Developments
Airlines Vs Airports
Route Development, it is a
mission of airline that done by
Airports, in spite of Airports, don’t
have aircrafts, but they are more
concerned about route
development.
Supply (Seats) and Demand
(Passengers)
Performance of Route =
Pax/Seat (Pax Load Factor)
Converge Vs Diverge Situations
5
Basic Notes
Route Developments
Airlines Vs Airports
Basically we study the both
trends of supply and demand.
The basic concept of forecasting
is implemented by two main
factors:
Displacement Factor
Rotational Factor
6
New Routes
Opening New Route
Thumb analysis
Gravity Model
https://www.slideshare.net/wings_of_wi
sdom/yemenia-focus-no-2-gravity-
model-for-aden-airport
7
Existing Routes
Routes Development
It is address the relation between
Demand (Pax) and Supply (Seat)
It can be easily evaluate by 12 month
moving to damp the fluctuation Using Two
trend Models, Straight Line and
Polynomial – Second Degree
Straight Line :
Measure the General trend of the Data
Polynomial – Second Degree
The impact of the latest data on the model
The Gap between the two models will
measure the Data Discrepancy
8
Supply Vs Demand
In Airline Industry:
Our Product is ASK - Seats (Supply)
while what we are achieved is RPK – travelled Passengers (Demand)
The concept is to study the relations between these two factors the out
Comes are – Diverge , Leveling , and Converge.
9
Route Forecasting
Routes Forecasting (basic Notes)
Annual Forecasting - Trend analysis
Using Two trend Models
1- Straight Line
2- Polynomial – Second Degree
Straight Line :
Measure the General trend of the Data
Polynomial – Second Degree
The impact of the latest data on the model
The out comes, it can be positive, negative
trends or high discrepancy data. And the
best scenario is to select the mid way
between these two trends.
10
Existing Routes
Routes Forecasting
Monthly Forecasting – Seasonality
Patterned.
The out comes of Passengers/Seat =
= Passenger Load Factor (Performance)
The final annual preset Load Factor by
Annually analysis will be the Annual Load
factor resulting by monthly Analysis.
In terms of LOAD FACTOR, the seasonality
pattern is developed on monthly bases for
the predicted year (2019) , defining the peak
periods that need more concern in the
future.
This give a clear picture either to add
frequencies or delate the extra flight or
change the type of the aircraft to meet the
expected Growth.
11
Route Development - Outcome
Three Possible Outcomes
Converge:
It is happen when the Growth of passengers
is greater than the Growth of Seats. This
needs to add more frequency to absorb the
increase of passengers demand. Results
higher expected load factor.
Leveling and Constant Gap
It is happen when the Growth of passengers
and Seats have a zero slop or same growth
rate – it is create a constant Gap between
these two lines.
Diverge
It is happen when the Growth of passengers
is less than the Growth of Seats. This means
there are extra capacity on this route,
should be reduced. Results lower expected
load factor.
12
Examples : ADE-AMM
https://www.slideshare.net/wings_of_wisdom/yemenia-focus-no-1-
aden-amman-market
13
Examples : ORY-TLS
14
MUC-HEL
15
DXB-FRA
16
CPH-AGP CPH-FRA
17
CPH-NRT
https://www.slideshare.net/wings_of_
wisdom/route-performance-yul-cdg
https://www.slideshare.net/wings_of_
wisdom/route-performance-vno-fra
https://www.slideshare.net/wings_of_
wisdom/2019-performance-analysis-
iata
18
Summary
The final word for route
development is LOAD
FACTOR, which is the out
come of PAX/SEAT.
In terms of LOAD FACTOR, the
seasonality pattern is
developed on monthly bases
for the predicted year (2019) ,
defining the peak periods that
need more concern in the
future.
This give a clear picture either
to add frequencies or delate
the extra flight or change the
type of the aircraft to meet the
expected Demand.
19
Thank You

Route development

  • 1.
    Route Development By: Mohammed Salem Awad CorporatePlanning Director Annual Sales Conference 6-7 Oct. 2019
  • 2.
    2 Outline Introduction Basic Notes New Routes ExistingRoute Supply Vs Demand Route Forecasting Annually Data Discrepancy Trend Analysis Monthly Seasonality Pattern Route Development Converge Case. Levelling and constant gap. Diverge Case. Examples Summary
  • 3.
    3 Introduction 1/2 Route Developments Allconcern about Route Development, and today Airline Industry suffering by the competition from the new concept of LCC, resulting more Airline declare their bankruptcies, the reason of that, they are not able to adjust their cost to meet their expenditure, at a very tight profit margin in Aviation Industry. So the passengers experience, study the basic behavior mode and practice by passengers and this lead us to Study Route Development in terms supply (seats) and demand (passengers)
  • 4.
    4 Introduction 2/2 Route Developments AirlinesVs Airports Route Development, it is a mission of airline that done by Airports, in spite of Airports, don’t have aircrafts, but they are more concerned about route development. Supply (Seats) and Demand (Passengers) Performance of Route = Pax/Seat (Pax Load Factor) Converge Vs Diverge Situations
  • 5.
    5 Basic Notes Route Developments AirlinesVs Airports Basically we study the both trends of supply and demand. The basic concept of forecasting is implemented by two main factors: Displacement Factor Rotational Factor
  • 6.
    6 New Routes Opening NewRoute Thumb analysis Gravity Model https://www.slideshare.net/wings_of_wi sdom/yemenia-focus-no-2-gravity- model-for-aden-airport
  • 7.
    7 Existing Routes Routes Development Itis address the relation between Demand (Pax) and Supply (Seat) It can be easily evaluate by 12 month moving to damp the fluctuation Using Two trend Models, Straight Line and Polynomial – Second Degree Straight Line : Measure the General trend of the Data Polynomial – Second Degree The impact of the latest data on the model The Gap between the two models will measure the Data Discrepancy
  • 8.
    8 Supply Vs Demand InAirline Industry: Our Product is ASK - Seats (Supply) while what we are achieved is RPK – travelled Passengers (Demand) The concept is to study the relations between these two factors the out Comes are – Diverge , Leveling , and Converge.
  • 9.
    9 Route Forecasting Routes Forecasting(basic Notes) Annual Forecasting - Trend analysis Using Two trend Models 1- Straight Line 2- Polynomial – Second Degree Straight Line : Measure the General trend of the Data Polynomial – Second Degree The impact of the latest data on the model The out comes, it can be positive, negative trends or high discrepancy data. And the best scenario is to select the mid way between these two trends.
  • 10.
    10 Existing Routes Routes Forecasting MonthlyForecasting – Seasonality Patterned. The out comes of Passengers/Seat = = Passenger Load Factor (Performance) The final annual preset Load Factor by Annually analysis will be the Annual Load factor resulting by monthly Analysis. In terms of LOAD FACTOR, the seasonality pattern is developed on monthly bases for the predicted year (2019) , defining the peak periods that need more concern in the future. This give a clear picture either to add frequencies or delate the extra flight or change the type of the aircraft to meet the expected Growth.
  • 11.
    11 Route Development -Outcome Three Possible Outcomes Converge: It is happen when the Growth of passengers is greater than the Growth of Seats. This needs to add more frequency to absorb the increase of passengers demand. Results higher expected load factor. Leveling and Constant Gap It is happen when the Growth of passengers and Seats have a zero slop or same growth rate – it is create a constant Gap between these two lines. Diverge It is happen when the Growth of passengers is less than the Growth of Seats. This means there are extra capacity on this route, should be reduced. Results lower expected load factor.
  • 12.
  • 13.
  • 14.
  • 15.
  • 16.
  • 17.
  • 18.
    18 Summary The final wordfor route development is LOAD FACTOR, which is the out come of PAX/SEAT. In terms of LOAD FACTOR, the seasonality pattern is developed on monthly bases for the predicted year (2019) , defining the peak periods that need more concern in the future. This give a clear picture either to add frequencies or delate the extra flight or change the type of the aircraft to meet the expected Demand.
  • 19.