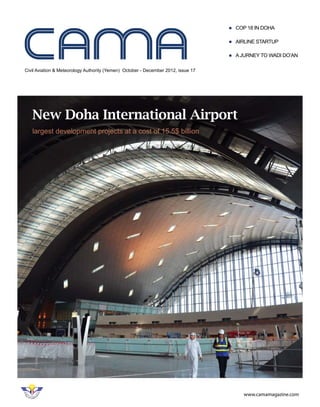
Civil Aviation & Meteorology Authority (Yemen) October - December 2012, issue 17
COP 18 in Doha
AIRLINE STARTUP
Ajurney to Wadi Do’an
www.camamagazine.com
largest development projects at a cost of 15.5$ billion
New Doha International Airport
26 study
AIRLINE STARTUP
T
he issue of airline startup is very complicated, it is manage by a huge aviation consultant companies and airline manufactures such
Boeing and Airbus. that customize the results to fitted to their interests and products, off course their aircraft are the best in the world
but when the airlines falls to make a profits, then it become a management issue, so either to make good start for new established
airlines or implement turn around program for existing one.
So to make a good start for an airline both manufactures lunch an outstanding teams to facilitate the starting up phase, they do that as
they care about their brand name ( Boeing or Airbus ), so they want to ensure that the airline industry business is healthy in spite of the tight
margin of profit. Everyone has its own way for analysis of starting up of airline, we are going to address road map by Boeing , start me up
by Airbus, one from airline industry, and finally a new approach that based on the airline inputs only.
Mohammed Salem Awad
Research Scholar Aviation Management
“Airline Idea”
General Industry &
Competitive Analysis
Target Market Analysis and
Service Offering
Route Structure
Development
Schedule Development
Marketing Strategy and
SWOT Analysis
Aircraft Evaluation and
Fleet planning
Market share (Revenue)
Forecasting
Operating Plan (Expense)
Development
Financial Model
Development
Management Team
Recruiting
Business Capitalization
Airline Launch
Startup-Airline “Roadmap”
Enter into Service (EIS)
Airline Operator
Certification (AOC)
Aircraft Sourcing
Staffing/Facilities
Business Plan
Development
Iterations
1- Airbus Approach:
The Start Me Up V- Plan
Both approaches (Airbus and Boeing) started
by Airline Idea, the first thing what type of
service we want to deliver, is it Legacy Airline,
Hybrid, or LCC (Low Cost Carriers) and what
business model to follow, what are the trends
and the potential in regions/market, can we
capture the proposed share, then a business
plan should be set up, when the financial model
shows a positive signal in first year or may be
later (two years), the business plan should be
minimum for 5 years operations, this should
include network structure, aircraft selection,
and operating model, whence the business
plan in hand, then we secure the aircrafts, and
involve in AOC process, recruit management,
business capitulation, facilities staff
operational plan, departments setup, and
takeoff.
2- Boeing Approach:
Startup Boeing - Roadmap
Also Boeing started by Airline Idea, as
mentioned previously, the steps are more
explore by Boeing, as General Industry &
Competitive Analysis, Target Market Analysis
and Service Offering, Route Structure
Development, Schedule Development,
Market Strategy and SWOT Analysis, Aircraft
Evaluation and Fleet Planning, Market Share
(Revenue) Forecasting, Operating Plan
(Expense), Financial Model Development,
Development, Management Team Recruiting
That most of steps mentioned by Airbus, the
new thing is the Business Plan Development
Iterations, the model can be adjusted to meet
the demand and get right picture of business.
Whence the investors are comfortable, the
process can be extended further to Business
Capitalization, Airline Operator certification,
aircraft sourcing, staff/Facilities and Inter into
the Service.
go / no go
airline idea
Project feasibility
Business plan
Network structure
Aircraft evaluation
Operating model
Financial model
Take-off
Entry into services
Department set up
Operations plan
Business capitalization
Recruit management
AOC process
Source aircraft
the start me up v-plan
CAMA Magazine | issue 17 | December, 2012
27study
3- Airline Industry Approach
Most of consultancy firm follow two stages
approach e.g: (www.eagleconsulting.aero) in
the following outline:
Planning
•  Concept Formulation
•  Feasibility Assessment
•  Business Plan Development
Implementation
•  Implementation Planning.
•  Funding Soured
•  Management Recruitment
• Air Operating Certification
• Aircraft Sourced
•  Operational Set Up
4- U curve Approach:
Based on my experience and published
research papers, airline can be define by four
categories i.e Demands, Fares, Distances, and
Cost.
Which developed the optimum operating curve
of the proposed network of airline startup.
Further my current concern is to address the
feasibility parts of Airline Startup.
The approach started by Airline Idea, i.e
LCC, Hybrid, Legacy, or Network airline.
Another issue is market estimation –
Demand forecasting either on the existing
network, or establishing new destinations.
The basic analysis formula is:
The model constructed by Five main parts
1- Developing Integer program
2- Implemented U curve technique, and
3- Defining Optimum operating curve
4- Setting Optimum Fare strategy
5- Improve route profitability
The new concept in this model is how to define
the right aircraft without the interface and
guidance of the manufactures, and it follows by
benchmarking study to position the right cost
to right the business model based on airline
(Fleet/Aircraft) input.
Conclusions:
No doubts about the facility that
offers by manufactures, but definitely
that analysis will be biased, sure
we will not get any manufacture
analysis support the other competitor
manufacture argument. That why
a third party should be involve in
process of airline startup. While for
U curve approach, it relay on the
airline side and information that
reflects the optimum operating curve
and with benchmarking study we
can position the other operators
cost on line to utilize their operating
experience in our figure which
gives a correct picture about the
business to use the right size of
Aircrafts for proposed network.■
U Curve Techniques
Model
IntegerProgram
Optim
um
Curve
Solution
Operational set up
Launch
Concept Formulation
Feasibility Assessment
Business Plan Development
Implementation Planning
Funding Sourced
Management recruitment
Air Operating Certification
Aircraft Sourced
Implementation
Planning
Jet Blue
A320
Air Arabia
A320
Air Asia
A320
Ryan Air
B737-800
Max A/C seat
300
250
200
150
100
50
0
0.01 0.02 0.03 0.04 0.05 0.06 0.07 0.08 0.09 0.10
Operating Curve
NumberofSeat
Cost per ASK
Optimum Operating Curve
CAMA Magazine | issue 17 | December, 2012
30
Prepared by: Mohammed Salem Awad
Research Scholar – Aviation Management
Getting The Right Picture
Head to Head analysis
Seasonally Adjusted Vs Seasonally Fitted
Airports Forecasting
Furthers to my previous articles, this
article will address the difference and
compare the Seasonally Adjusted
technique Vs Seasonally Fitted. Basically
Forecasting model can be defined by four
components i.e Trend, Cyclical, Seasonal,
and Irregular.
A model that treats the time series
values as a sum of the components is
called an additive component model
(Yt=Tt+Ct+St+It) , While a model that treats
the time series values as a product of
the components is called a multiplicative
component model (Yt=Tt×Ct×St×It)
Seasonally Adjusted:
Most economic series published by
international Organizations ( IATA, ICAO)
are seasonally adjusted because seasonal
variation is not of primary interest.
Rather, it is the general patterned of
economic activity, independent of normal
seasonal fluctuation that is of interest. So
seasonally adjusted is done to simplify
data so that they may be more easily
interpreted by statistically unsophisticated
users without a significant loss of
information. e.g – IATA Forecasting.
Seasonally Fitted:
General guidance, we set a constrains to
measure the Goodness of Fit, this time
we use R and Signal Tracking ( R ≥ 80
and 4 ≥ S.T.≥ -4 ). The seasonal model
fairly fitted by defining and controlling two
main factors for mapping the figure, first is
Displacement Factor which can be defined
by the value of signal tracking, it is either
upper or lower of the base forecasting
line. Where the second factor is the
rotating angle and that can be monitor by
the value of R i.e why both R and signal
tracking are displayed in the graph.
Summary:
Both methods are fair, so to get the
general trend, we use seasonally adjusted
but to ensure to get the right picture we
have to define the seasonality patterned
and define their accuracy measuring
factors in terms of R and Signal
Tracking, the issue of this method only
its applicability for short range period 1-3
years if we exceed the time/period the
program should modified and set a new
one.
CAMA Magazine | issue 17 | December, 2012
billion’s monthly f/cast
Actual Seasonally Adjusted Forcast
R
2
= 90%
Tracking Signal = -0.0000028
Time
billion’smonthly
International scheduled passenger traffic (RPKs) Industry total
Latest data April 2011
Time
Oumra
Session
Hajj
Session
Summer
Session
Winter
Session
Actual Year
Cycle
Forecasted Year
Cycle
Sales/Passengers
Back to school
Session
“Facts are Many
but the Truth is
One.”
Rabindranath Tagore
IATA
IATA
31
Airports Forecasting:
Airport forecasting is an important issue in
Aviation industry. It becomes an integral parts of
transportation planning. It sets targets and goals
for the airports, either for long term or medium term
planning. The primary statistical methods used in
airport aviation activity forecasting are market share
approach, econometric modeling, and time series
modeling.
Model Used:
Based on a historical data of the airports, (3 years
on monthly bases) the mathematical model is
developed where its fairness and goodness of fit can
be defined by two important factors:
R
2
(Coeff. Of Determination) > 80%
S. T (Signal Tracking) ..(- 4 ≥ S.T. ≤ 4)
This time we try to set (S.T.) to Zero
Oslo Airport, Gardermoen
(Norwegian: Oslo lufthavn, Gardermoen; IATA:
OSL, ICAO: ENGM), also known as Gardermoen
Airport, is the principal airport serving Oslo, the
capital of and most populous city in Norway. Oslo is
also served by the low-cost Torp Airport and Rygge
Airport. Gardermoen acts as the main domestic
hub and international airport for Norway, and is the
second-busiest airport in the Nordic countries.
R2
= 93%, S.T.= 0
2013 (F) = 23,717,975 Pax
Munich Airport
(IATA: MUC, ICAO: EDDM) (German: Flughafen
München), is an international airport located 28.5
km (17.7 mi) northeast of Munich, Germany, and
is a hub for Lufthansa and Star Alliance partner
airlines. It is located near the old city of Freising and
is named in memory of the former Bavarian Prime
minister Franz Josef Strauss. The airport is located
on the territory of four different municipalities:
Oberding (location of the terminals; district of
Erding), Hallbergmoos, Freising and Marzling
(district of Freising).
R
2
= 94%, S.T.= 0
2013 (F) = 42,565,394 Pax
Paris Orly Airport
(French: Aéroport de Paris-Orly) (IATA: ORY, ICAO:
LFPO) is an international airport located partially in
Orly and partially in Villeneuve-le-Roi, 7 NM (13 km;
8.1 mi) south of Paris, France. It has flights to cities
in Europe, the Middle East, Africa, the Caribbean,
North America and Southeast Asia. Prior to the
construction of Charles de Gaulle Airport, Orly was
the main airport of Paris.
R
2
= 91%, S.T.= 0
2013 (F) = 29,120,442 Pax
Passengers Forecasting 2013
Oslo Airport
1,000,000
1,200,000
1,400,000
1,600,000
1,800,000
2,000,000
2,200,000
2,400,000
NoofPassengers
TIME (Month)
Forecast
Actual
R2 = 93 %
S.T.= 0
2013(F) = 23,717,975 Pax
Passengers Forecasting 2013
Munich Airport
1,200,000
1,700,000
2,200,000
2,700,000
3,200,000
3,700,000
4,200,000
4,700,000
NoofPassengers
TIME (Month)
Forecast
Actual
R2 = 94 %
S.T.= 0
2013(F) = 42,565,394 Pax
Passengers Forecasting 2013
Orly Airport
1,200,000
1,400,000
1,600,000
1,800,000
2,000,000
2,200,000
2,400,000
2,600,000
2,800,000
3,000,000
3,200,000
NoofPassengers
TIME (Month)
Forecast
Actual
R2 = 91 %
S.T.= 0
2013(F) = 29,120,442 Pax
CAMA Magazine | issue 17 | December, 2012
Airport forecasting
32
Edinburgh Airport
(Scottish Gaelic: Port-adhair Dhùn Èideann) (IATA:
EDI, ICAO: EGPH) is located at Turnhouse in the
City of Edinburgh, Scotland, and was the busiest
airport in Scotland in 2011, handling just under 9.4
million passengers in that year. It was also the sixth
busiest airport in the UK by passengers and the
fifth busiest by aircraft movements. It is located 5
nautical miles (9.3 km; 5.8 mi) west of the city centre
and is situated just off the M8 motorway.
R
2
= 93%
S.T.= 0
2013(F) = 9,688,572 Pax
Avinor – (airports traffic)
AS is a state-owned limited company that operates
most of the civil airports in Norway. The Norwegian
state, via the Norwegian Ministry of Transport and
Communications, controls 100 percent of the share
capital. Avinor was created on 1 January 2003, by
the privatization of the Norwegian Civil Aviation
Administration known as Luftfartsverket. Its head
office is in Bjørvika, Oslo, located on the seaside of
Oslo Central Station.
R
2
= 92%
S.T.= 0
2013(F) = 49,847,034 Pax
Gold Coast Airport, or Coolangatta Airport
(IATA: OOL, ICAO: YBCG) is an Australian domestic
and international airport at the southern end of the
Gold Coast, some 100 km (62 mi) south of Brisbane
and 25 km (16 mi) south of Surfers Paradise. The
entrance to the airport is situated in the suburb
of Bilinga on the Gold Coast. The runway itself
straddles five suburbs of twin cities across the state
border of Queensland and New South Wales. During
summer these states are in two different time zones.
R
2
= 0.64%
S.T.= 0
2013(F) = 5,551,812 Pax
Passengers Forecasting 2013
Edinburgh Airport
Passengers Forecasting 2013
Avinor Airport
Passengers Forecasting 2013
Gold Coast Airport
400,000
500,000
600,000
700,000
800,000
900,000
1,000,000
1,100,000
NoofPassengers
TIME (Month)
Forecast
Actual
R2 = 93 %
S.T.= 0
2013(F) = 9,688,572 Pax
2,200,000
2,700,000
3,200,000
3,700,000
4,200,000
4,700,000
5,200,000
NoofPassengers
TIME (Month)
Forecast
Actual
R2 = 92 %
S.T.= 0
2013(F) = 49,847,034 Pax
300,000
350,000
400,000
450,000
500,000
550,000
600,000
NoofPassengers
TIME (Month)
Forecast
Actual
R2 = 0.64 %
S.T.= 0
2013(F) = 5,551,812 Pax
CAMA Magazine | issue 17 | December, 2012
Airport forecasting
Cairns Airport
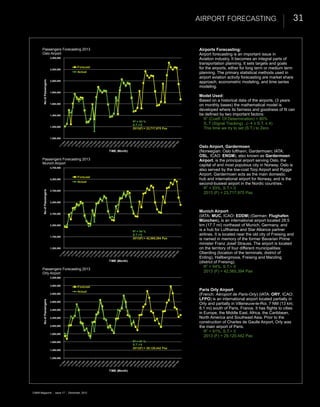
(IATA: CNS, ICAO: YBCS) is an international airport
in Cairns, Queensland, Australia. Formerly operated
by the Cairns Port Authority, the airport was sold
by the Queensland Government in December 2008
to a private consortium. It is the seventh busiest
airport in Australia. The airport is located 2.3 nautical
miles (4.3 km; 2.6 mi) north northwest [1] of Cairns
or 7 kilometres (4.3 mi) north of the Cairns central
business district, in the suburb of Aeroglen. The
airport lies between Mount Whitfield to the west and
Trinity Bay to the east.
R
2
= 92%
S.T.= 0
2013(F) = 4,297,288 Pax
[1] http://en.wikipedia.org/wiki/Main_Page
Melbourne Airport
(IATA: MEL, ICAO: YMML), also known as
Tullamarine Airport, is the primary airport serving
the city of Melbourne, and the second busiest airport
in Australia. It was opened in 1970 to replace the
nearby Essendon Airport. Melbourne Airport is the
sole international airport of the four airports serving
the Melbourne metropolitan area.
The airport is 23 km (14 mi) from the city centre. The
airport has its own postcode—Melbourne Airport,
Victoria (postcode 3045). This is adjacent to the
suburb of Tullamarine.
R
2
= 83%
S.T.= 0
2013(F) = 29,942,351 Pax
Brisbane Airport
(IATA: BNE, ICAO: YBBN) is the sole passenger
airport serving Brisbane and is the third busiest
airport in Australia after Sydney Airport and
Melbourne Airport. Brisbane Airport has won
many awards. Brisbane is currently served with 46
domestic destinations in all States and Territories
and 32 international destinations. For the 12 months
ending May 2011 total passengers were 20,056,416.
R2
= 93%
S.T.= 0
2013(F) = 21,932,169 Pax
33
Passengers Forecasting 2013
Brisbane Airport
Passengers Forecasting 2013
Cairns Airport
Passengers Forecasting 2013
Melbourne Airport
1,200,000
1,300,000
1,400,000
1,500,000
1,600,000
1,700,000
1,800,000
1,900,000
2,000,000
2,100,000
NoofPassengers
TIME (Month)
Forecast
Actual
R2 = 93 %
S.T.= 0
2013(F) = 21,932,169 Pax
200,000
250,000
300,000
350,000
400,000
450,000
NoofPassengers
TIME (Month)
Forecast
Actual
R2 = 92 %
S.T.= 0
2013(F) = 4,297,288 Pax
1,800,000
1,900,000
2,000,000
2,100,000
2,200,000
2,300,000
2,400,000
2,500,000
2,600,000
2,700,000
2,800,000
NoofPassengers
TIME (Month)
Forecast
Actual
R2 = 83 %
S.T.= 0
2013(F) = 29,942,351 Pax
CAMA Magazine | issue 17 | December, 2012
Airport forecasting

Aviation Article : Getting The Right Picture

  • 1.
    Civil Aviation &Meteorology Authority (Yemen) October - December 2012, issue 17 COP 18 in Doha AIRLINE STARTUP Ajurney to Wadi Do’an www.camamagazine.com largest development projects at a cost of 15.5$ billion New Doha International Airport
  • 2.
    26 study AIRLINE STARTUP T heissue of airline startup is very complicated, it is manage by a huge aviation consultant companies and airline manufactures such Boeing and Airbus. that customize the results to fitted to their interests and products, off course their aircraft are the best in the world but when the airlines falls to make a profits, then it become a management issue, so either to make good start for new established airlines or implement turn around program for existing one. So to make a good start for an airline both manufactures lunch an outstanding teams to facilitate the starting up phase, they do that as they care about their brand name ( Boeing or Airbus ), so they want to ensure that the airline industry business is healthy in spite of the tight margin of profit. Everyone has its own way for analysis of starting up of airline, we are going to address road map by Boeing , start me up by Airbus, one from airline industry, and finally a new approach that based on the airline inputs only. Mohammed Salem Awad Research Scholar Aviation Management “Airline Idea” General Industry & Competitive Analysis Target Market Analysis and Service Offering Route Structure Development Schedule Development Marketing Strategy and SWOT Analysis Aircraft Evaluation and Fleet planning Market share (Revenue) Forecasting Operating Plan (Expense) Development Financial Model Development Management Team Recruiting Business Capitalization Airline Launch Startup-Airline “Roadmap” Enter into Service (EIS) Airline Operator Certification (AOC) Aircraft Sourcing Staffing/Facilities Business Plan Development Iterations 1- Airbus Approach: The Start Me Up V- Plan Both approaches (Airbus and Boeing) started by Airline Idea, the first thing what type of service we want to deliver, is it Legacy Airline, Hybrid, or LCC (Low Cost Carriers) and what business model to follow, what are the trends and the potential in regions/market, can we capture the proposed share, then a business plan should be set up, when the financial model shows a positive signal in first year or may be later (two years), the business plan should be minimum for 5 years operations, this should include network structure, aircraft selection, and operating model, whence the business plan in hand, then we secure the aircrafts, and involve in AOC process, recruit management, business capitulation, facilities staff operational plan, departments setup, and takeoff. 2- Boeing Approach: Startup Boeing - Roadmap Also Boeing started by Airline Idea, as mentioned previously, the steps are more explore by Boeing, as General Industry & Competitive Analysis, Target Market Analysis and Service Offering, Route Structure Development, Schedule Development, Market Strategy and SWOT Analysis, Aircraft Evaluation and Fleet Planning, Market Share (Revenue) Forecasting, Operating Plan (Expense), Financial Model Development, Development, Management Team Recruiting That most of steps mentioned by Airbus, the new thing is the Business Plan Development Iterations, the model can be adjusted to meet the demand and get right picture of business. Whence the investors are comfortable, the process can be extended further to Business Capitalization, Airline Operator certification, aircraft sourcing, staff/Facilities and Inter into the Service. go / no go airline idea Project feasibility Business plan Network structure Aircraft evaluation Operating model Financial model Take-off Entry into services Department set up Operations plan Business capitalization Recruit management AOC process Source aircraft the start me up v-plan CAMA Magazine | issue 17 | December, 2012
  • 3.
    27study 3- Airline IndustryApproach Most of consultancy firm follow two stages approach e.g: (www.eagleconsulting.aero) in the following outline: Planning • Concept Formulation • Feasibility Assessment • Business Plan Development Implementation • Implementation Planning. • Funding Soured • Management Recruitment • Air Operating Certification • Aircraft Sourced • Operational Set Up 4- U curve Approach: Based on my experience and published research papers, airline can be define by four categories i.e Demands, Fares, Distances, and Cost. Which developed the optimum operating curve of the proposed network of airline startup. Further my current concern is to address the feasibility parts of Airline Startup. The approach started by Airline Idea, i.e LCC, Hybrid, Legacy, or Network airline. Another issue is market estimation – Demand forecasting either on the existing network, or establishing new destinations. The basic analysis formula is: The model constructed by Five main parts 1- Developing Integer program 2- Implemented U curve technique, and 3- Defining Optimum operating curve 4- Setting Optimum Fare strategy 5- Improve route profitability The new concept in this model is how to define the right aircraft without the interface and guidance of the manufactures, and it follows by benchmarking study to position the right cost to right the business model based on airline (Fleet/Aircraft) input. Conclusions: No doubts about the facility that offers by manufactures, but definitely that analysis will be biased, sure we will not get any manufacture analysis support the other competitor manufacture argument. That why a third party should be involve in process of airline startup. While for U curve approach, it relay on the airline side and information that reflects the optimum operating curve and with benchmarking study we can position the other operators cost on line to utilize their operating experience in our figure which gives a correct picture about the business to use the right size of Aircrafts for proposed network.■ U Curve Techniques Model IntegerProgram Optim um Curve Solution Operational set up Launch Concept Formulation Feasibility Assessment Business Plan Development Implementation Planning Funding Sourced Management recruitment Air Operating Certification Aircraft Sourced Implementation Planning Jet Blue A320 Air Arabia A320 Air Asia A320 Ryan Air B737-800 Max A/C seat 300 250 200 150 100 50 0 0.01 0.02 0.03 0.04 0.05 0.06 0.07 0.08 0.09 0.10 Operating Curve NumberofSeat Cost per ASK Optimum Operating Curve CAMA Magazine | issue 17 | December, 2012
  • 4.
    30 Prepared by: MohammedSalem Awad Research Scholar – Aviation Management Getting The Right Picture Head to Head analysis Seasonally Adjusted Vs Seasonally Fitted Airports Forecasting Furthers to my previous articles, this article will address the difference and compare the Seasonally Adjusted technique Vs Seasonally Fitted. Basically Forecasting model can be defined by four components i.e Trend, Cyclical, Seasonal, and Irregular. A model that treats the time series values as a sum of the components is called an additive component model (Yt=Tt+Ct+St+It) , While a model that treats the time series values as a product of the components is called a multiplicative component model (Yt=Tt×Ct×St×It) Seasonally Adjusted: Most economic series published by international Organizations ( IATA, ICAO) are seasonally adjusted because seasonal variation is not of primary interest. Rather, it is the general patterned of economic activity, independent of normal seasonal fluctuation that is of interest. So seasonally adjusted is done to simplify data so that they may be more easily interpreted by statistically unsophisticated users without a significant loss of information. e.g – IATA Forecasting. Seasonally Fitted: General guidance, we set a constrains to measure the Goodness of Fit, this time we use R and Signal Tracking ( R ≥ 80 and 4 ≥ S.T.≥ -4 ). The seasonal model fairly fitted by defining and controlling two main factors for mapping the figure, first is Displacement Factor which can be defined by the value of signal tracking, it is either upper or lower of the base forecasting line. Where the second factor is the rotating angle and that can be monitor by the value of R i.e why both R and signal tracking are displayed in the graph. Summary: Both methods are fair, so to get the general trend, we use seasonally adjusted but to ensure to get the right picture we have to define the seasonality patterned and define their accuracy measuring factors in terms of R and Signal Tracking, the issue of this method only its applicability for short range period 1-3 years if we exceed the time/period the program should modified and set a new one. CAMA Magazine | issue 17 | December, 2012 billion’s monthly f/cast Actual Seasonally Adjusted Forcast R 2 = 90% Tracking Signal = -0.0000028 Time billion’smonthly International scheduled passenger traffic (RPKs) Industry total Latest data April 2011 Time Oumra Session Hajj Session Summer Session Winter Session Actual Year Cycle Forecasted Year Cycle Sales/Passengers Back to school Session “Facts are Many but the Truth is One.” Rabindranath Tagore IATA IATA
  • 5.
    31 Airports Forecasting: Airport forecastingis an important issue in Aviation industry. It becomes an integral parts of transportation planning. It sets targets and goals for the airports, either for long term or medium term planning. The primary statistical methods used in airport aviation activity forecasting are market share approach, econometric modeling, and time series modeling. Model Used: Based on a historical data of the airports, (3 years on monthly bases) the mathematical model is developed where its fairness and goodness of fit can be defined by two important factors: R 2 (Coeff. Of Determination) > 80% S. T (Signal Tracking) ..(- 4 ≥ S.T. ≤ 4) This time we try to set (S.T.) to Zero Oslo Airport, Gardermoen (Norwegian: Oslo lufthavn, Gardermoen; IATA: OSL, ICAO: ENGM), also known as Gardermoen Airport, is the principal airport serving Oslo, the capital of and most populous city in Norway. Oslo is also served by the low-cost Torp Airport and Rygge Airport. Gardermoen acts as the main domestic hub and international airport for Norway, and is the second-busiest airport in the Nordic countries. R2 = 93%, S.T.= 0 2013 (F) = 23,717,975 Pax Munich Airport (IATA: MUC, ICAO: EDDM) (German: Flughafen München), is an international airport located 28.5 km (17.7 mi) northeast of Munich, Germany, and is a hub for Lufthansa and Star Alliance partner airlines. It is located near the old city of Freising and is named in memory of the former Bavarian Prime minister Franz Josef Strauss. The airport is located on the territory of four different municipalities: Oberding (location of the terminals; district of Erding), Hallbergmoos, Freising and Marzling (district of Freising). R 2 = 94%, S.T.= 0 2013 (F) = 42,565,394 Pax Paris Orly Airport (French: Aéroport de Paris-Orly) (IATA: ORY, ICAO: LFPO) is an international airport located partially in Orly and partially in Villeneuve-le-Roi, 7 NM (13 km; 8.1 mi) south of Paris, France. It has flights to cities in Europe, the Middle East, Africa, the Caribbean, North America and Southeast Asia. Prior to the construction of Charles de Gaulle Airport, Orly was the main airport of Paris. R 2 = 91%, S.T.= 0 2013 (F) = 29,120,442 Pax Passengers Forecasting 2013 Oslo Airport 1,000,000 1,200,000 1,400,000 1,600,000 1,800,000 2,000,000 2,200,000 2,400,000 NoofPassengers TIME (Month) Forecast Actual R2 = 93 % S.T.= 0 2013(F) = 23,717,975 Pax Passengers Forecasting 2013 Munich Airport 1,200,000 1,700,000 2,200,000 2,700,000 3,200,000 3,700,000 4,200,000 4,700,000 NoofPassengers TIME (Month) Forecast Actual R2 = 94 % S.T.= 0 2013(F) = 42,565,394 Pax Passengers Forecasting 2013 Orly Airport 1,200,000 1,400,000 1,600,000 1,800,000 2,000,000 2,200,000 2,400,000 2,600,000 2,800,000 3,000,000 3,200,000 NoofPassengers TIME (Month) Forecast Actual R2 = 91 % S.T.= 0 2013(F) = 29,120,442 Pax CAMA Magazine | issue 17 | December, 2012 Airport forecasting
  • 6.
    32 Edinburgh Airport (Scottish Gaelic:Port-adhair Dhùn Èideann) (IATA: EDI, ICAO: EGPH) is located at Turnhouse in the City of Edinburgh, Scotland, and was the busiest airport in Scotland in 2011, handling just under 9.4 million passengers in that year. It was also the sixth busiest airport in the UK by passengers and the fifth busiest by aircraft movements. It is located 5 nautical miles (9.3 km; 5.8 mi) west of the city centre and is situated just off the M8 motorway. R 2 = 93% S.T.= 0 2013(F) = 9,688,572 Pax Avinor – (airports traffic) AS is a state-owned limited company that operates most of the civil airports in Norway. The Norwegian state, via the Norwegian Ministry of Transport and Communications, controls 100 percent of the share capital. Avinor was created on 1 January 2003, by the privatization of the Norwegian Civil Aviation Administration known as Luftfartsverket. Its head office is in Bjørvika, Oslo, located on the seaside of Oslo Central Station. R 2 = 92% S.T.= 0 2013(F) = 49,847,034 Pax Gold Coast Airport, or Coolangatta Airport (IATA: OOL, ICAO: YBCG) is an Australian domestic and international airport at the southern end of the Gold Coast, some 100 km (62 mi) south of Brisbane and 25 km (16 mi) south of Surfers Paradise. The entrance to the airport is situated in the suburb of Bilinga on the Gold Coast. The runway itself straddles five suburbs of twin cities across the state border of Queensland and New South Wales. During summer these states are in two different time zones. R 2 = 0.64% S.T.= 0 2013(F) = 5,551,812 Pax Passengers Forecasting 2013 Edinburgh Airport Passengers Forecasting 2013 Avinor Airport Passengers Forecasting 2013 Gold Coast Airport 400,000 500,000 600,000 700,000 800,000 900,000 1,000,000 1,100,000 NoofPassengers TIME (Month) Forecast Actual R2 = 93 % S.T.= 0 2013(F) = 9,688,572 Pax 2,200,000 2,700,000 3,200,000 3,700,000 4,200,000 4,700,000 5,200,000 NoofPassengers TIME (Month) Forecast Actual R2 = 92 % S.T.= 0 2013(F) = 49,847,034 Pax 300,000 350,000 400,000 450,000 500,000 550,000 600,000 NoofPassengers TIME (Month) Forecast Actual R2 = 0.64 % S.T.= 0 2013(F) = 5,551,812 Pax CAMA Magazine | issue 17 | December, 2012 Airport forecasting
  • 7.
    Cairns Airport (IATA: CNS,ICAO: YBCS) is an international airport in Cairns, Queensland, Australia. Formerly operated by the Cairns Port Authority, the airport was sold by the Queensland Government in December 2008 to a private consortium. It is the seventh busiest airport in Australia. The airport is located 2.3 nautical miles (4.3 km; 2.6 mi) north northwest [1] of Cairns or 7 kilometres (4.3 mi) north of the Cairns central business district, in the suburb of Aeroglen. The airport lies between Mount Whitfield to the west and Trinity Bay to the east. R 2 = 92% S.T.= 0 2013(F) = 4,297,288 Pax [1] http://en.wikipedia.org/wiki/Main_Page Melbourne Airport (IATA: MEL, ICAO: YMML), also known as Tullamarine Airport, is the primary airport serving the city of Melbourne, and the second busiest airport in Australia. It was opened in 1970 to replace the nearby Essendon Airport. Melbourne Airport is the sole international airport of the four airports serving the Melbourne metropolitan area. The airport is 23 km (14 mi) from the city centre. The airport has its own postcode—Melbourne Airport, Victoria (postcode 3045). This is adjacent to the suburb of Tullamarine. R 2 = 83% S.T.= 0 2013(F) = 29,942,351 Pax Brisbane Airport (IATA: BNE, ICAO: YBBN) is the sole passenger airport serving Brisbane and is the third busiest airport in Australia after Sydney Airport and Melbourne Airport. Brisbane Airport has won many awards. Brisbane is currently served with 46 domestic destinations in all States and Territories and 32 international destinations. For the 12 months ending May 2011 total passengers were 20,056,416. R2 = 93% S.T.= 0 2013(F) = 21,932,169 Pax 33 Passengers Forecasting 2013 Brisbane Airport Passengers Forecasting 2013 Cairns Airport Passengers Forecasting 2013 Melbourne Airport 1,200,000 1,300,000 1,400,000 1,500,000 1,600,000 1,700,000 1,800,000 1,900,000 2,000,000 2,100,000 NoofPassengers TIME (Month) Forecast Actual R2 = 93 % S.T.= 0 2013(F) = 21,932,169 Pax 200,000 250,000 300,000 350,000 400,000 450,000 NoofPassengers TIME (Month) Forecast Actual R2 = 92 % S.T.= 0 2013(F) = 4,297,288 Pax 1,800,000 1,900,000 2,000,000 2,100,000 2,200,000 2,300,000 2,400,000 2,500,000 2,600,000 2,700,000 2,800,000 NoofPassengers TIME (Month) Forecast Actual R2 = 83 % S.T.= 0 2013(F) = 29,942,351 Pax CAMA Magazine | issue 17 | December, 2012 Airport forecasting