Predicting Aviation Industry Performance (L/F) - 2019
•
1 like•368 views

Developing targets is one of the major issues in the aviation industry. In the recent time, many aviation sources predict different figures, based on their own analysis, and sight for the global aviation market. The dilemma, that, there is no basic rules for the predictors, especially aircrafts manufacture companies.

Recommended
Recommended
More Related Content
What's hot
What's hot (10)
Similar to Predicting Aviation Industry Performance (L/F) - 2019
Similar to Predicting Aviation Industry Performance (L/F) - 2019 (20)
More from Mohammed Awad
More from Mohammed Awad (20)
Recently uploaded
Recently uploaded (20)
Predicting Aviation Industry Performance (L/F) - 2019
- 1. 1 | P a g e Predicting Aviation Industry Performance (L/F) – 2019 L/F %8082.
- 2. 2 | P a g e Predicting Aviation Industry Performance (L/F) - 2019 By: M. S. Awadh Introduction: Developing targets is one of the major issues in the aviation industry. In the recent time, many aviation sources predict different figures, based on their own analysis, and sight for the global aviation market. The dilemma, that, there is no basic rules for the predictors, especially aircrafts manufacture companies. As everyone comes with their own assumptions and approaches which lead to consequently different results. Off course there are many indicators to testify the forecasting figures, one of those is R square – Coefficient of Determination, even though this indicator is not fairly enough to implement and get the complete picture, It is worldwide aviation practice as a best fit indicator. In this article, a new concept is discussed, and two testify parameters are used. First is R – square – Coefficient of Determinations second is Tracking Errors, T.E. They are used as mapping tool on x-y coordinates for Displacement and Rotational factors that governed the mathematical model to deliver the best possible scenario to forecast. Aviation Data: ICAO is considered one of a main data source for aviation industry, which are generally published in their reports. Moreover, the main measuring performance factors of Air Transport aviation industry are – ASKs, RPKs, and Seat Load Factors (L/F). Since the Aviation industry (Airlines) is a service product industry. which is ASKs stand for Available Seat Kilometers, i.e what airlines are offered (Supply) , RPKs, stand for Revenue Passengers Kilometers, i.e, what airlines are gained (Demand), the filling rate of aircraft capacity is seat load factor (L/F) i.e L/F = RPKs/ASKs (Performance). For single point to point – city pair route load factor (L/F) = Passengers/Seats. ICAO monthly reports address these parameters in Economic Development bulletin.
- 3. 3 | P a g e Forecasting Model: Actually, the forecasting process has two stages, Evaluation and Forecasting. In the evaluation stage we are trying to analysis the input data, and align the practical data with a mathematical model, we use a state of art forecasting program to fit data. Two control factors have a great impact on the seasonality model. First displacement factor (Displacement Issue), this factor acts to shift the whole data from its running path to a new one but keeping the trend and direction of the analysis. While the Second factor is Directional factor, definitely, if we manipulate this factor and try to use many trail values (positive and negative value), the model will position itself accordingly as a clock around the origin. The typical forecasting model is subjecting to many shocks, cycles, summer season, winter season, back to school, Haj season and a Chrisms time. Forecasting 2019: 1- RPKs Forecasting a. Annually b. Monthly 2- ASKs Forecasting a. Annually b. Monthly 3- Predicting Aviation Industry Performance
- 4. 4 | P a g e 1- RPKs Forecasting a. Setting RPKs - Annual Target : The best way to set up annual target and minimize the data discrepancy is to address the data by two trend models using the concept of 12 months rolling method for RPKs and ASKs. Here we implement two trend models by using Add a trend line in XLS sheet: First – General Trend Model using the concept of Straight Line equation. Second – Most Recent Data Trend Model Using a Polynomial Model – Second-degree equation. This reflects the impact of most recent data on the path of general trend. The mid-point is the most convenient forecast annual result at Dec 2019. As long as the gap between two models is small, the more accurate approaching value for setting annual target (Dec 2019) otherwise we have to select the half way distance between two extreme targets of these models. As shown below a. Annual Forecasting – Using 12 Months Rolling Concept. b. Monthly Forecasting – Define Seasonality
- 5. 5 | P a g e 2- ASKs Forecasting: Repeat the same approach for ASKs a- Annual Forecasting – Using 12 Months Rolling Concept. b- Monthly Forecasting – Define Seasonality
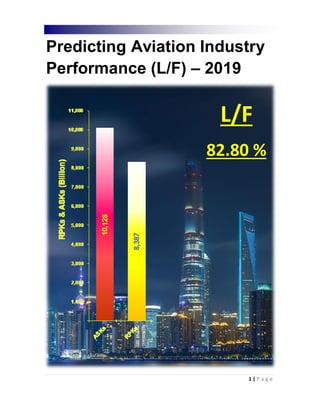
- 6. 6 | P a g e 3- Predicting Aviation Industry Performance - 2019 Load Factor can be calculated based on the basic equation i.e RPKs/ASKs i.e Revenue Passenger Kilometers divided by Available Seat Kilometers. The expected annual load factor will be 82.80 %. The highest peak value is August (86.36 %). While the lowest season is November (80.96 %) for 2019. Forecasting Accuracy: Based on the model figures for RPKs, and ASKs, we calculates the percentage errors (with actual data), so the maximum percentage errors for RPKs is not exceed than + 1.91 and not less than – 2.36 %, while for ASKs is not exceed than + 1.27 and not less than – 3.07 %. Results: A 2019 is forecasted The expected RPKs for 2019 will be = 8,387 Billion RPKs at a growth: 6.87 % The expected ASKs for 2019 will be = 10,128 Billion ASKs at a growth: 6.05 % The expected Load Factor for 2019 = 82.80 %.
- 7. 7 | P a g e Summary: ICAO reports are the main data source, for aviation performance indicators as ASKs, RPKs and Load Factor, The article address two forecasting approaches Annually Forecast – where we apply 12 Months Rolling Concept using two different trend models. First model the general trend model, defining the general trend. the second is the polynomial model – second degree, defining the impact of the most recent data on the new model, As long as the gap between two models is small, the more accurate approaching value for setting annual target (Dec 2019). Otherwise, we have to select the half way distance between two extreme targets of these models. Monthly Forecast – once we define the annual target, we used that value (target) to define the monthly forecasting pattern, for that a new concept is applied – i.e Max/Min Tracking Errors approach – to forecast the Aviation Industry Performance in terms of RPKs and ASKs. All the performance factors are in a Fair situation i.e ASKs, and RPKs. this clearly supported by the Errors graph for ASKs, RPKs. Finally, a 2019 Forecast will be as follows: The expected RPKs, ASKs for 2019 will be = 8,387 Billion RPKs at a growth: 6.87 %, 10,128 Billion ASKs at a growth: 6.05 % respectively at Load Factor = 82.80 %. ■ Date of Issue: 21 Dec. 2018 Author: Mohammed Salem Awadh Chairman Adviser YEMENIA – Yemen Airways Email: smartdecision2002@yahoo.com