Is Low Cost Carrier Norwegian Profitable
•
0 likes•106 views

This document discusses using cost per available seat kilometer (CASK) and revenue per available seat kilometer (RASK) to evaluate the profitability of low-cost carriers like Norwegian. It presents a mapping table analyzing profits and losses across a range of CASK and load factor values. The analysis finds that with Norwegian's 2017 CASK of $0.05 per seat kilometer and 86.1% load factor, the airline is profitable, generating over $800,000 in profits. The mapping table is described as a powerful tool for airlines to clearly understand their financial situation based on costs and performance metrics.

Recommended
More Related Content
What's hot
What's hot (20)
Similar to Is Low Cost Carrier Norwegian Profitable
Similar to Is Low Cost Carrier Norwegian Profitable (20)
More from Mohammed Awad
More from Mohammed Awad (20)
Recently uploaded
Recently uploaded (20)
Is Low Cost Carrier Norwegian Profitable
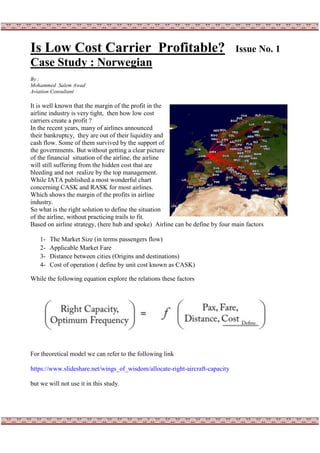
- 1. Is Low Cost Carrier Profitable? Issue No. 1 Case Study : Norwegian By : Mohammed Salem Awad Aviation Consultant It is well known that the margin of the profit in the airline industry is very tight, then how low cost carriers create a profit ? In the recent years, many of airlines announced their bankruptcy, they are out of their liquidity and cash flow. Some of them survived by the support of the governments. But without getting a clear picture of the financial situation of the airline, the airline will still suffering from the hidden cost that are bleeding and not realize by the top management. While IATA published a most wonderful chart concerning CASK and RASK for most airlines. Which shows the margin of the profits in airline industry. So what is the right solution to define the situation of the airline, without practicing trails to fit. Based on airline strategy, (here hub and spoke) Airline can be define by four main factors 1- The Market Size (in terms passengers flow) 2- Applicable Market Fare 3- Distance between cities (Origins and destinations) 4- Cost of operation ( define by unit cost known as CASK) While the following equation explore the relations these factors For theoretical model we can refer to the following link https://www.slideshare.net/wings_of_wisdom/allocate-right-aircraft-capacity but we will not use it in this study.
- 2. 2 2 CASK Evaluation: CASK which is stand for Cost per Available Seat Kilometer, it is globally used in Aviation industry, it is reflect the cost supply in service production system, as Airlines. The CASK for Low Cost Carriers from 0.04 – 0.08 USD/ASK (Blue Dots), with respects Average Trip Length (Stage Length) CAPA source. While IATA published a world graph representing CASK and RASK (Revenue per Available Seat Kilometers ) – at IATA Economics Chart of the Week. So at a breakeven level, RASK equal CASK These two terms governed the airline network that utilize the concept of Origin and Destination system. The dot red line shows the level of unit cost equal unit revenue. While the size of the dots represent by total revenue. The aim of defining Norwegian CASK, is to positioning the size of aircraft used by Airline with respect to applicable load factor that represents / results 72 destinations (LGW hub) According to the bar chart by Norwegian, the CASK of the airline at 2017 was 0.05 USD/ASK. . Inputs: Norwegian – Case Study Market Size – Demand Passenger which related to number of Frequency here, Passengers for each routes can be collected from Eurostat web site form LGW i.e. 72 Sector – Norwegian UK – Network. Applicable Fare – which is impact on the Size (capacity) of Aircraft. Distance between Airports : it is almost fixed figure, when but we come to design a network, we have to decide whether we need to operate short, medium or long-haul operation. Cost : it is well known cost parameter define a term CASK ( cost per available seat kilometer ) from 0.01 to 0.1 USD, used as step function to develop a mapping table for airline (Cask, Load Factor, and Profit).
- 3. 3 3 In case of Norwegian – Number of Routes = 72, Aircraft type : Boeing 737Max Aircraft Capacity : 189 seats Applicable Market Fare from website. Norwegian Load Factor : 86.1% (at 2019) Operation : one way Frequency: one ( 1 ) Analysis: (mapping table) Construct the first data analysis table at Cask =0.01 and load factor = 0.1 to get the final results either profits or losses for the whole network. Here it is profit = 12,832 USD per network. Repeat this calculation, i.e 100 times for different levels for load factors and the corresponding values of Casks. Results : We get a Mapping Table for Profits/Losses. Profits at a Green Regions, and Losses at Red Regions. Mapping Table: Positioning Norwegian : Norwegian is defined by it CASK = 0.05 USD and Load Factor = 0.86 From mapping table at CASK (0.05) : Profit at Load Factor 0.80 = 728,409 USD Profit at Load Factor 0.90 = 949,825 USD Profits at load Factor 0.86 = 861,258 USD Conclusions : Mapping table is a powerful tool for airlines, its gives a clear picture for the airline situation in terms of performance (Load Factor) and cost (CASK) to define either it is profitable or not. In this study Norwegian is a Profitable Airline. Profits Losses