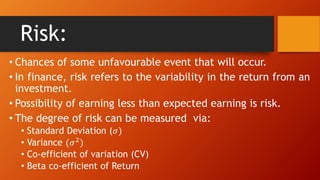
The document discusses risk and return in investments. It defines key concepts like holding period return (HPR), expected return, standard deviation, variance, and coefficient of variation. It provides examples of calculating HPR for stocks based on purchase price, selling price, and dividends. Expected return is the average HPR and can be calculated in different ways. Risk is the variability in returns and can be measured using standard deviation, variance, beta, etc. The document also discusses portfolio returns and how to calculate expected portfolio return based on individual asset expected returns and weights.


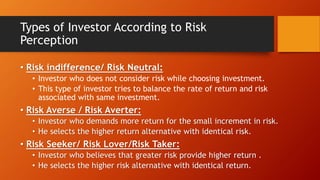
![Portfolio Risk (𝜎𝑃)
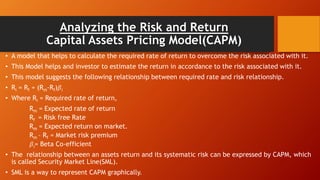
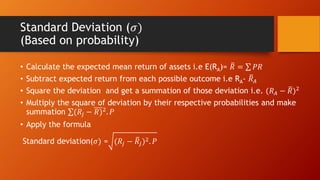
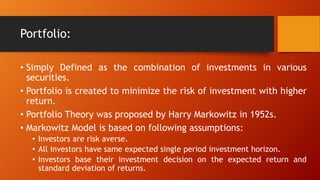
• Aggregate risk of assets included in the portfolio.
• It is not the weighted average of standard deviation of individual securities included
in portfolio.
• The portfolio risk does not depend only upon the risk of individual risk but also on
the relationship(correlation and covariance) between return of two assets.
• 𝜎𝑝 = 𝜎𝐴
2
. 𝑊𝐴
2
+ 𝜎𝐵
2
𝑊𝐵
2
+ 2𝑊𝐴. 𝑊𝐵𝐶𝑜𝑟𝐴𝐵𝜎𝐴𝜎𝐵 OR 𝜎𝐴
2
. 𝑊𝐴
2
+ 𝜎𝐵
2
𝑊𝐵
2
+ 2𝑊𝐴. 𝑊𝐵𝐶𝑜𝑣𝐴𝐵
• Or, [𝑅𝑃 − 𝐸(𝑅𝑃)]2. 𝑃𝑖 (If probability is given )
• 𝑉𝑎𝑟𝑖𝑎𝑛𝑐𝑒 𝑜𝑓 𝑜𝑓 𝑝𝑜𝑟𝑡𝑓𝑜𝑙𝑖𝑜 = 𝜎𝑝
2 CV of portfolio =
𝜎𝑝
𝑅𝑝](https://image.slidesharecdn.com/riskandreturnconcept-220814145946-73b8f7c7/85/risk-and-return-concept-pptx-26-320.jpg)
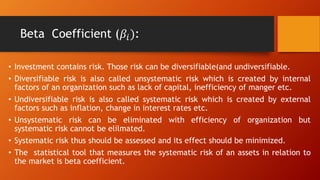
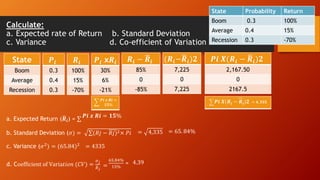
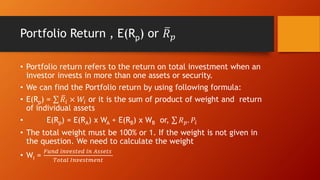
![Methods to calculate Portfolio return
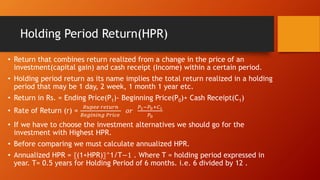
• Find Expected return of
individual assets.
• Find standard deviation of each
assets.
• Find covariance of two assets.
• Use the formula of portfolio
standard deviation which
includes covariance
• Find individual portfolio return
RP by using formula WA.RA+ WB.RB
• Multiply the Rp with probability
and get summation. Which is
expected portfolio return E(Rp).
• Find [Rp-E(Rp)]2.Pi
• Use the formula
[Rp−E(Rp)]2.Pi and get
portfolio standard deviation.](https://image.slidesharecdn.com/riskandreturnconcept-220814145946-73b8f7c7/85/risk-and-return-concept-pptx-27-320.jpg)
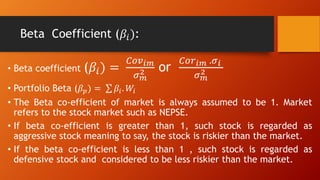
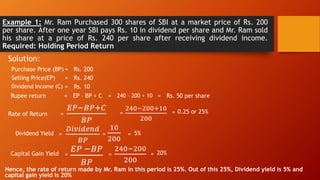
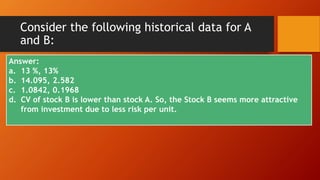
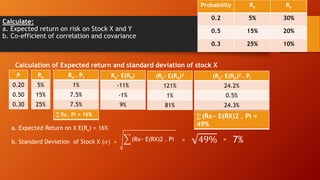
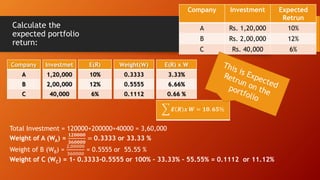
![Consider the given information and answer the questions:
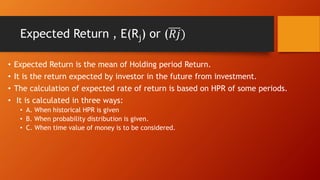
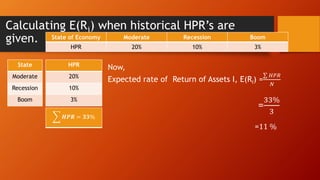
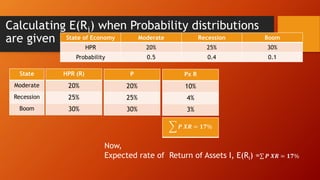
a. Calculate the expected rate of return for each stock and portfolio if
equal amount of money is invested in each stock.
b. Calculate standard deviation for each stock
Scenario P
Rate of Return
Stock A Stock B
Recession 0.3 5% 30%
Normal 0.40 10 20
Boom 0.30 15 10
Scenario
Recession
Normal
Boom
Pi
0.3
0.4
0.3
RA
5%
10
15
RB
30%
20
10
RA.Pi RB.Pi
Expected Return on Stock A, E(RA) = 𝑅𝐴. 𝑃𝐼
Expected Return on Stock B, E(RB) = 𝑅𝐵. 𝑃𝐼
Expected Return on Portfolio, E(Rp) = WA E(RA) + WB. E(RB)
Since equal amount is invested in both stocks WA= WB= 0.5
[RA – E(RA)] [RA – E(RA)]2.PI
Standard Deviation of stock A, (𝜎𝐴) = [RA – E(RA)]2.PI](https://image.slidesharecdn.com/riskandreturnconcept-220814145946-73b8f7c7/85/risk-and-return-concept-pptx-28-320.jpg)
![Consider the given information and answer the questions:
a. Calculate the expected rate of return for each stock and portfolio if
equal amount of money is invested in each stock.
b. Calculate standard deviation for each stock
Scenario P
Rate of Return
Stock A Stock B
Recession 0.3 5% 30%
Normal 0.40 10 20
Boom 0.30 15 10
Scenario
Recession
Normal
Boom
Pi
0.3
0.4
0.3
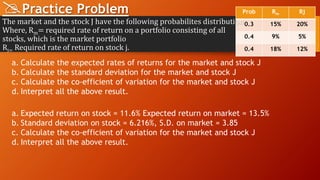
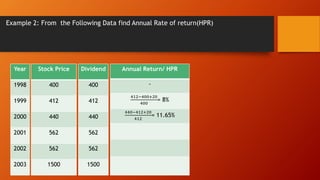
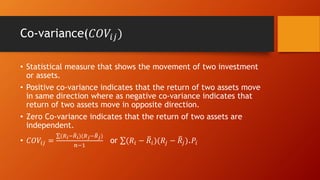
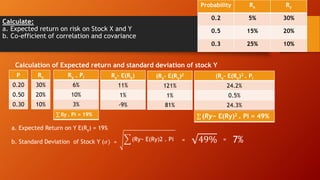
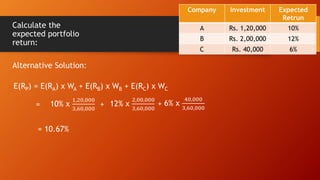
[RB – E(RB)] [RB – E(RB)]2.PI
Standard Deviation of stock B, (𝜎𝐵) = [RB – E(RB)]2.PI
Standard Deviation of Portfolio, (𝜎𝑝) = 𝜎𝐴
2
. 𝑊𝐴
2
+ 𝜎𝐵
2
𝑊𝐵
2
+ 2𝑊𝐴. 𝑊𝐵𝐶𝑜𝑣𝐴𝐵
Where COVAB= (𝑅𝐴 − 𝑅𝐴)(𝑅𝐵 − 𝑅𝐵).𝑃𝑖
[RA – E(RA)] [RB – E(RB)]](https://image.slidesharecdn.com/riskandreturnconcept-220814145946-73b8f7c7/85/risk-and-return-concept-pptx-29-320.jpg)
![Consider the given information and answer the questions:
a. Calculate the expected rate of return for each stock and portfolio if
equal amount of money is invested in each stock.
b. Calculate standard deviation for each stock
Scenario P
Rate of Return
Stock A Stock B
Recession 0.3 5% 30%
Normal 0.40 10 20
Boom 0.30 15 10
Scenario
Recession
Normal
Boom
Pi
0.3
0.4
0.3
RA
5%
10
15
RB
30%
20
10
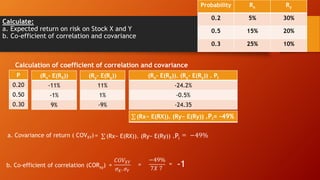
RP= 0.5xRA+ O.5 x RB
0.5 x 5 + 0.5 x 30 = 17.5
0.5 x 10 + 0.5 x 20 = 15
0.5 x 15 + 0.5 x 10 = 12.5
ALTERNATIVE SOLUTION :
RP.Pi
17.5 x 0.3 = 5.25
15 x 0.4 = 6
12.5 x 0.3 = 3.75
E(Rp) = 𝑹𝑷. 𝑷𝑰 = 15%
Expected Return on portfolio E(Rp) = 𝑹𝑷. 𝑷𝑰 = 15%
Now, Find [Rp- E(Rp)] it’s square and multiply with Pi to get [𝑅𝑃 − 𝐸(𝑅𝑃)]2. 𝑃𝑖
Portfolio standard deviation (𝜎𝑃) = [𝑅𝑃 − 𝐸(𝑅𝑃)]2. 𝑃𝑖](https://image.slidesharecdn.com/riskandreturnconcept-220814145946-73b8f7c7/85/risk-and-return-concept-pptx-30-320.jpg)