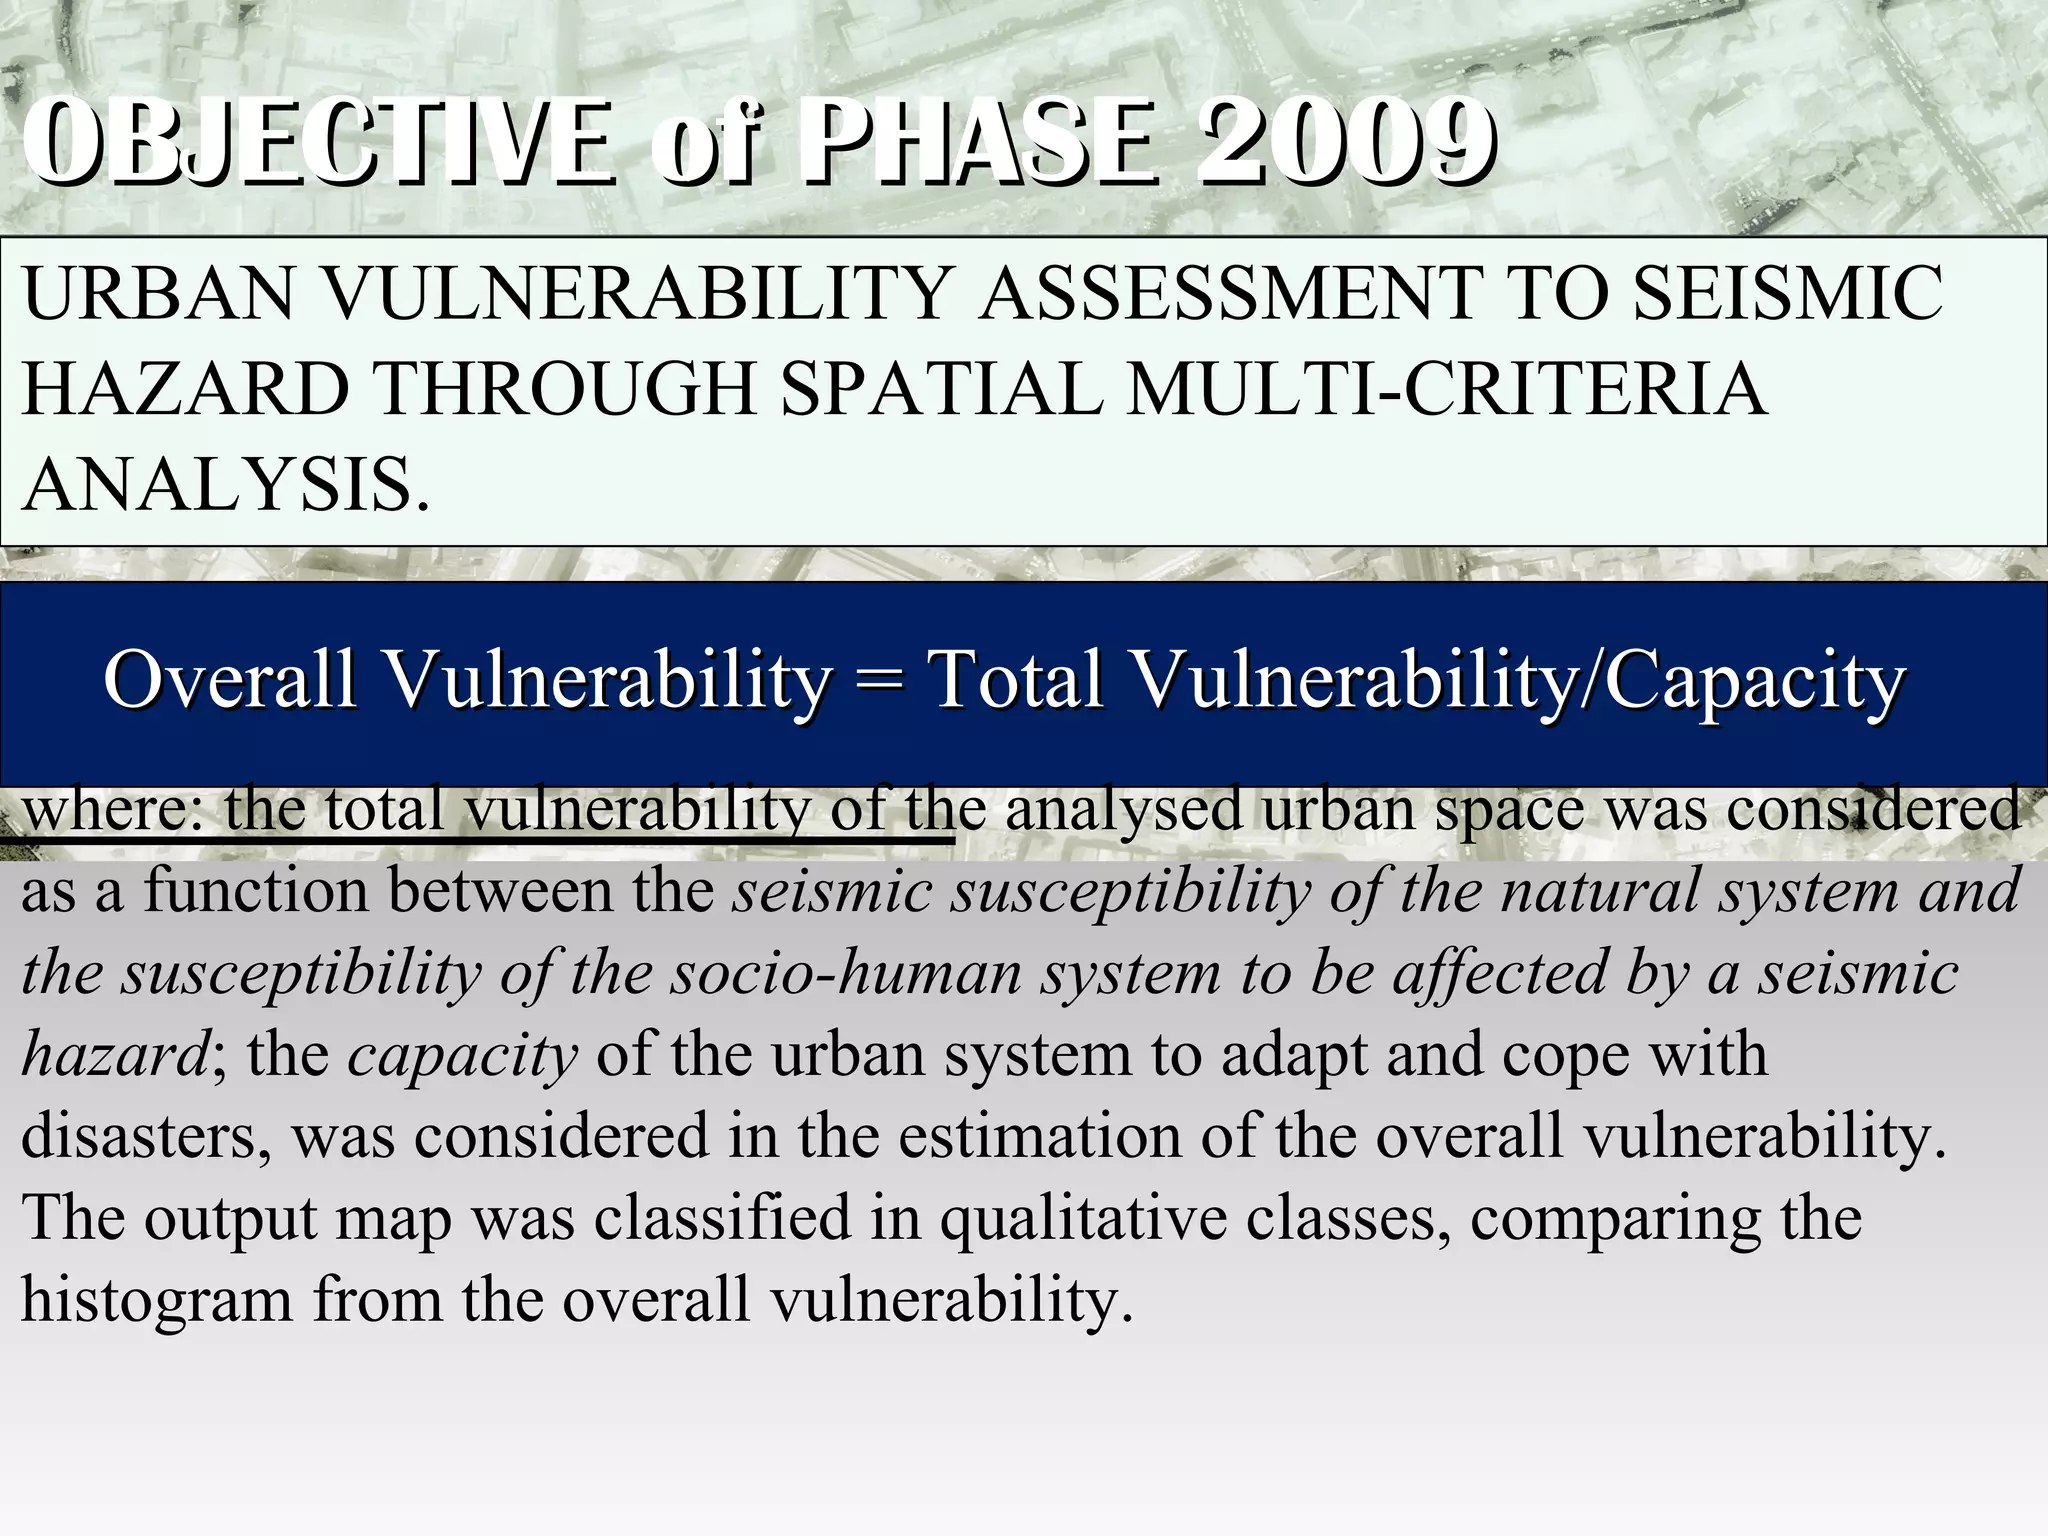
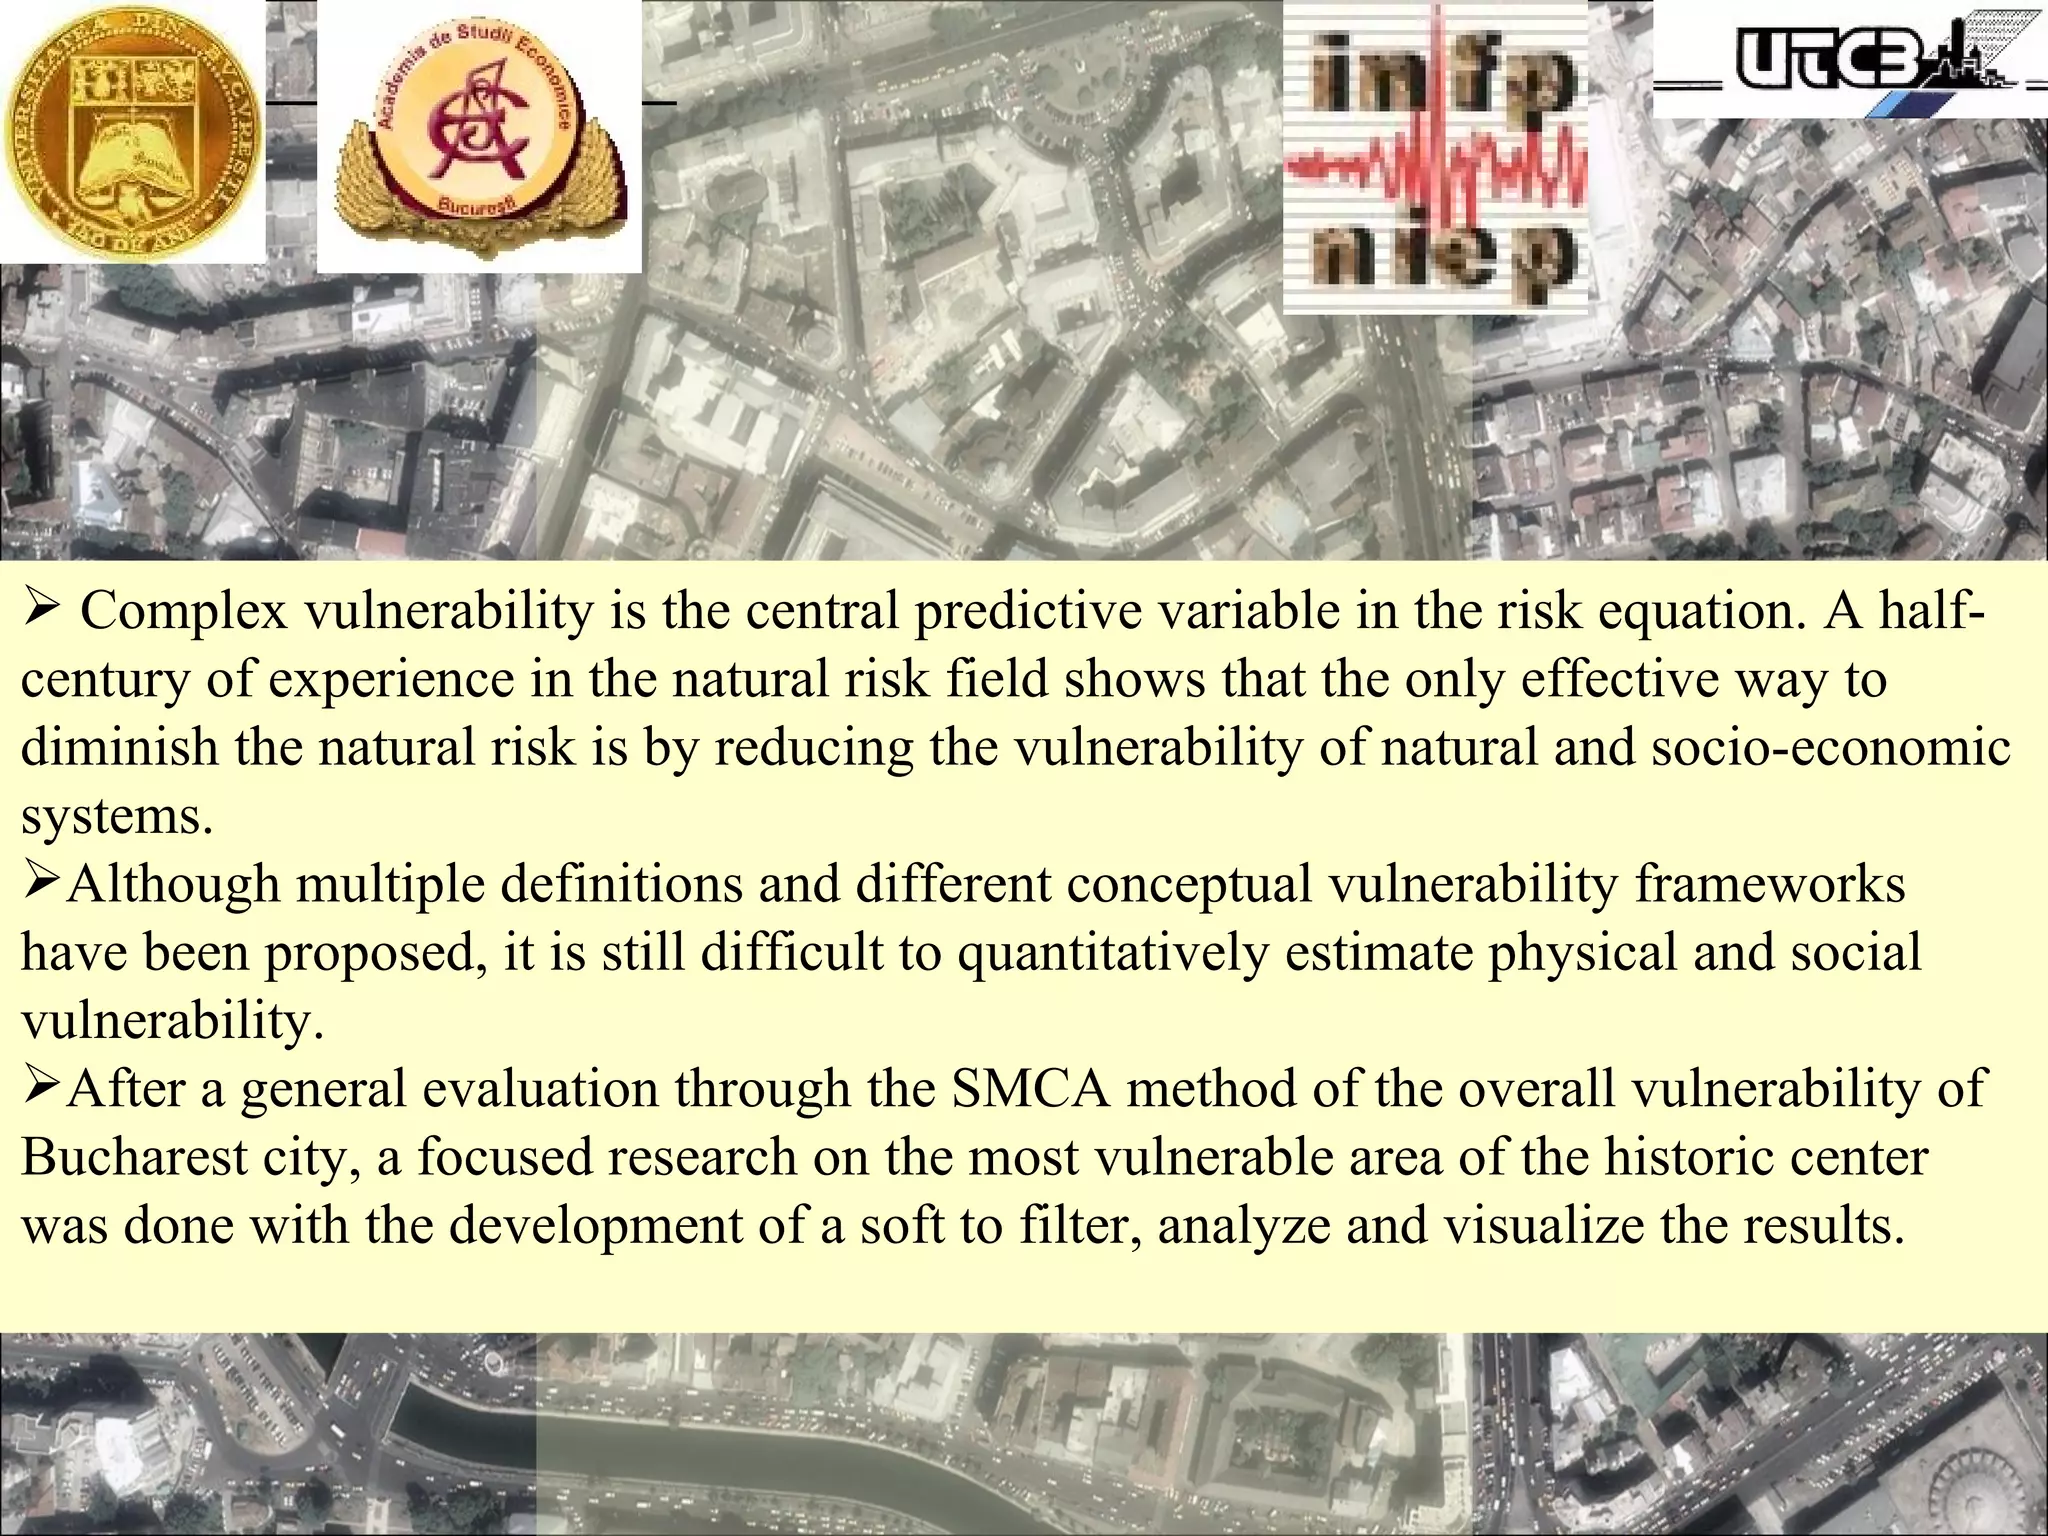
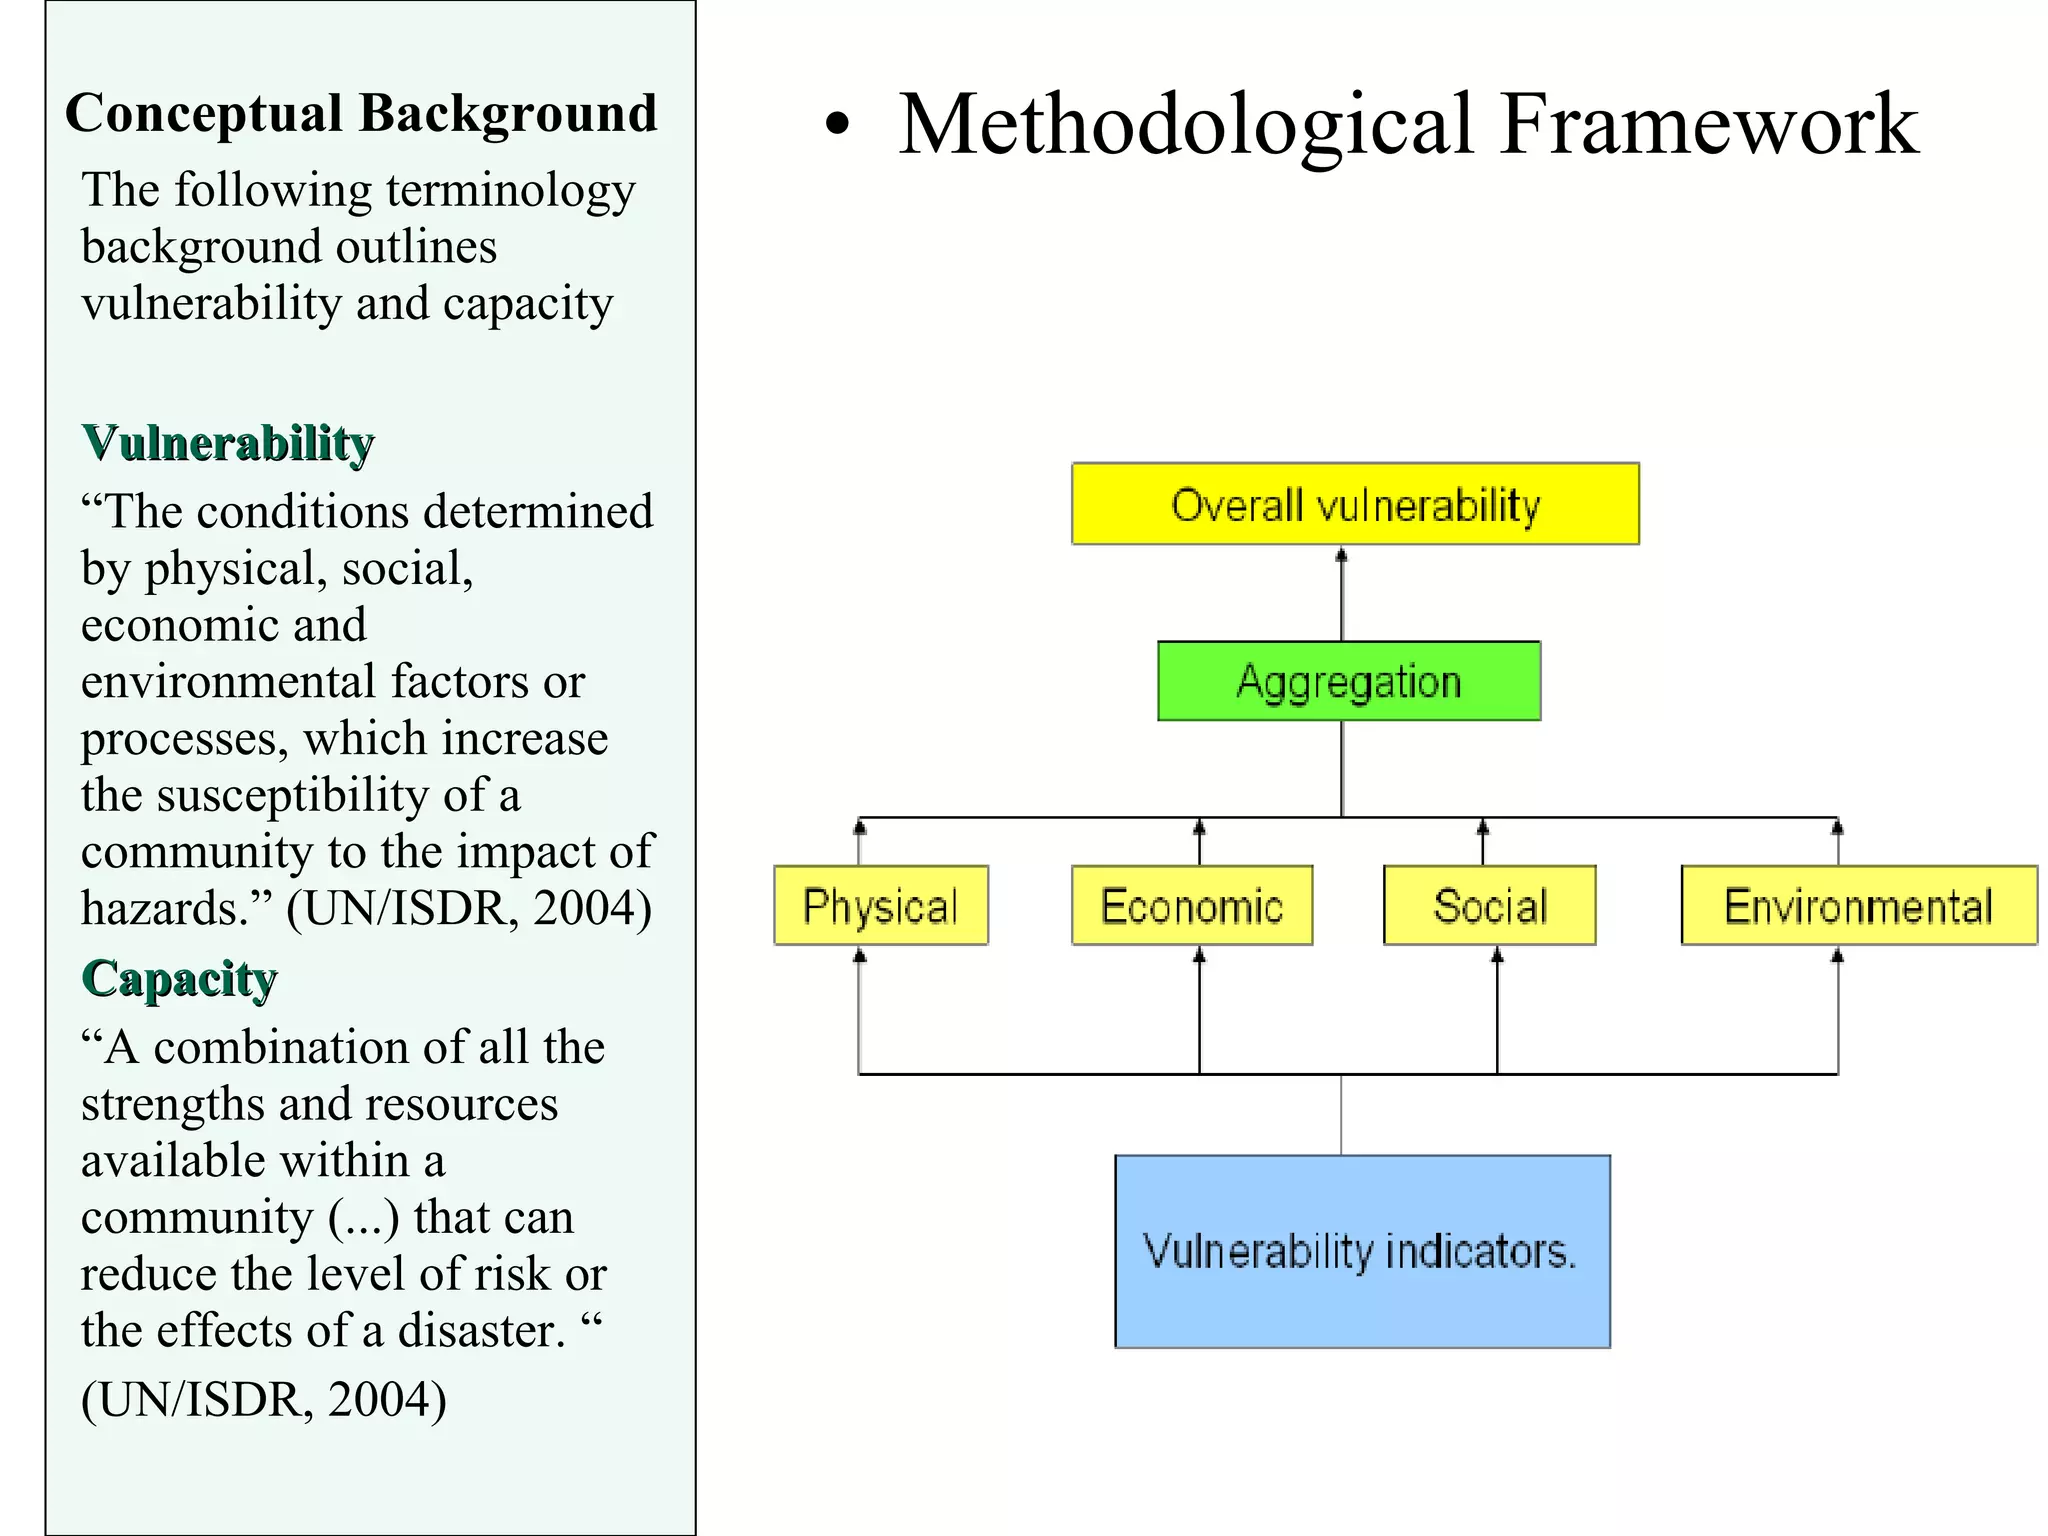
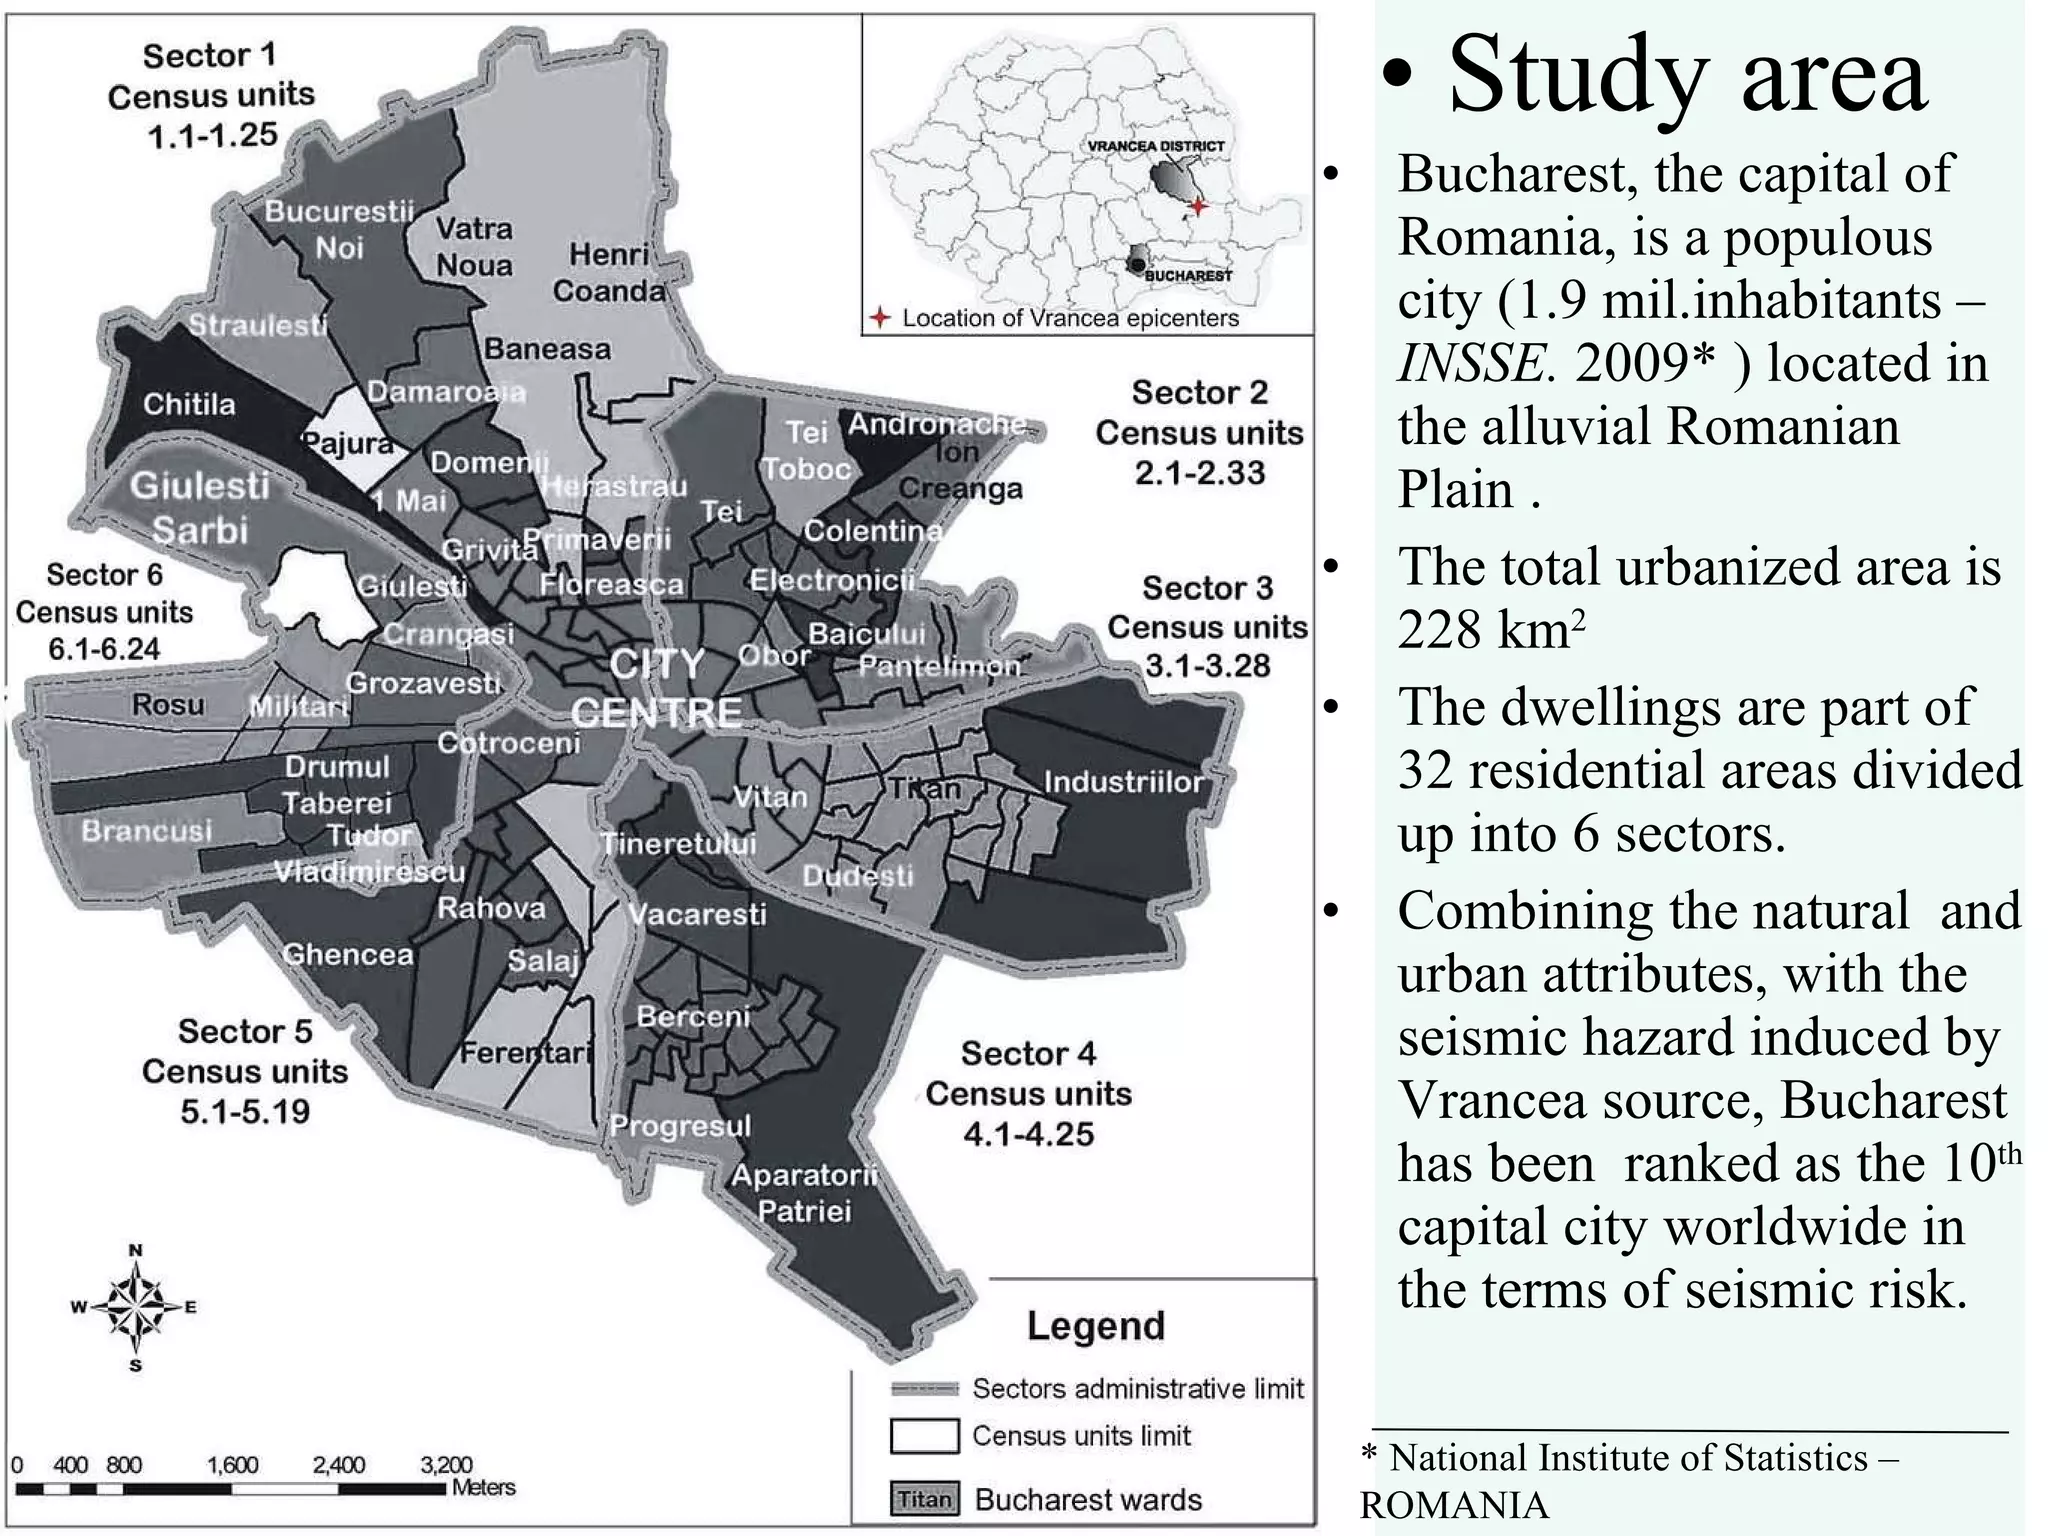
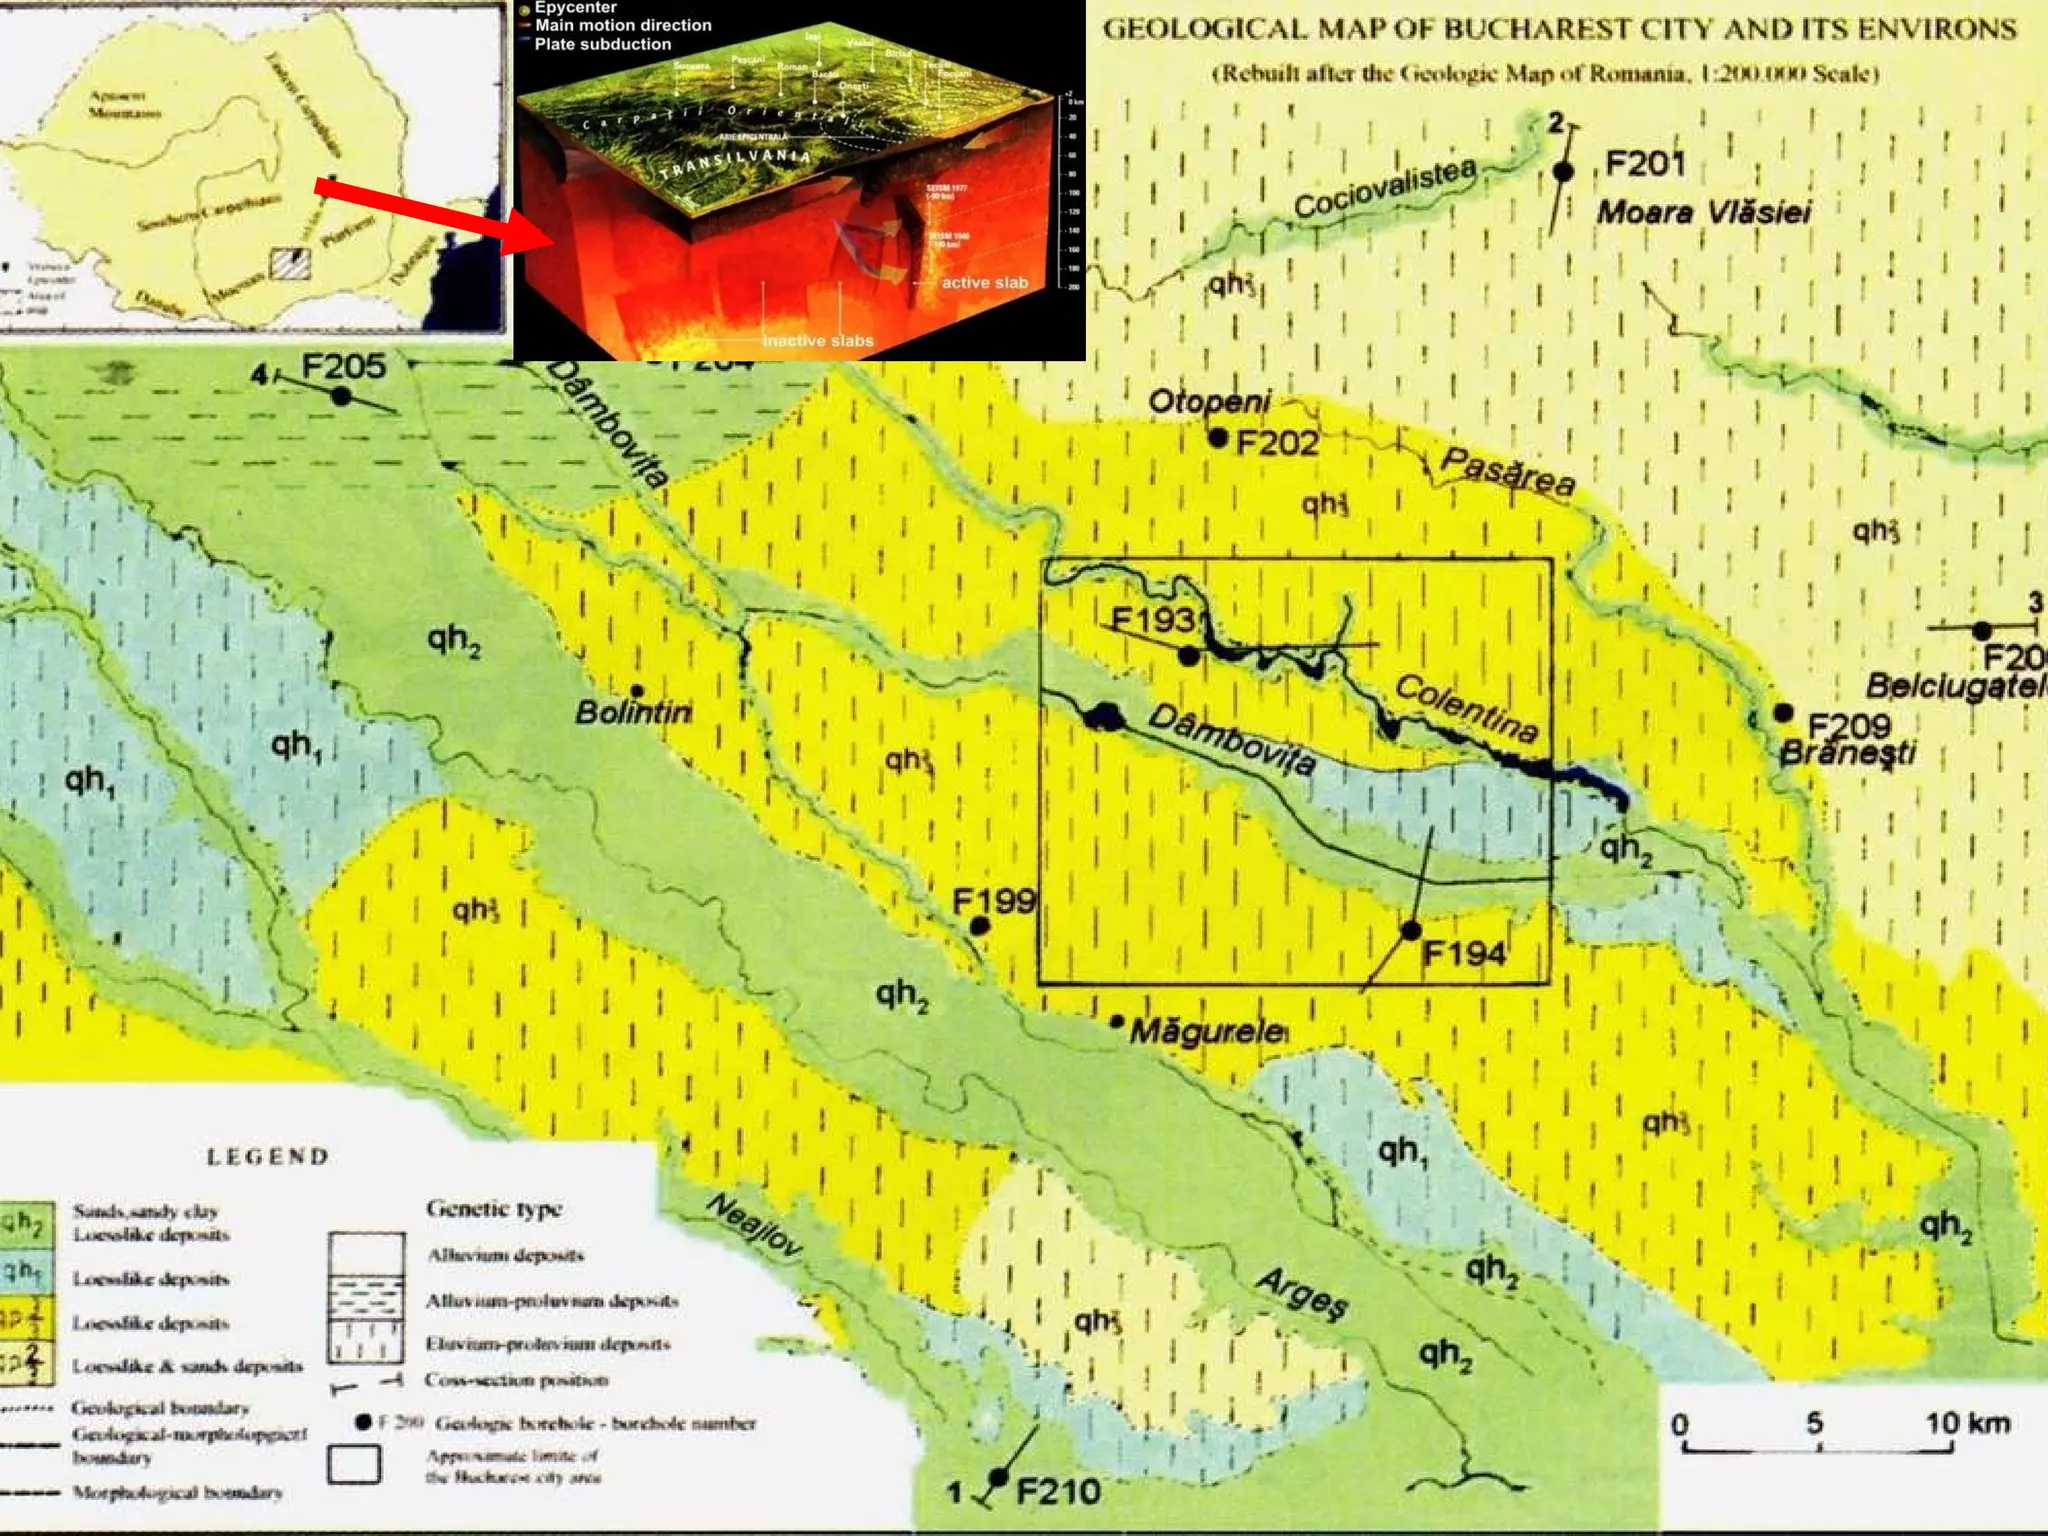
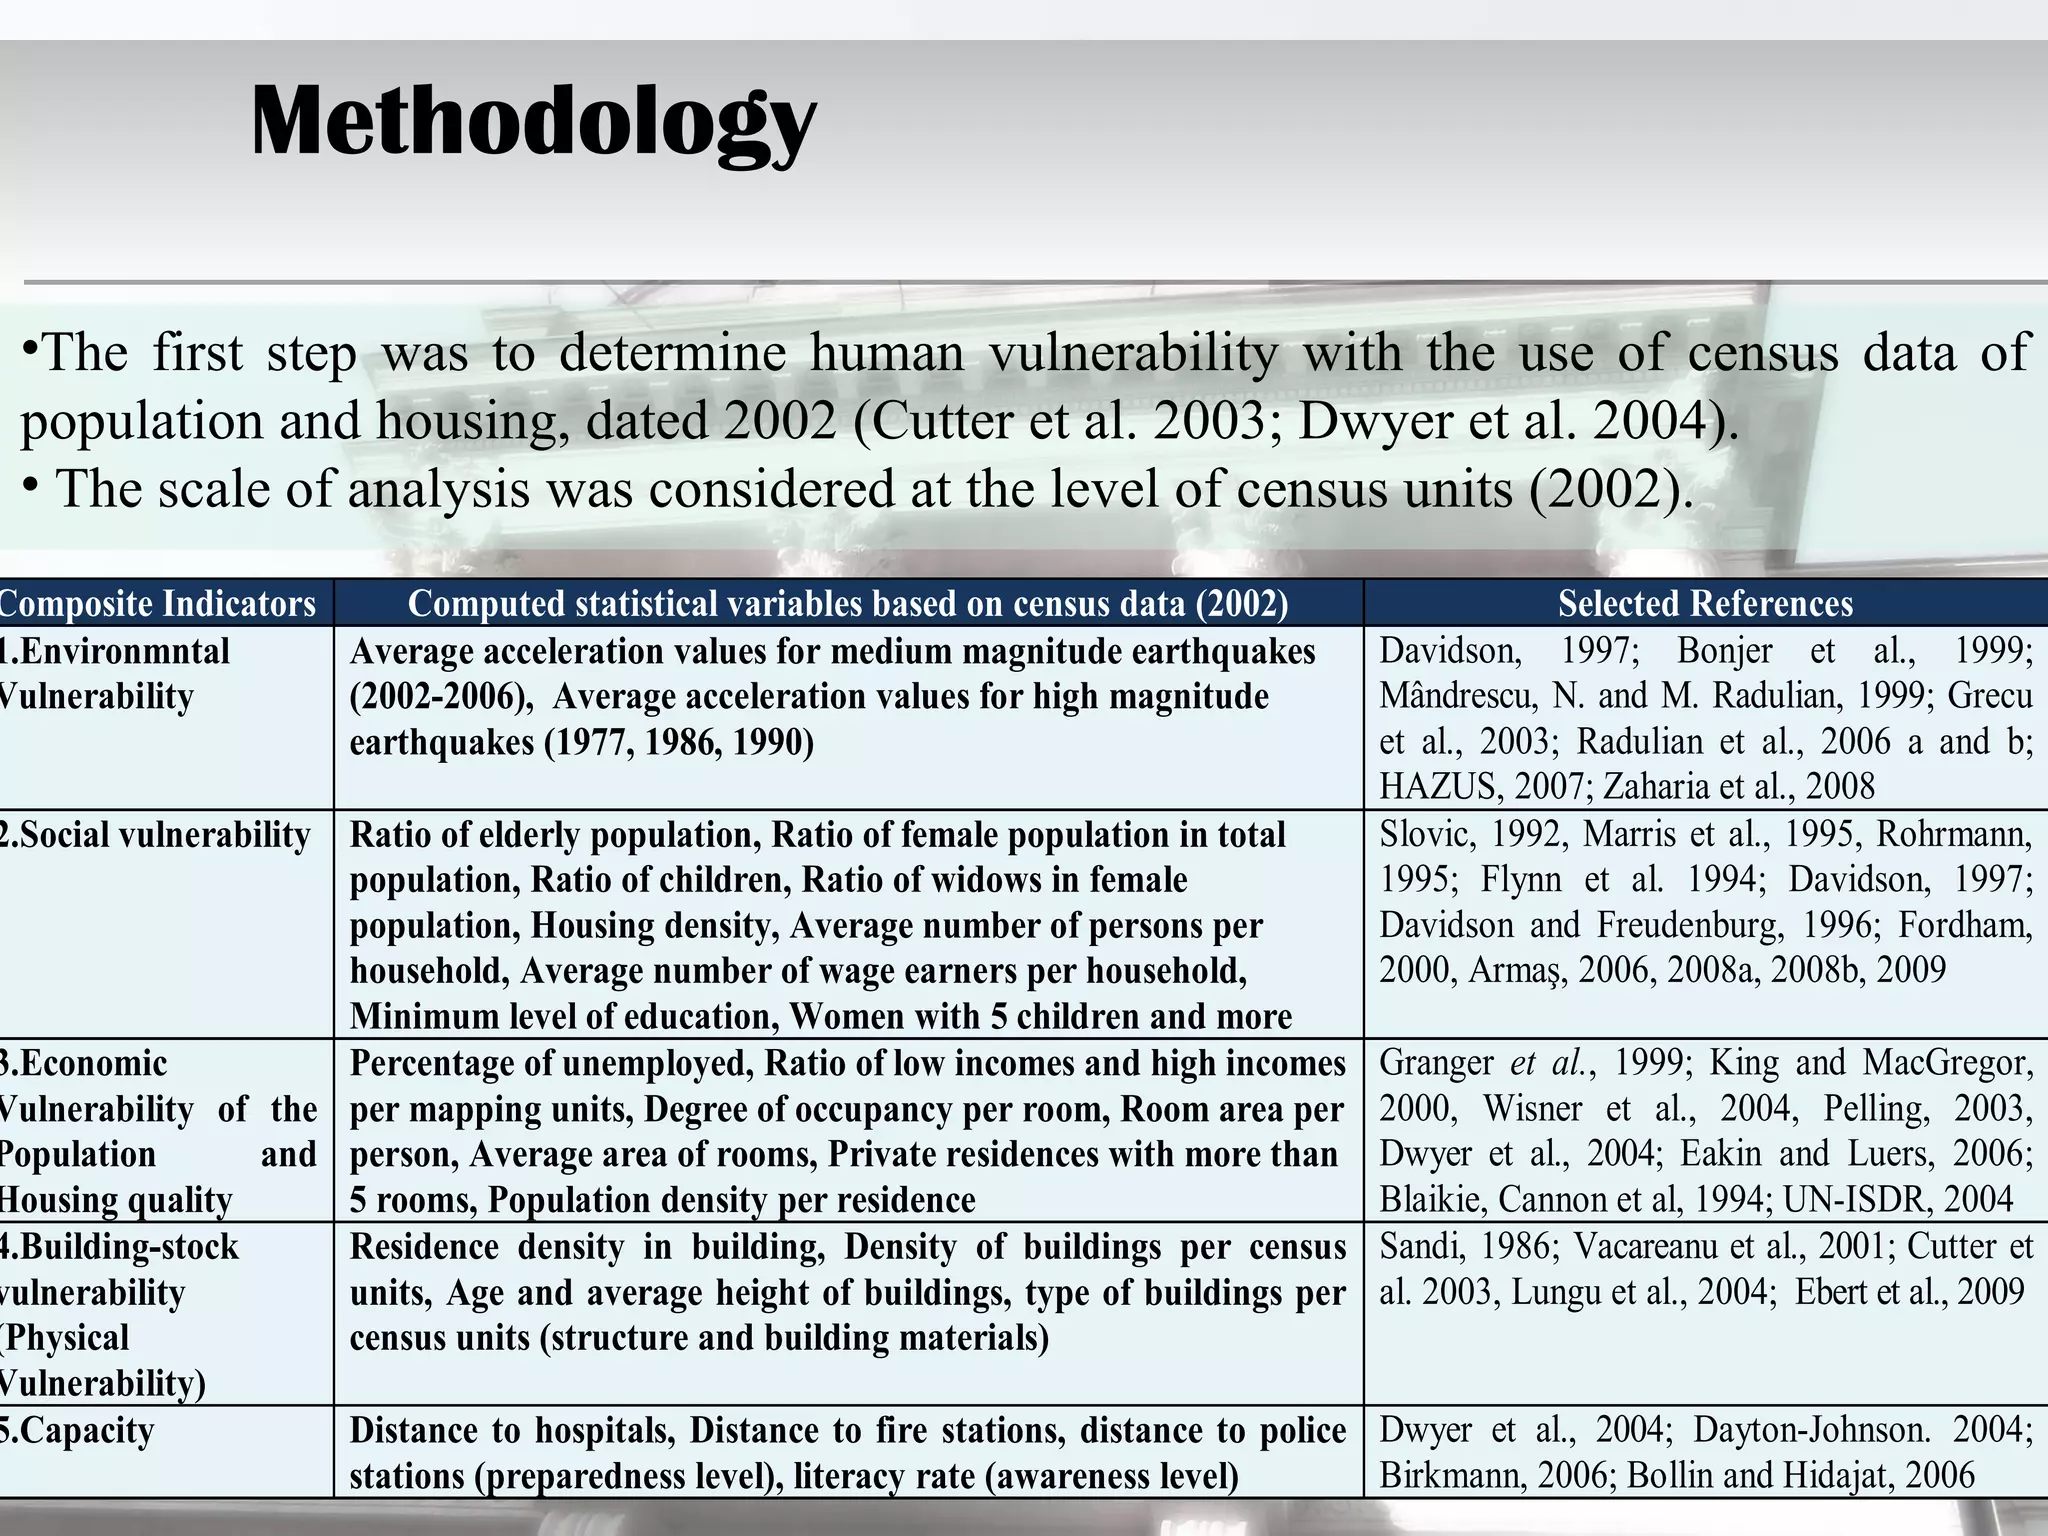
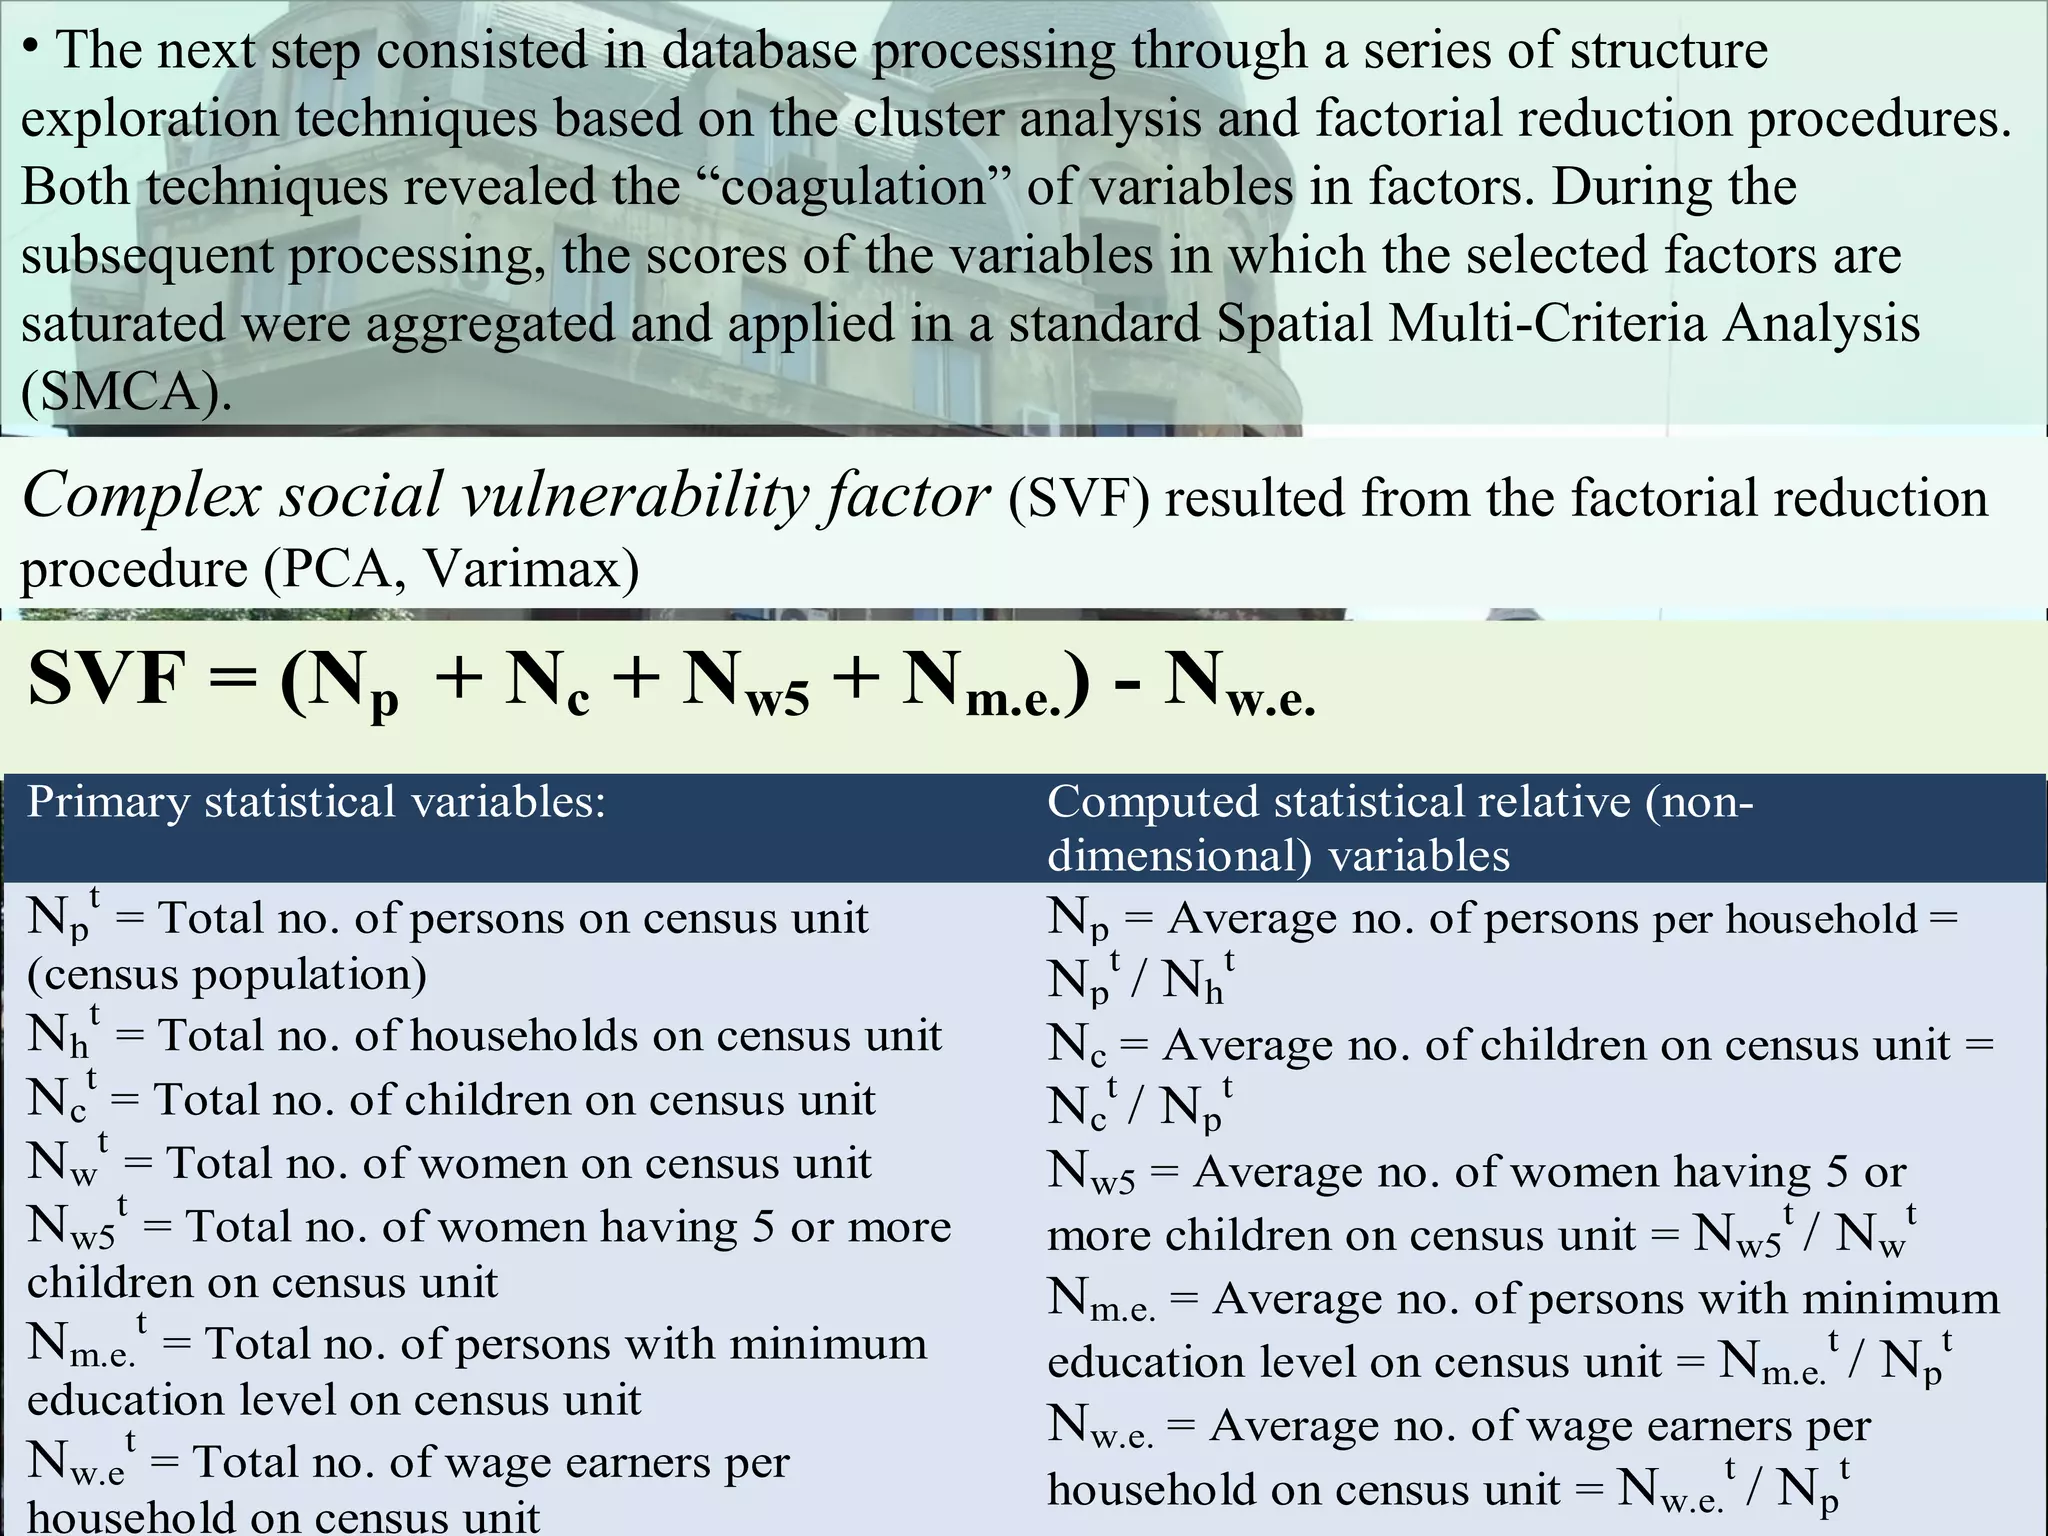
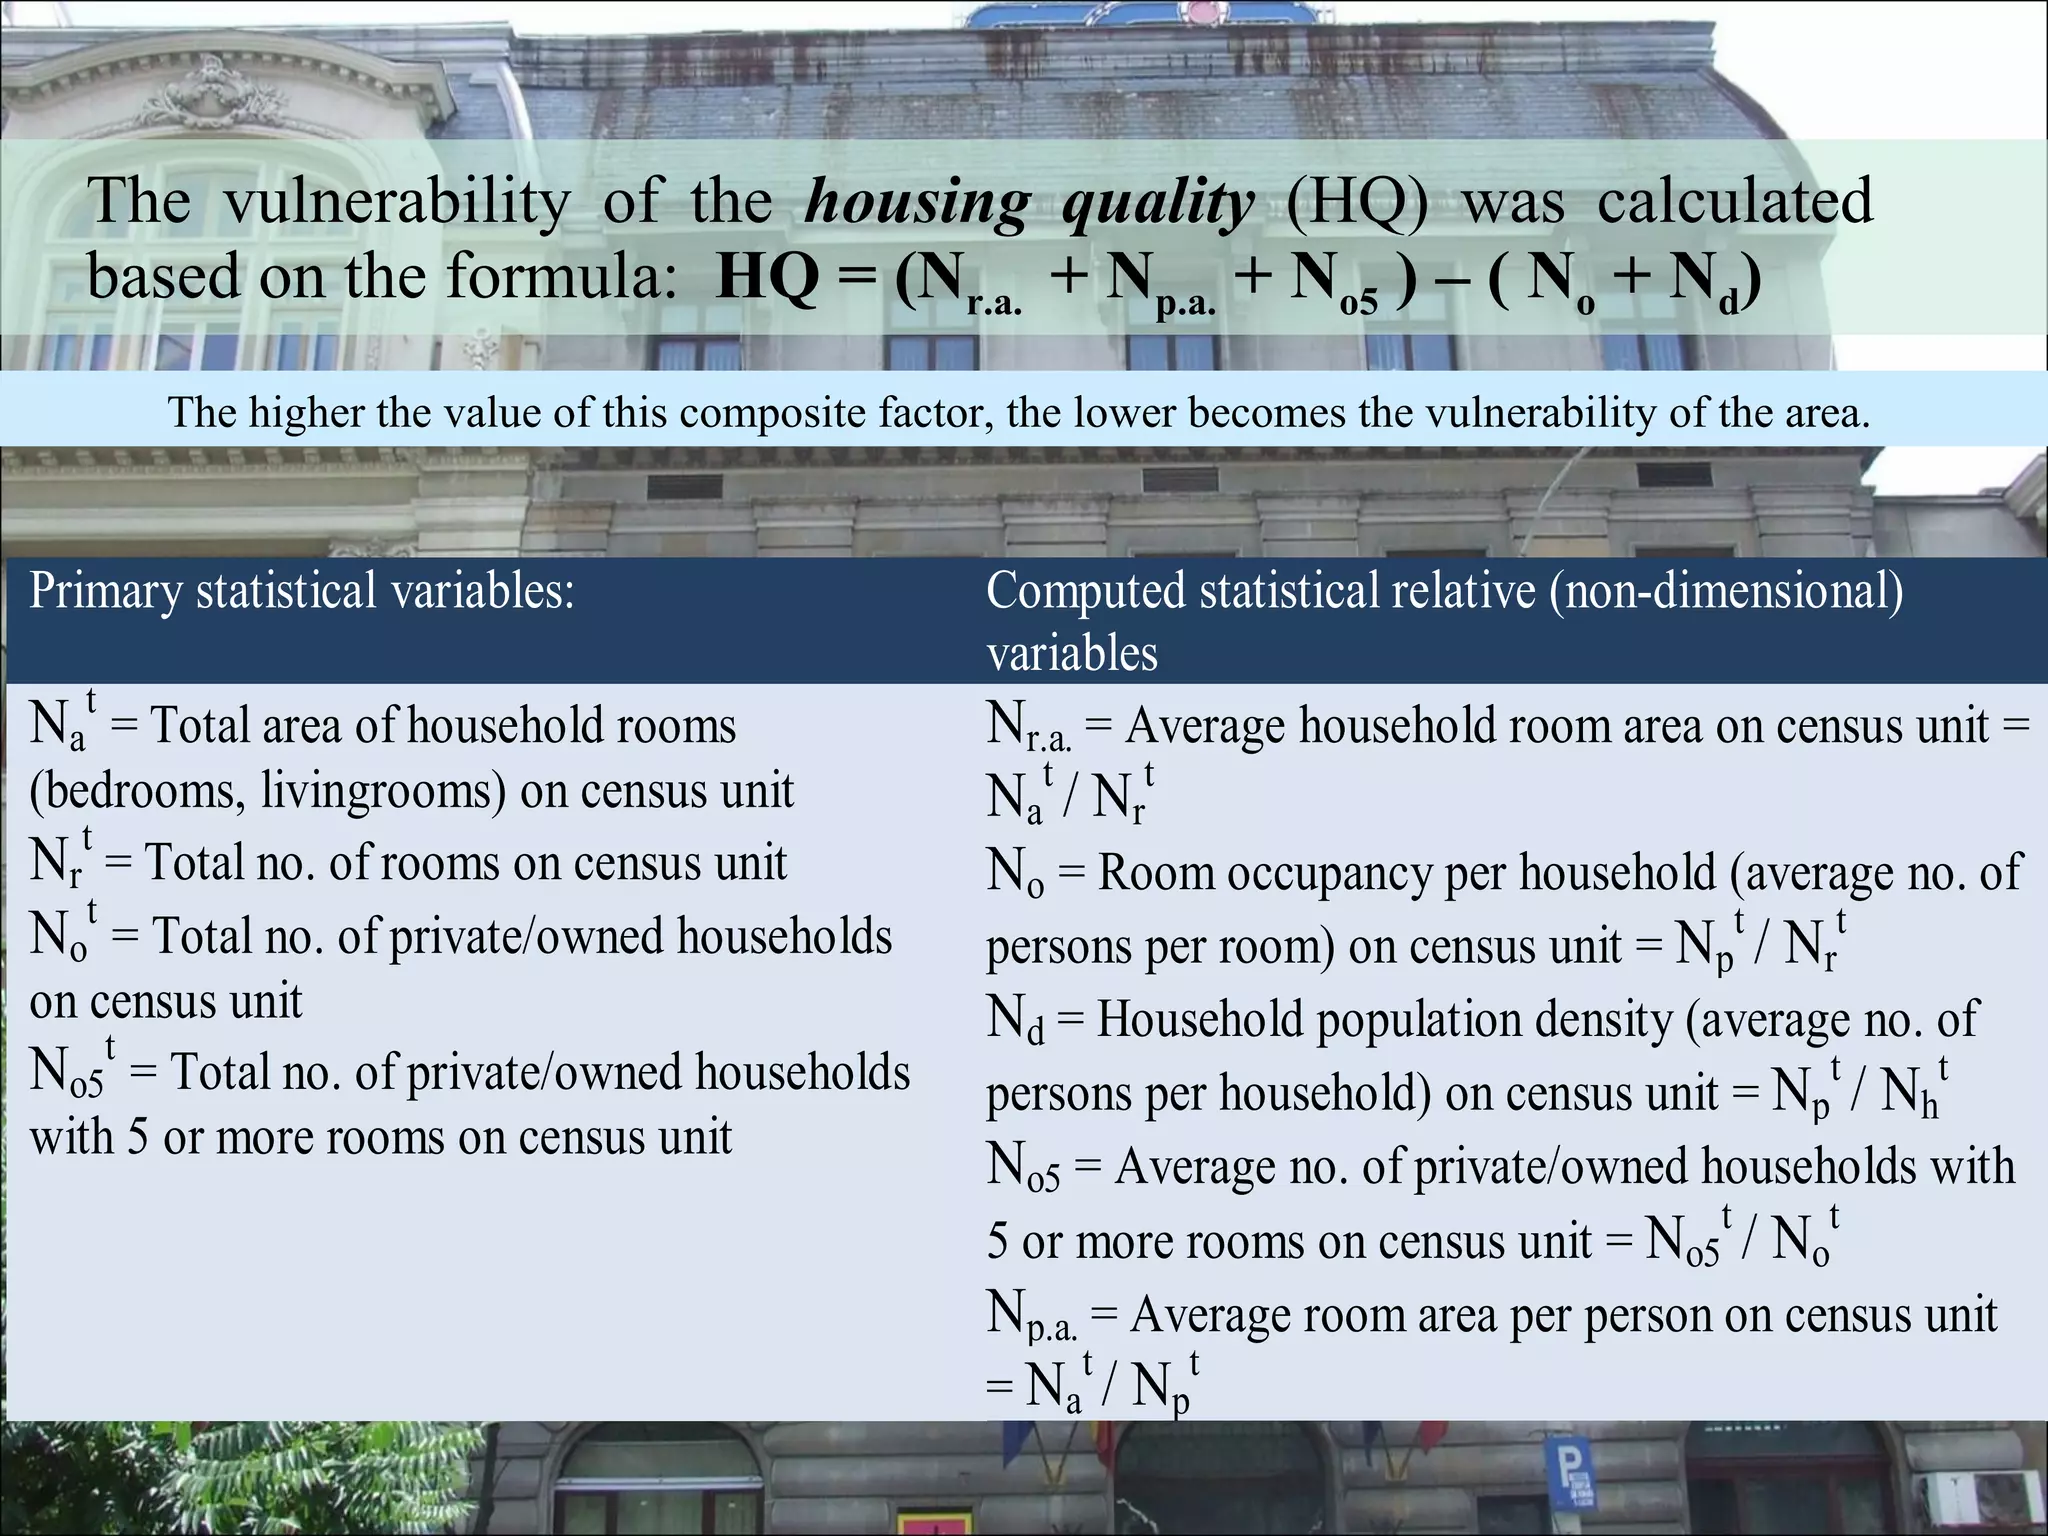
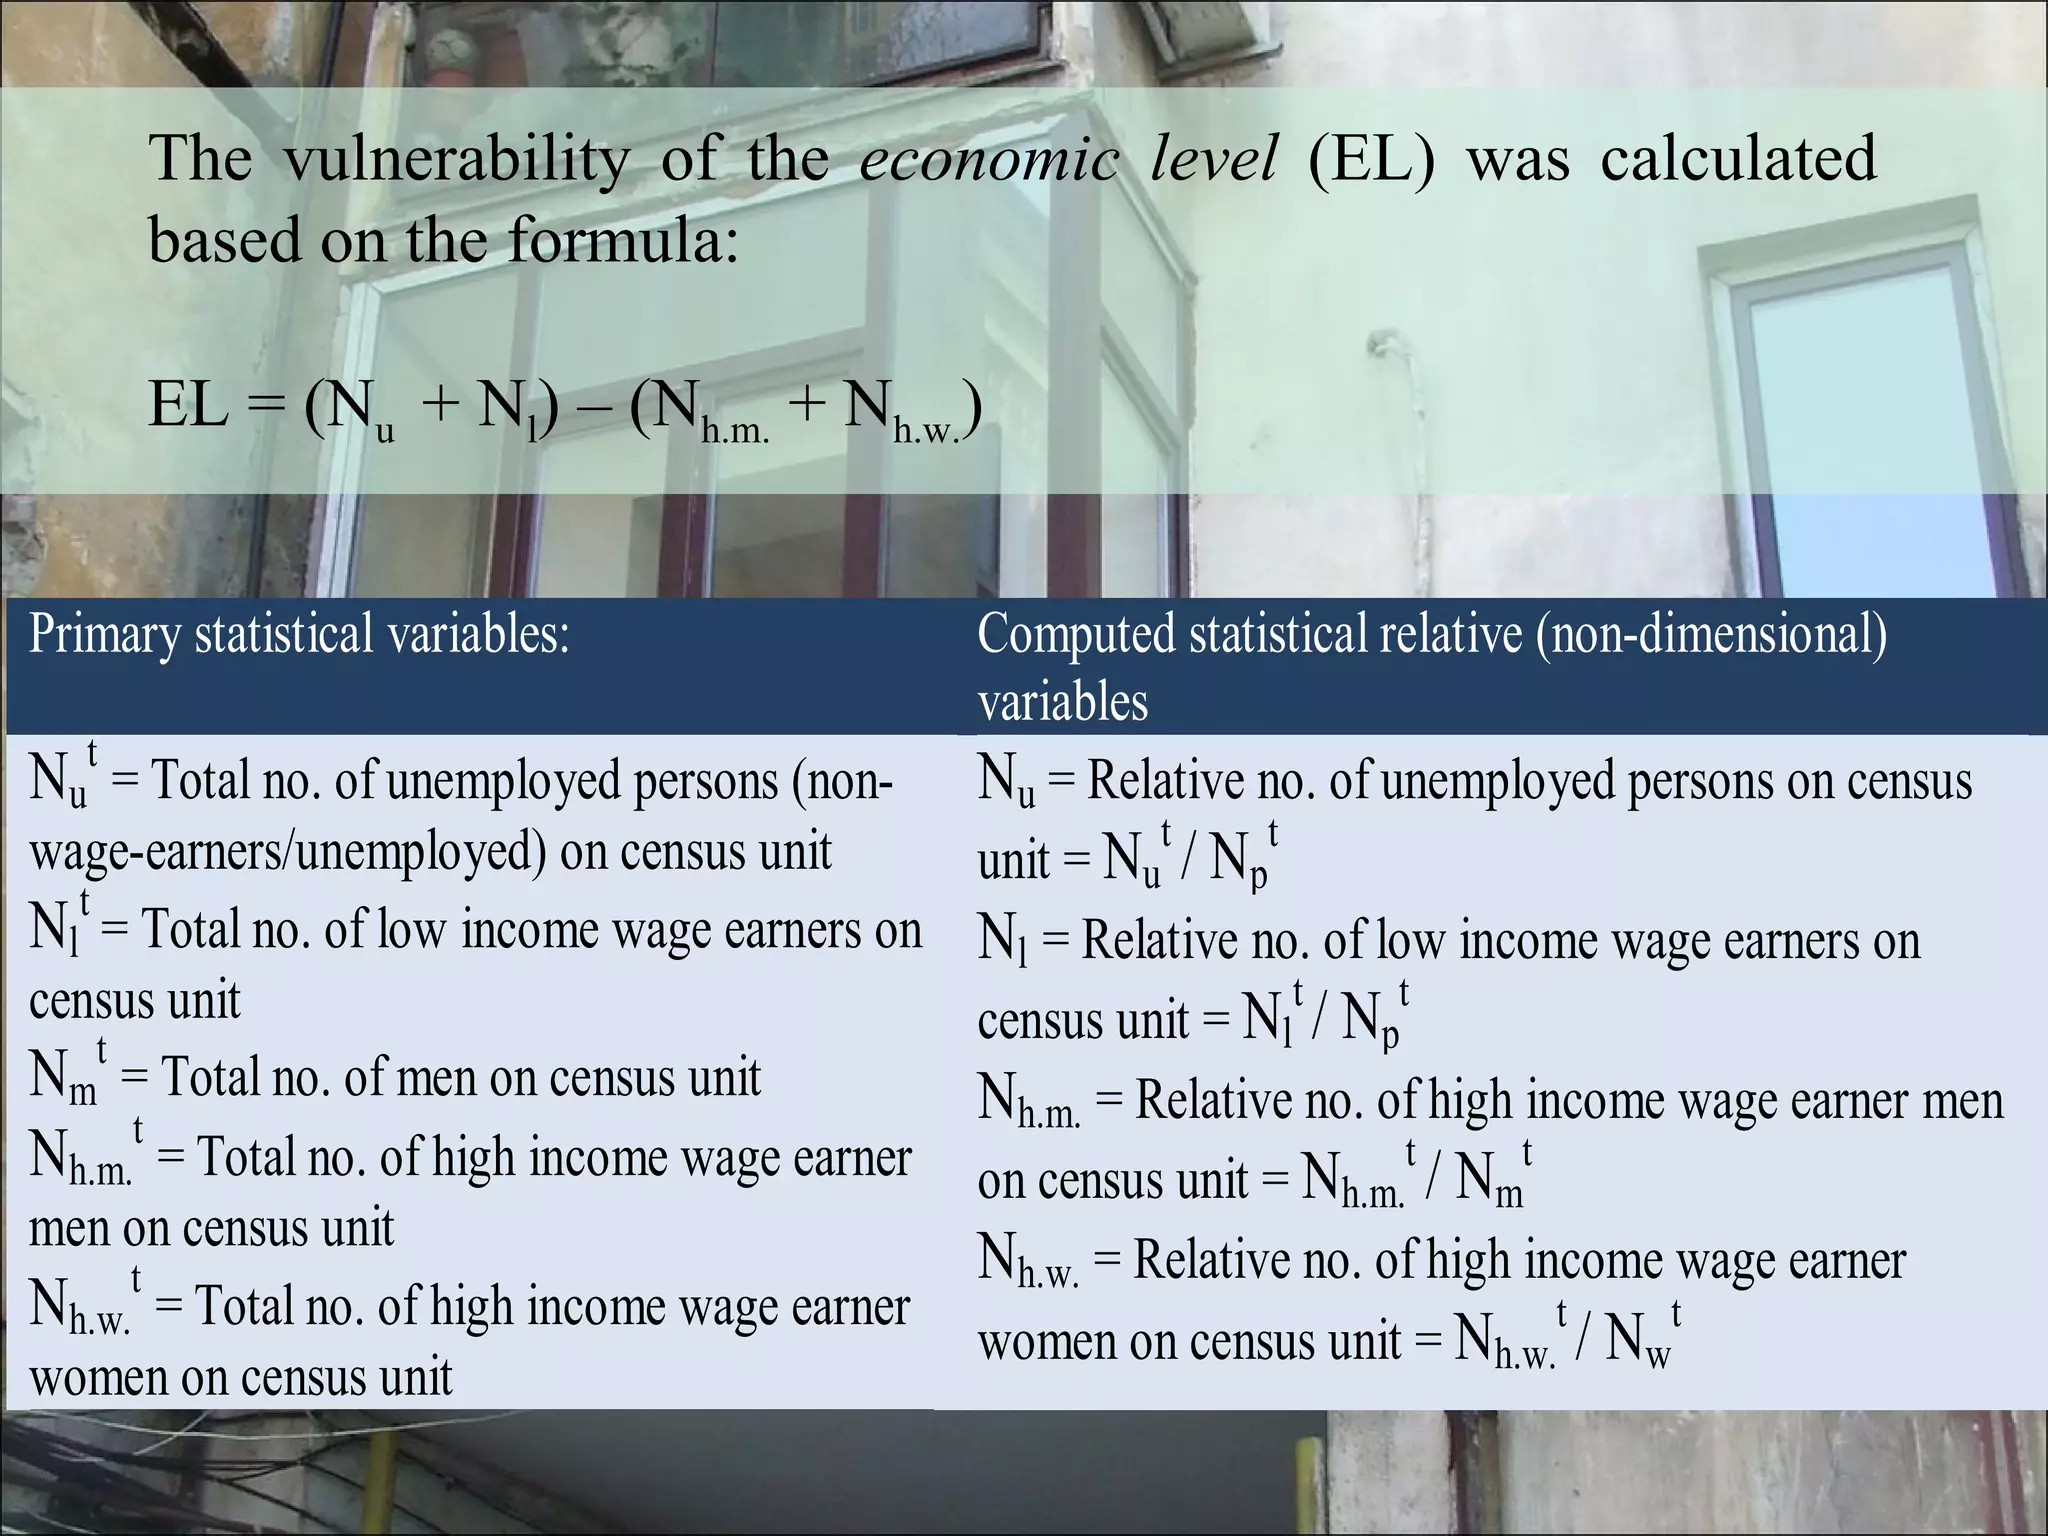
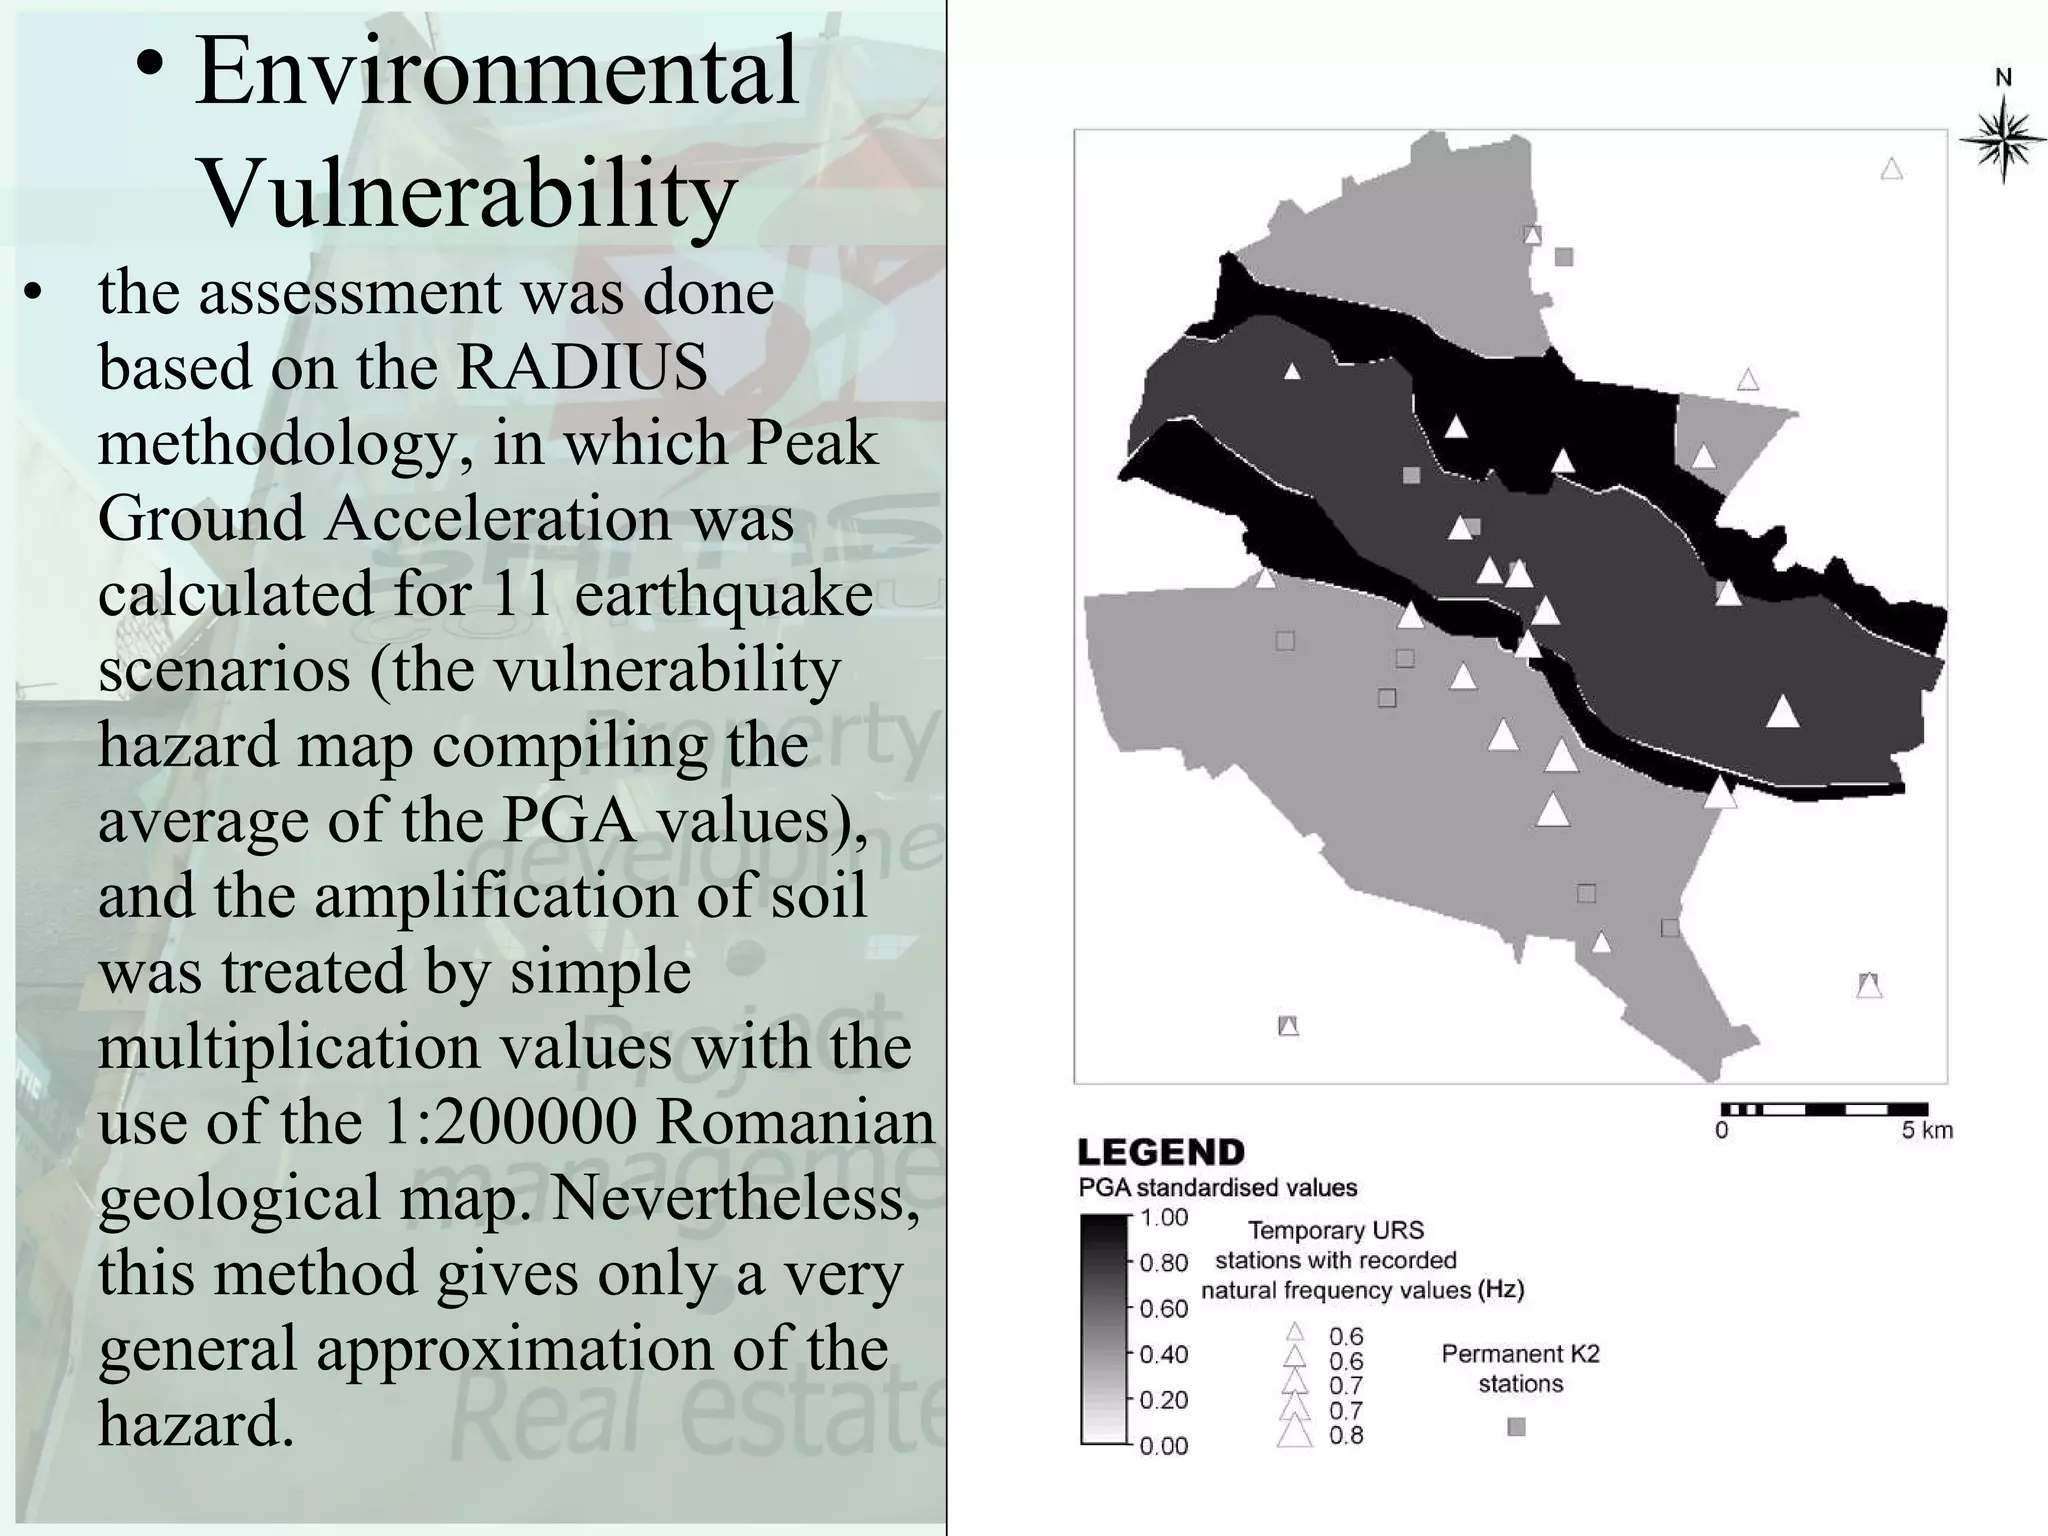
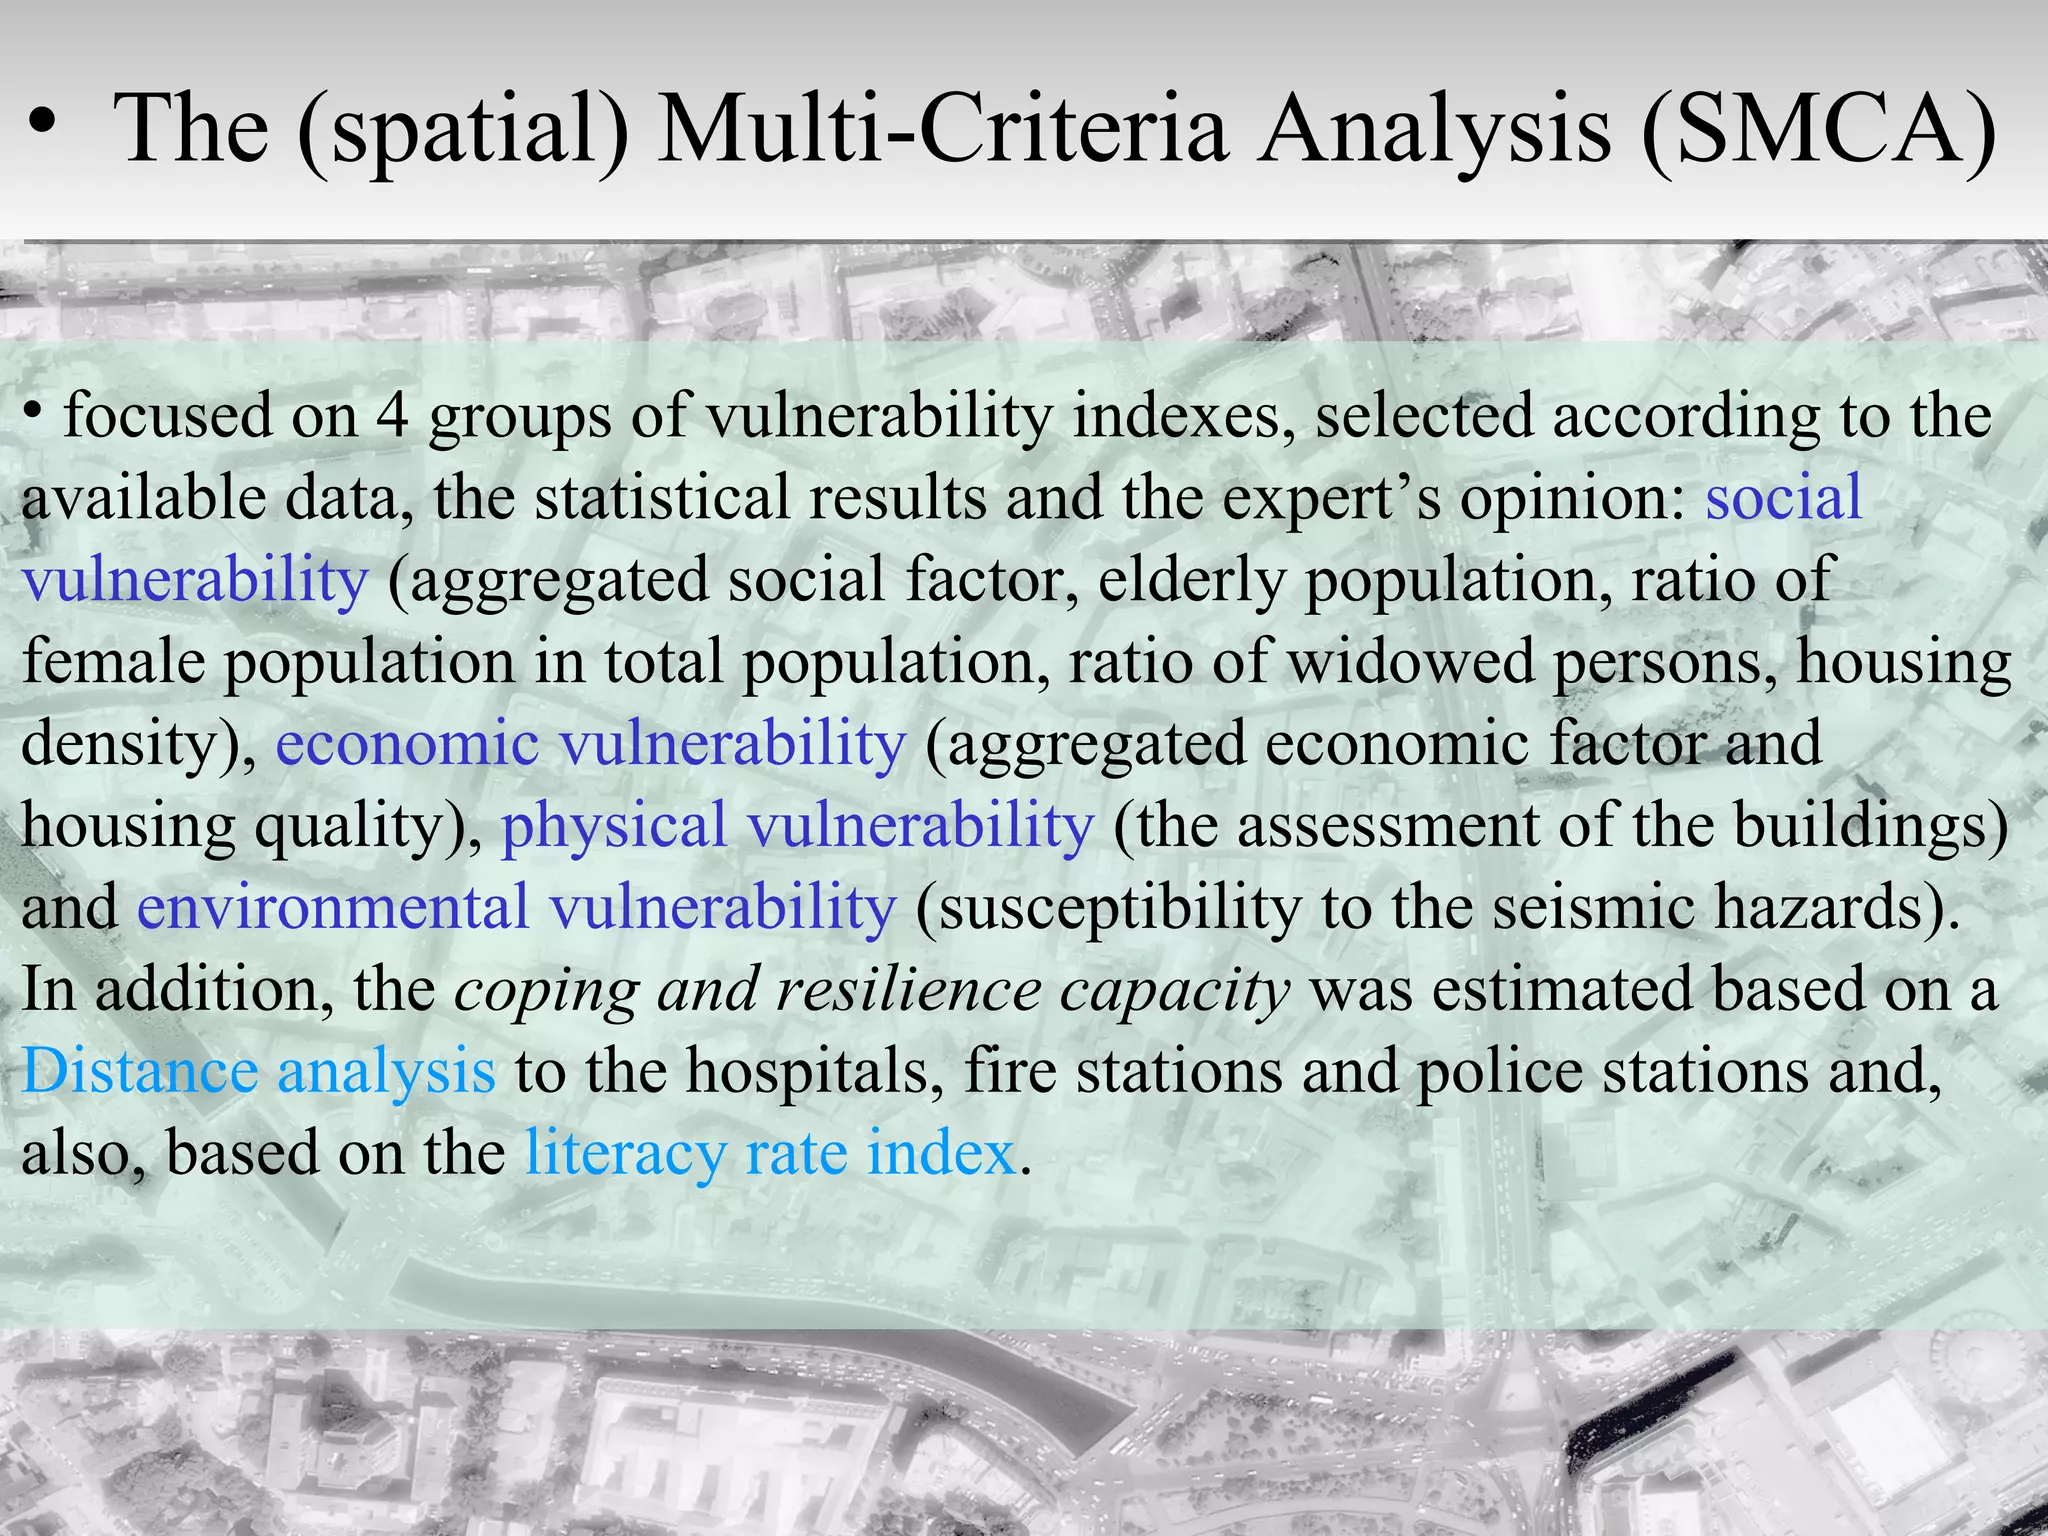
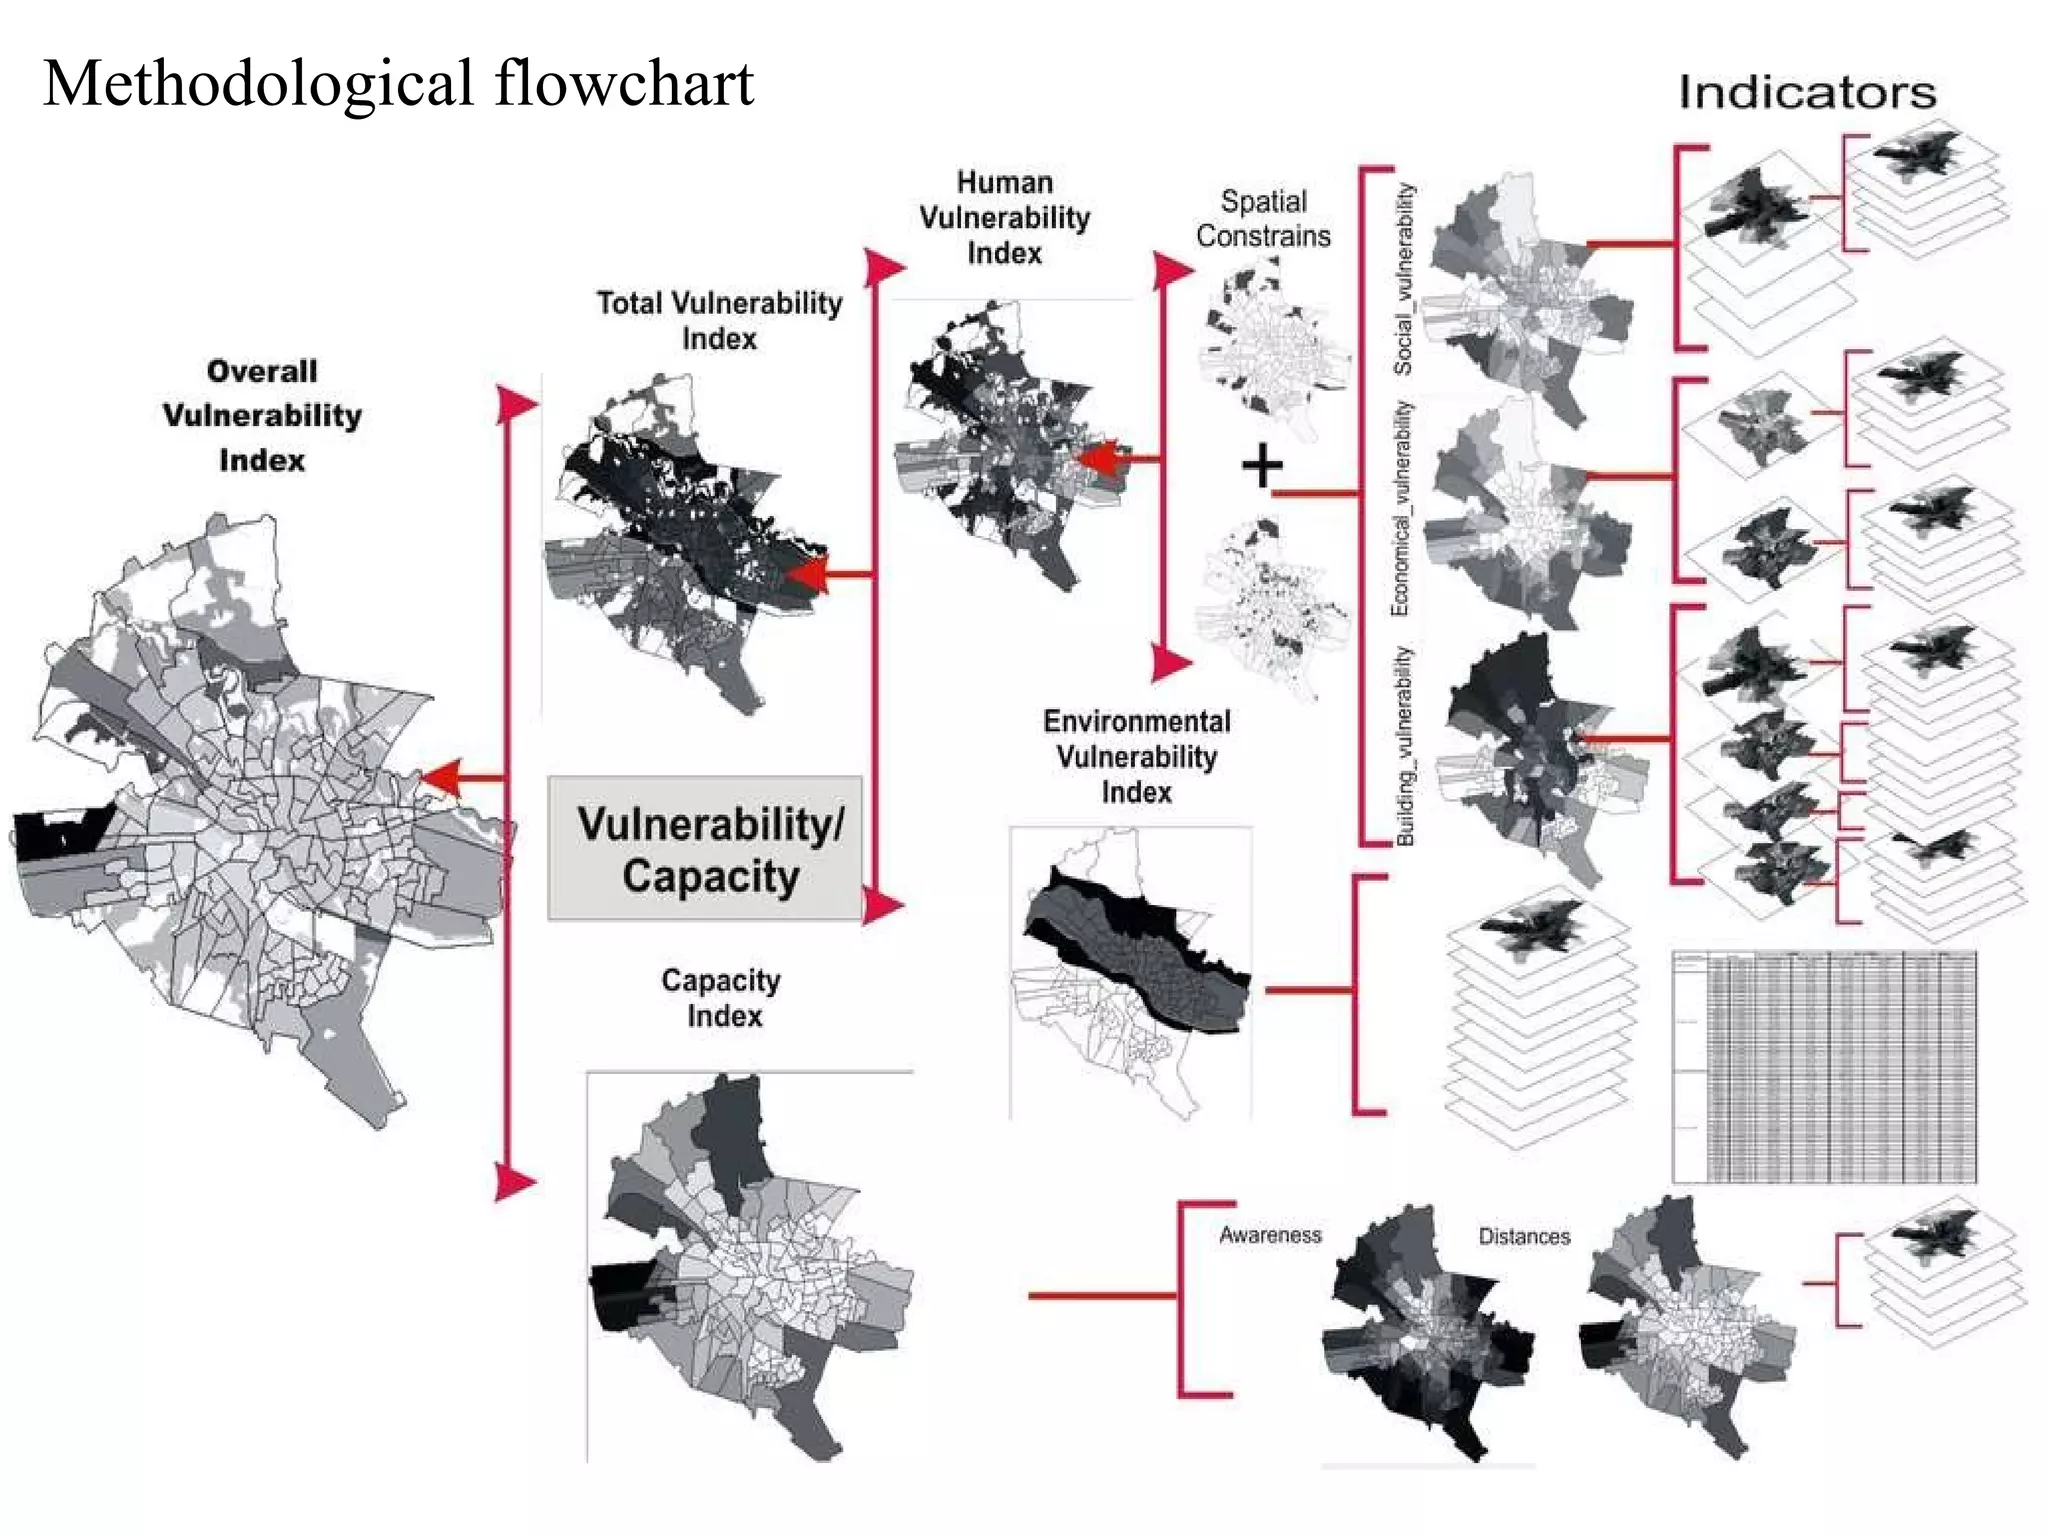
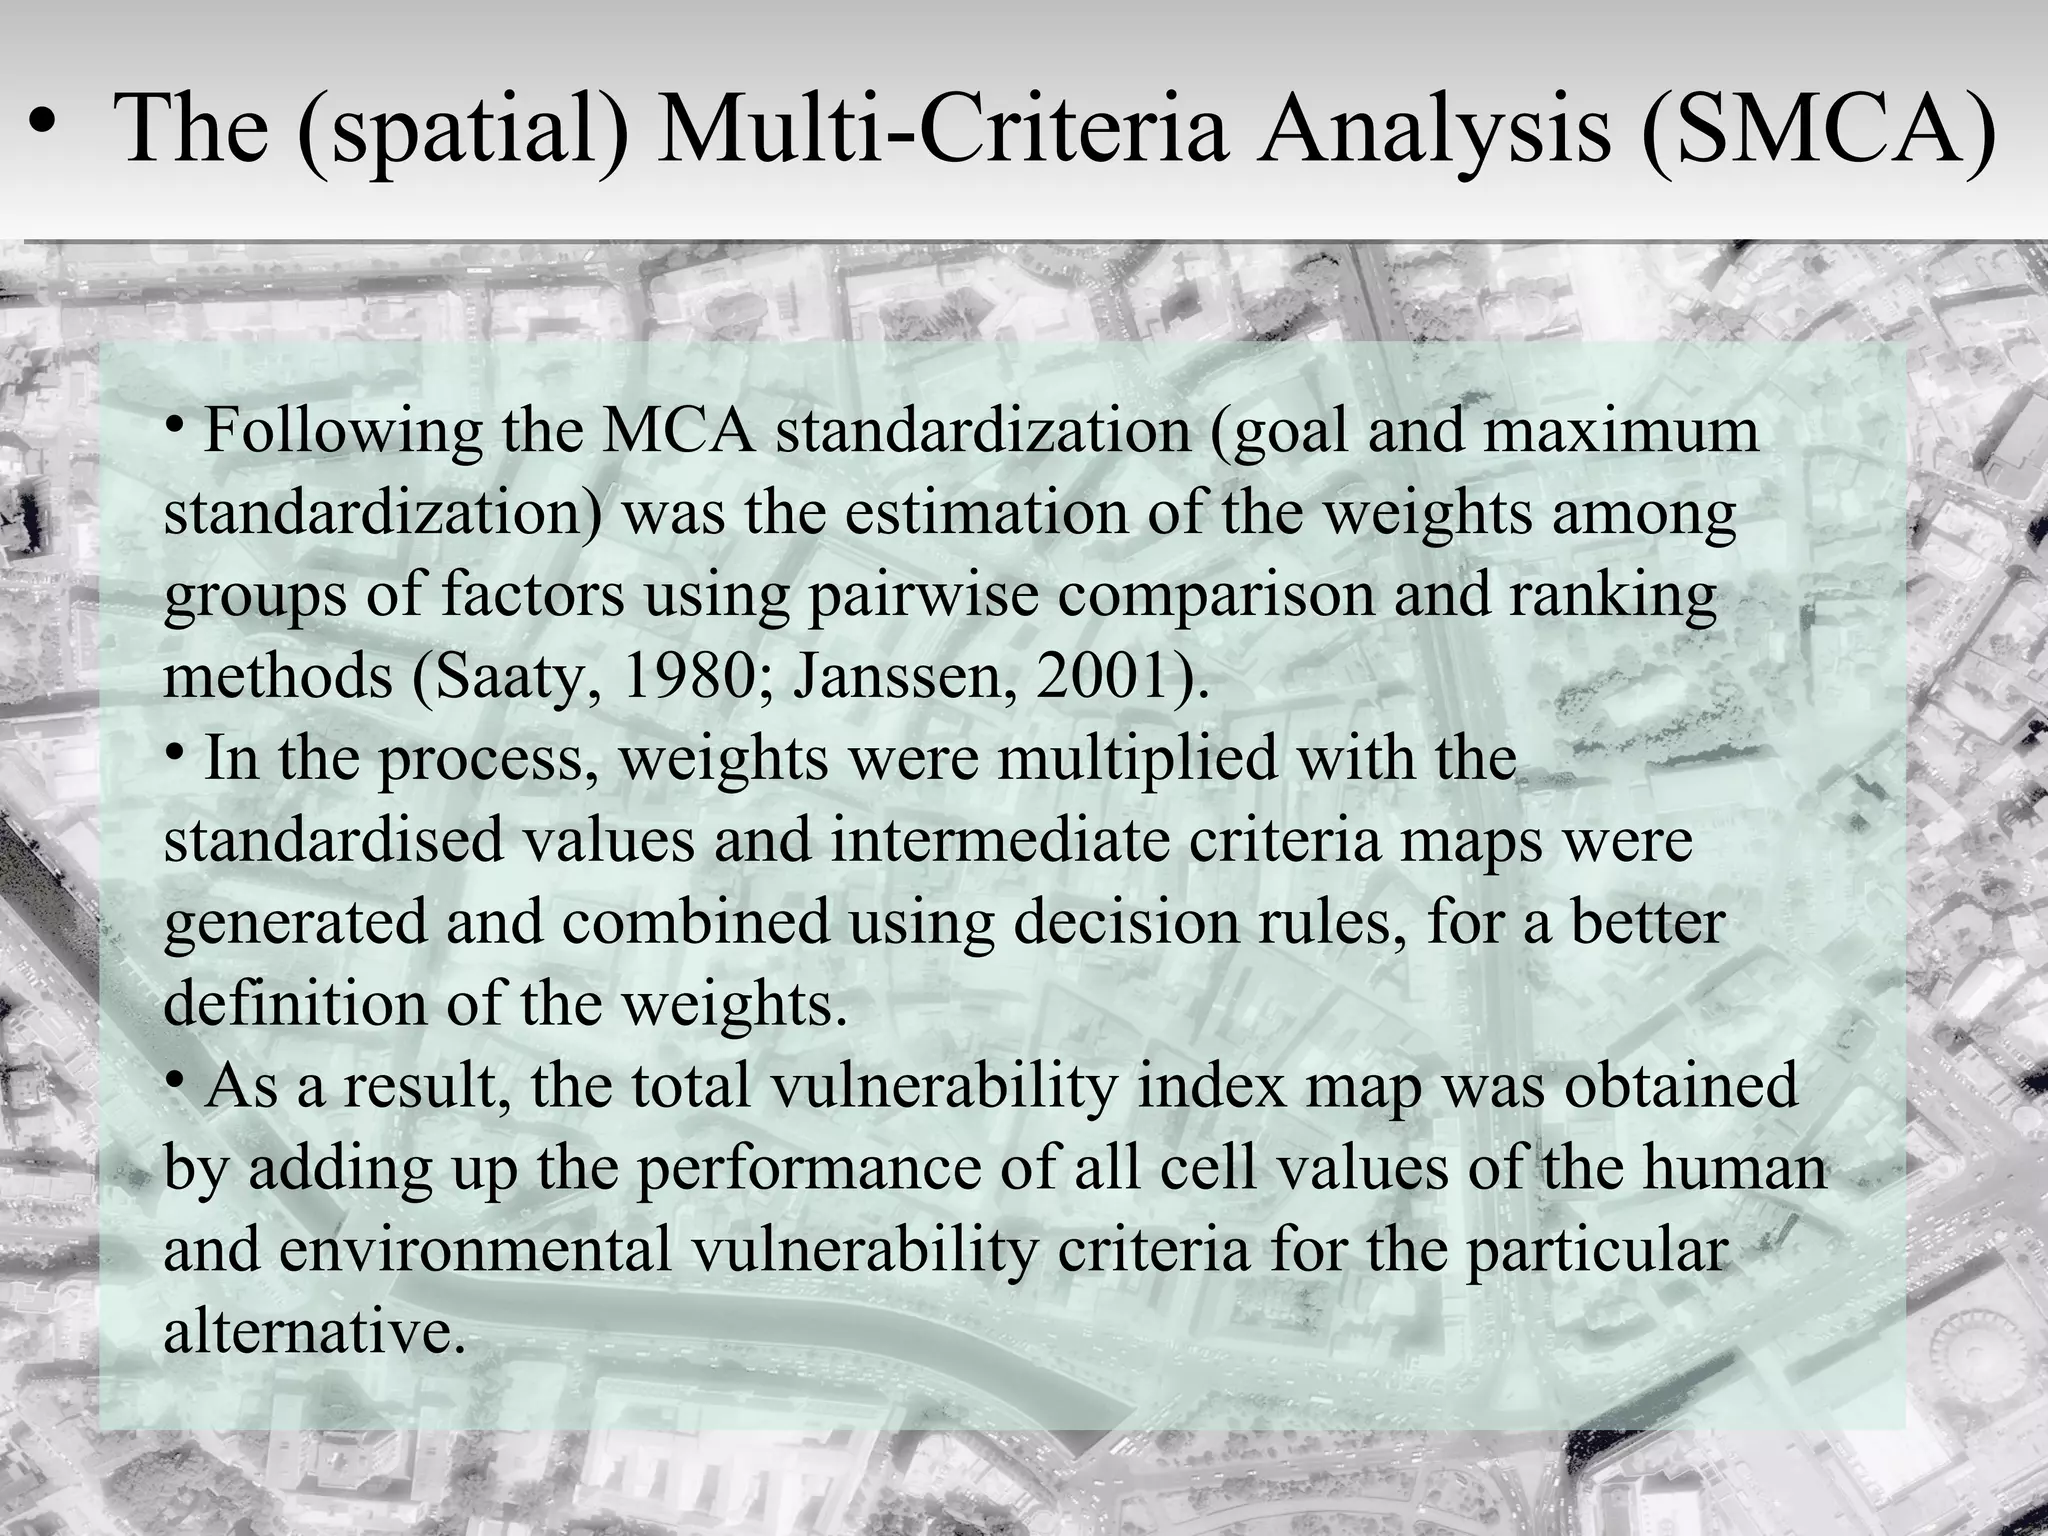
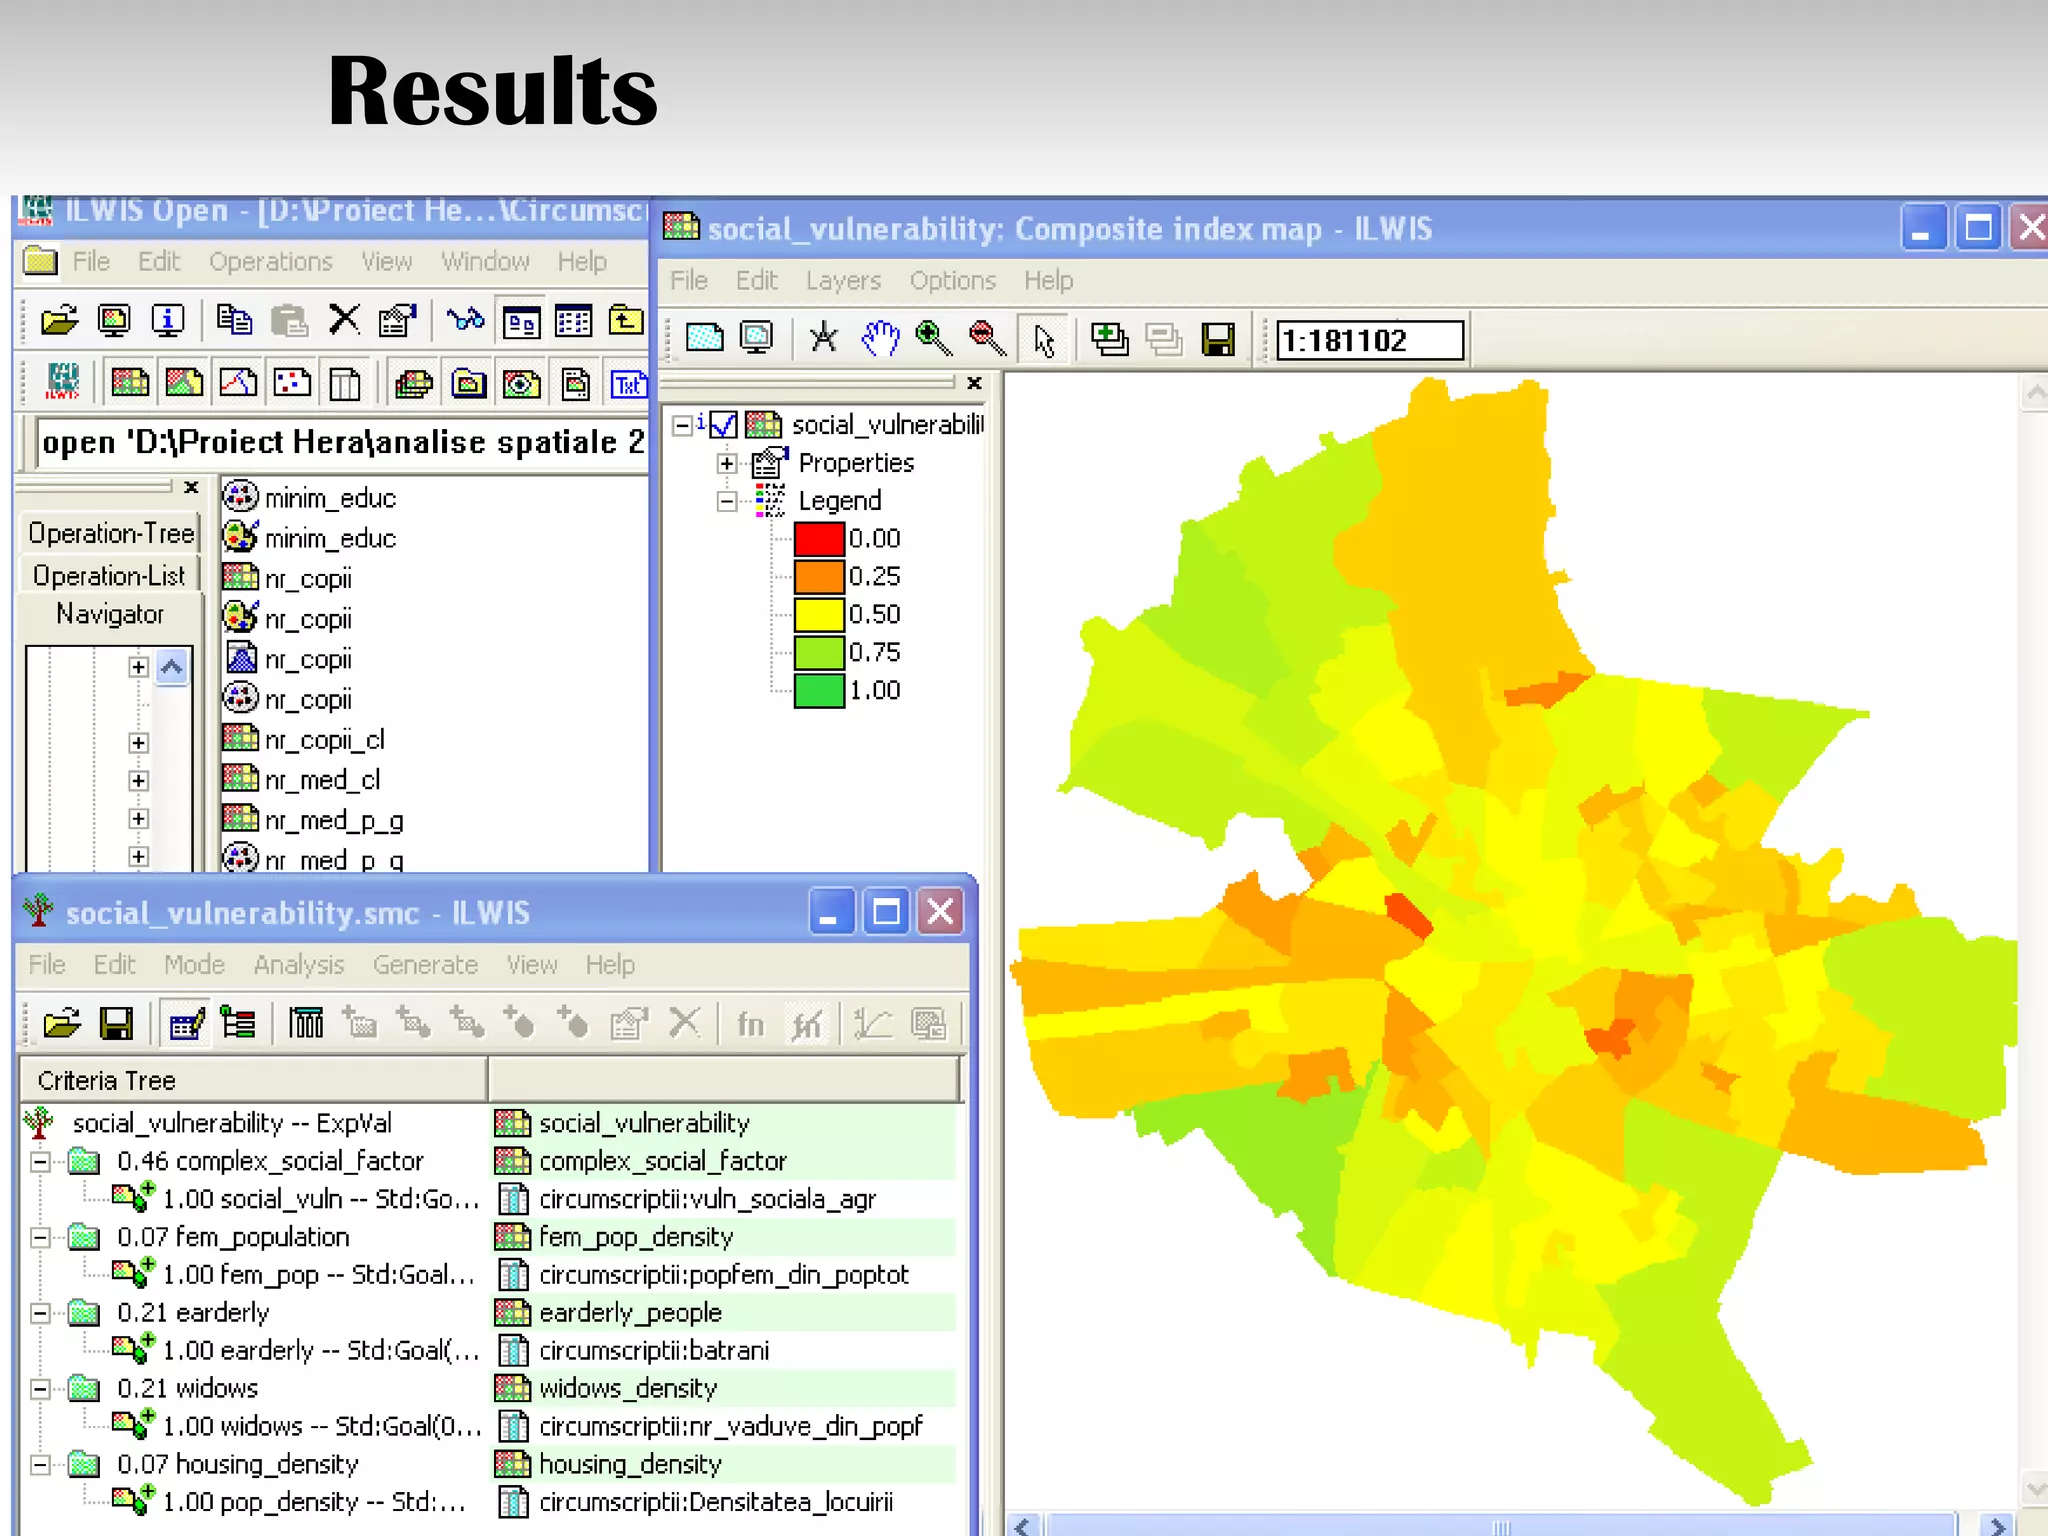
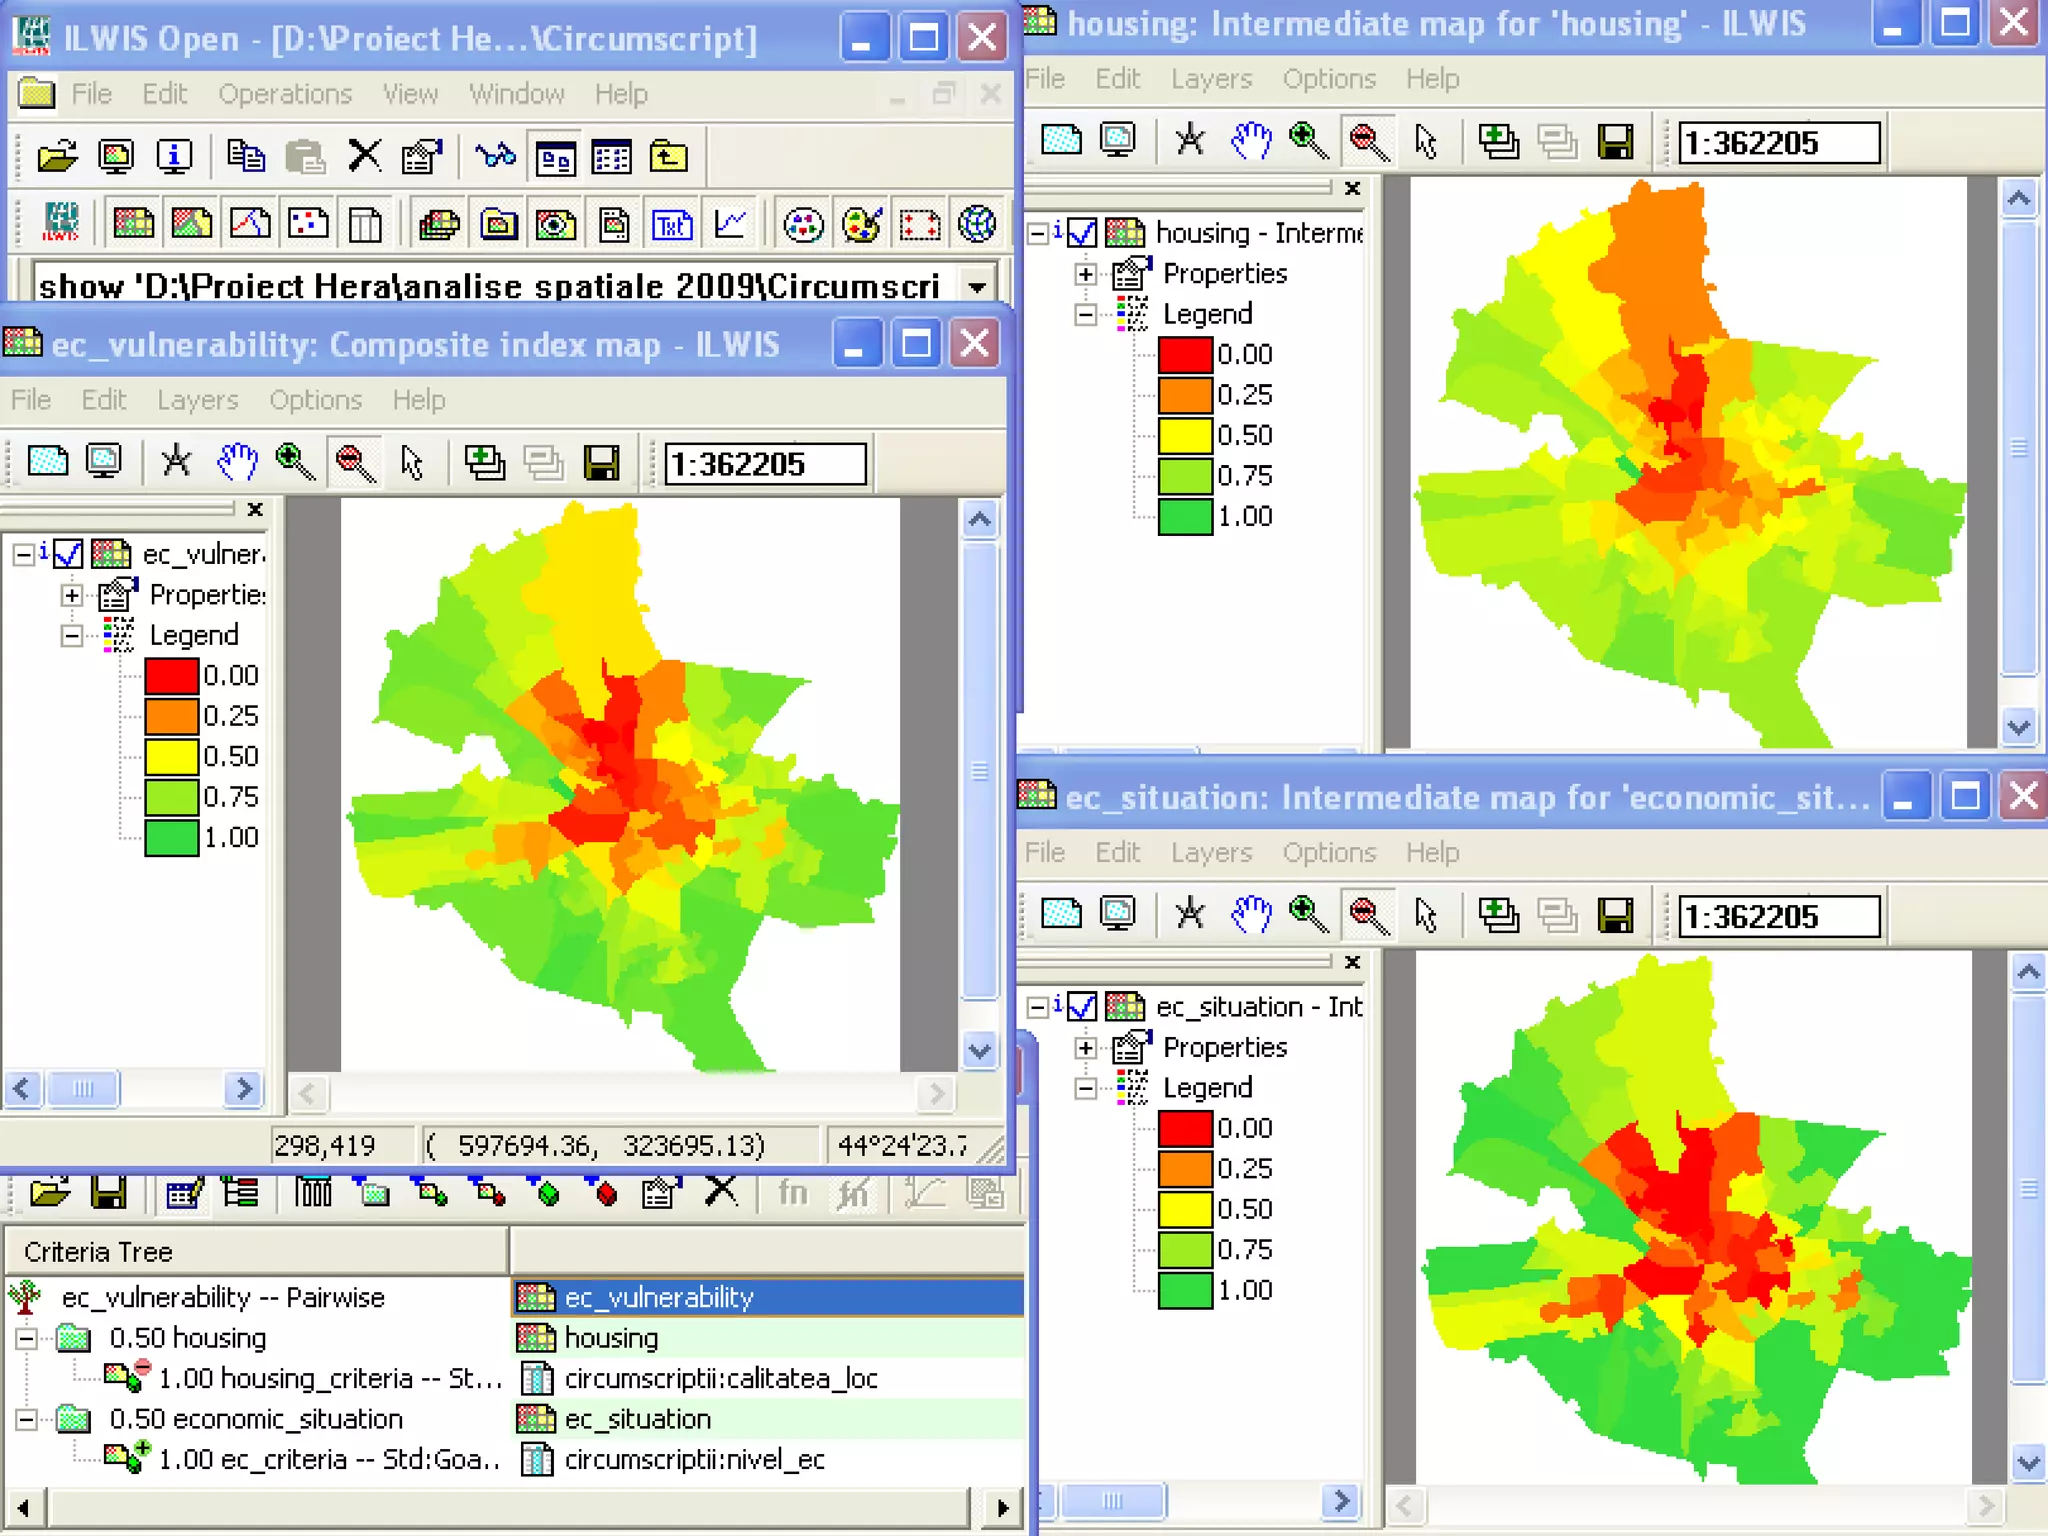
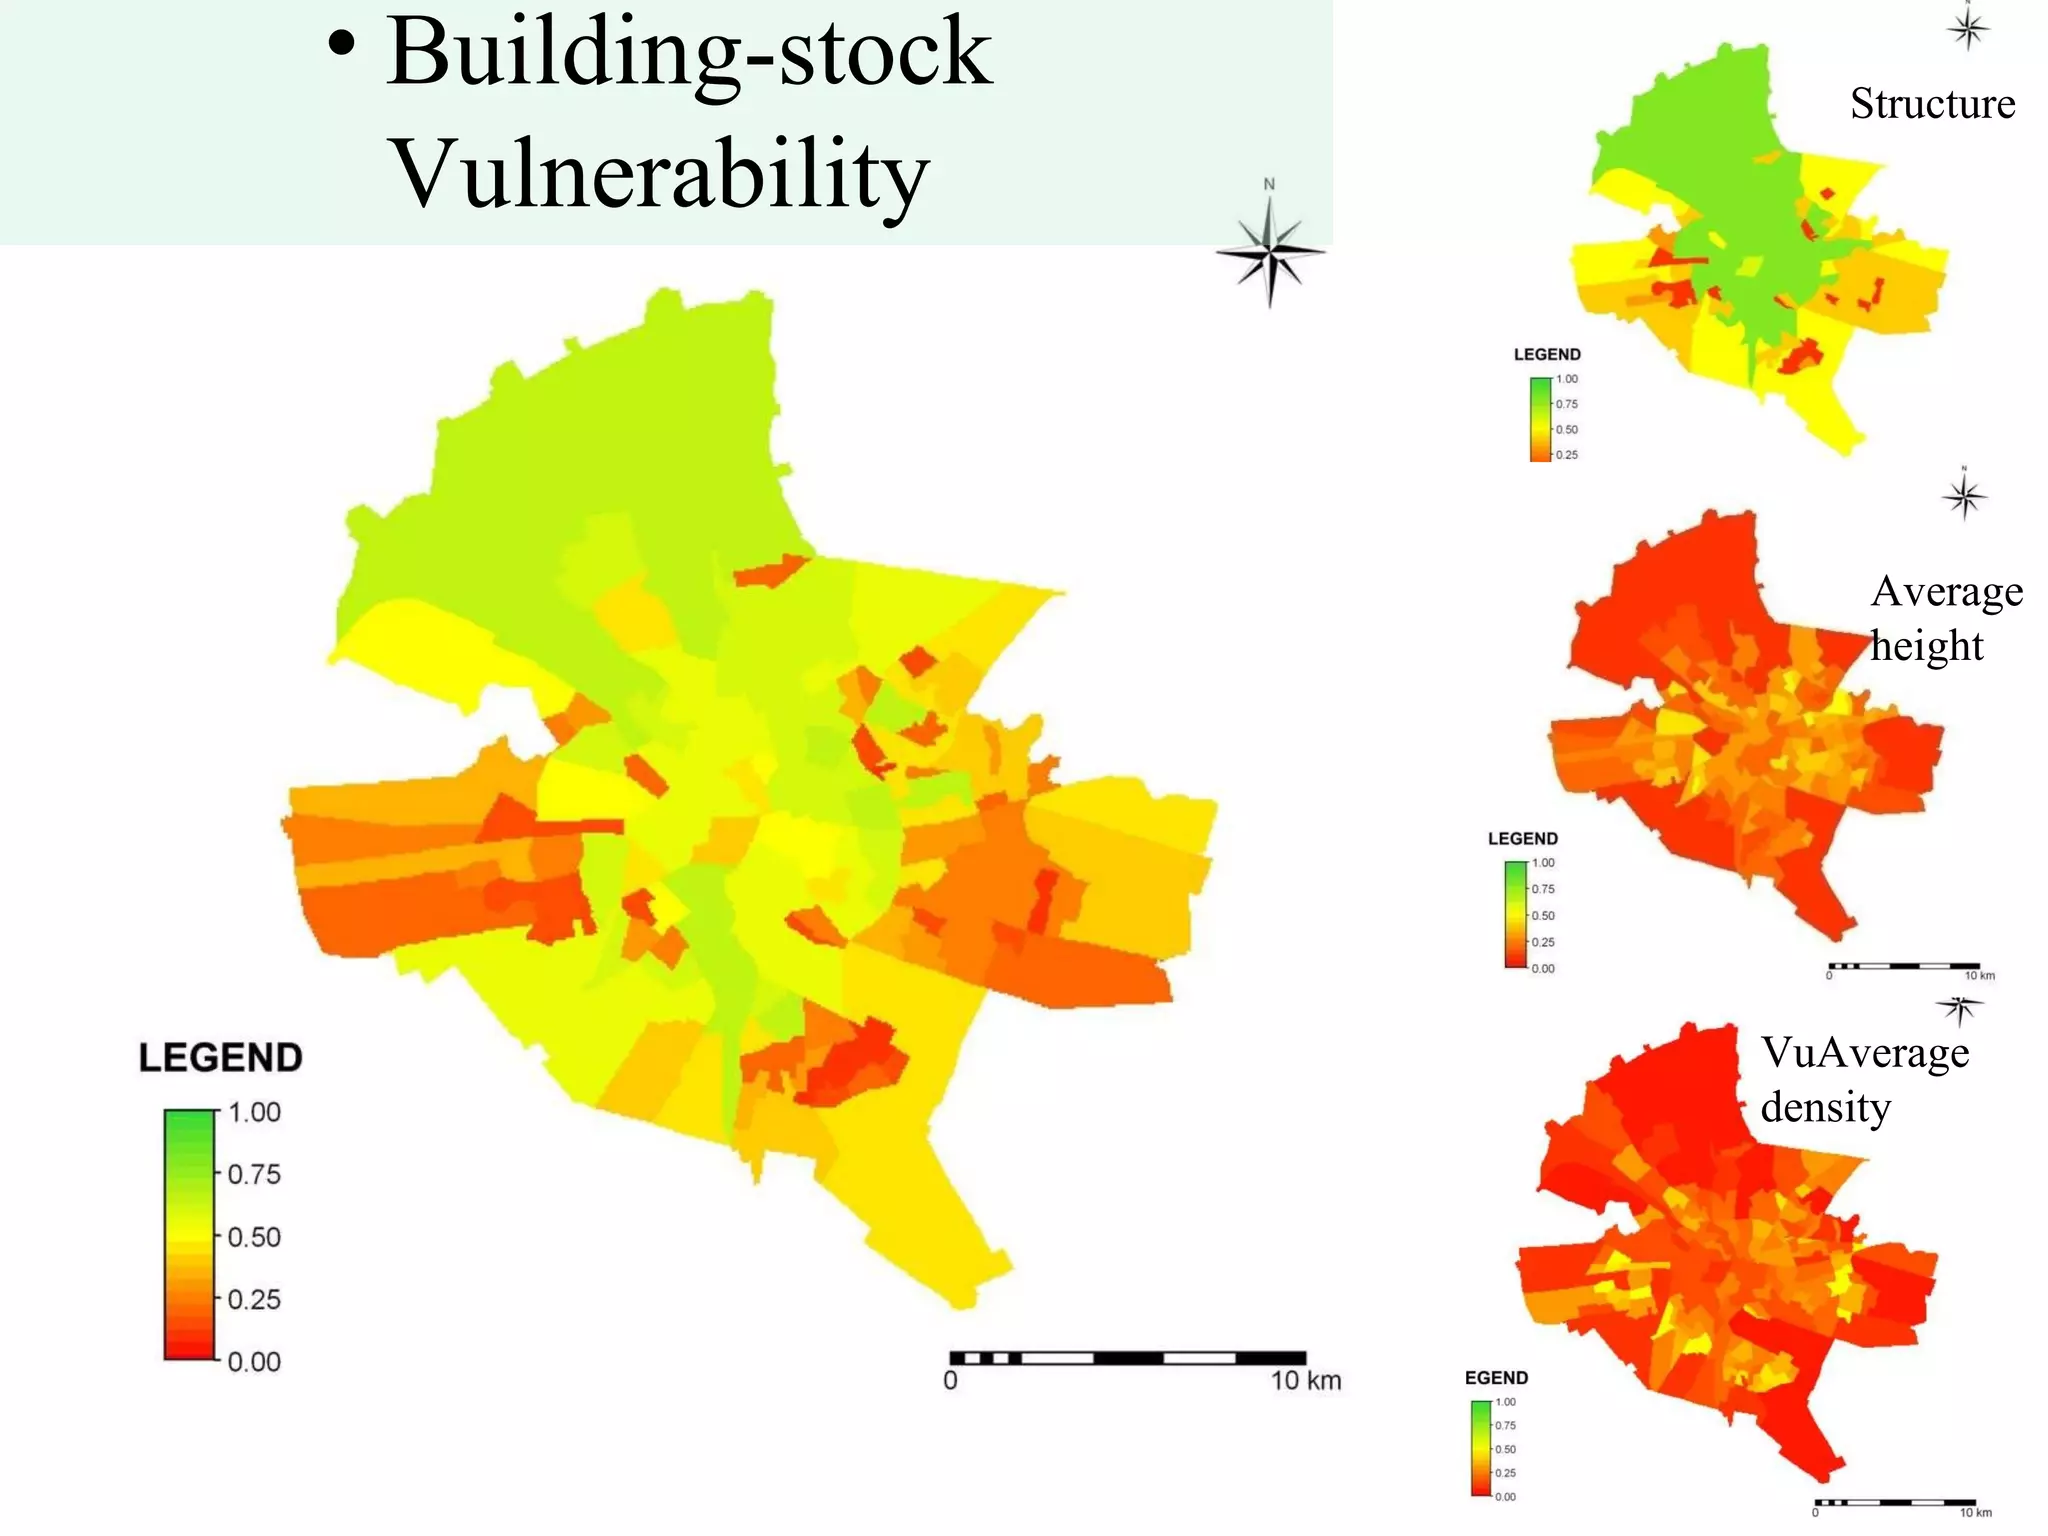
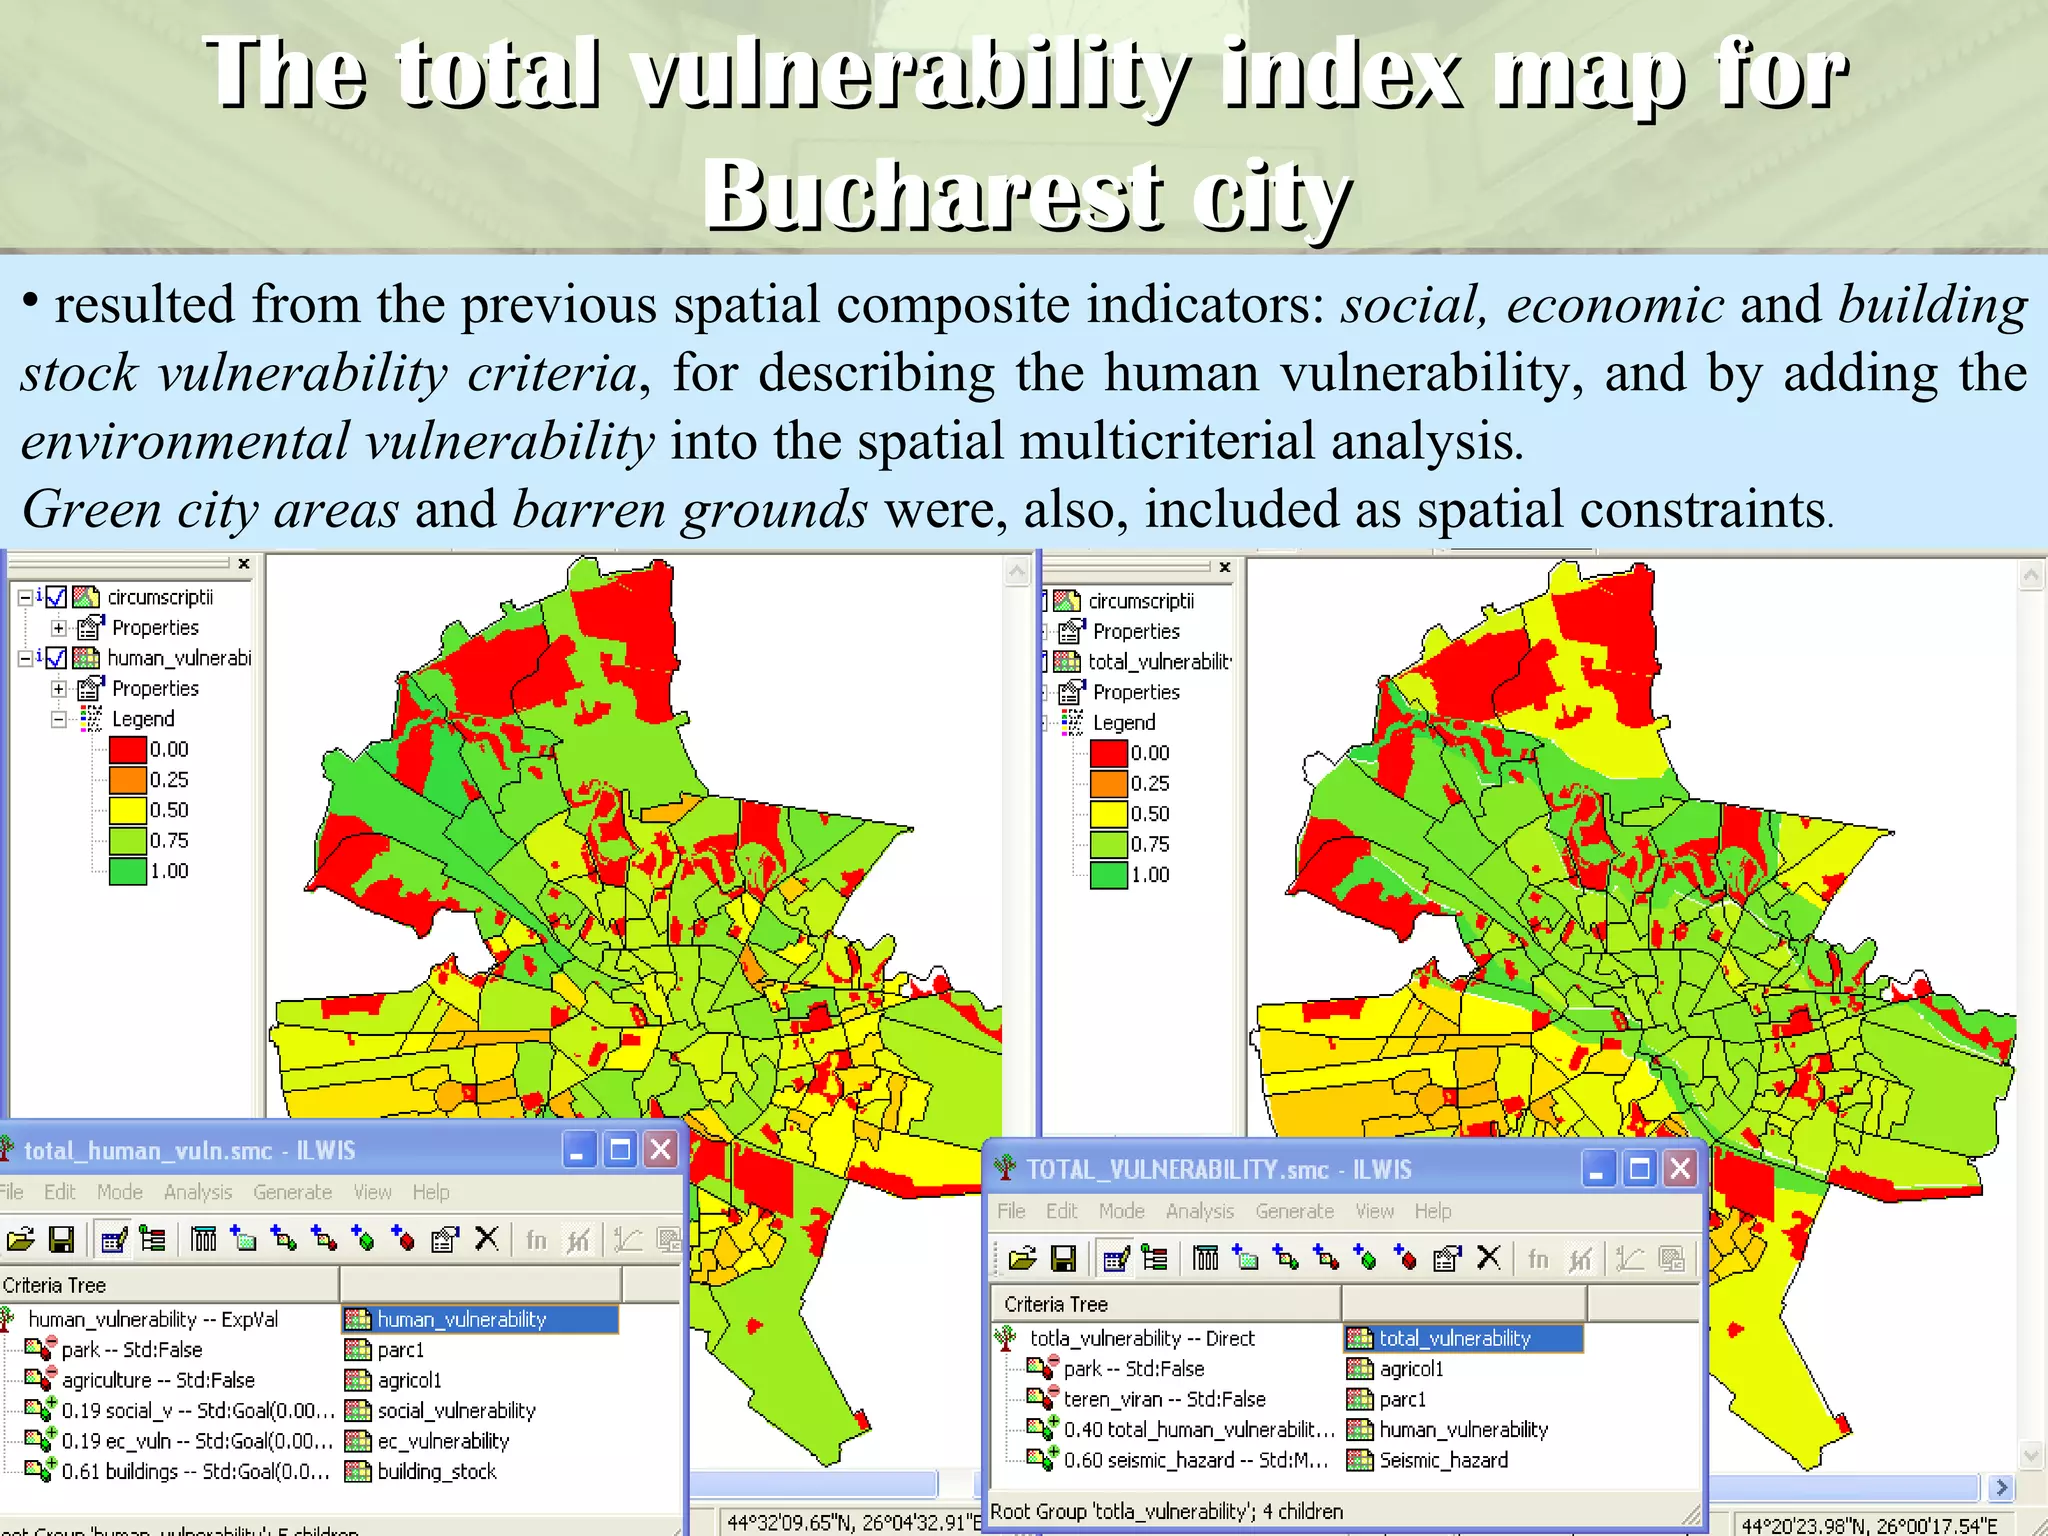
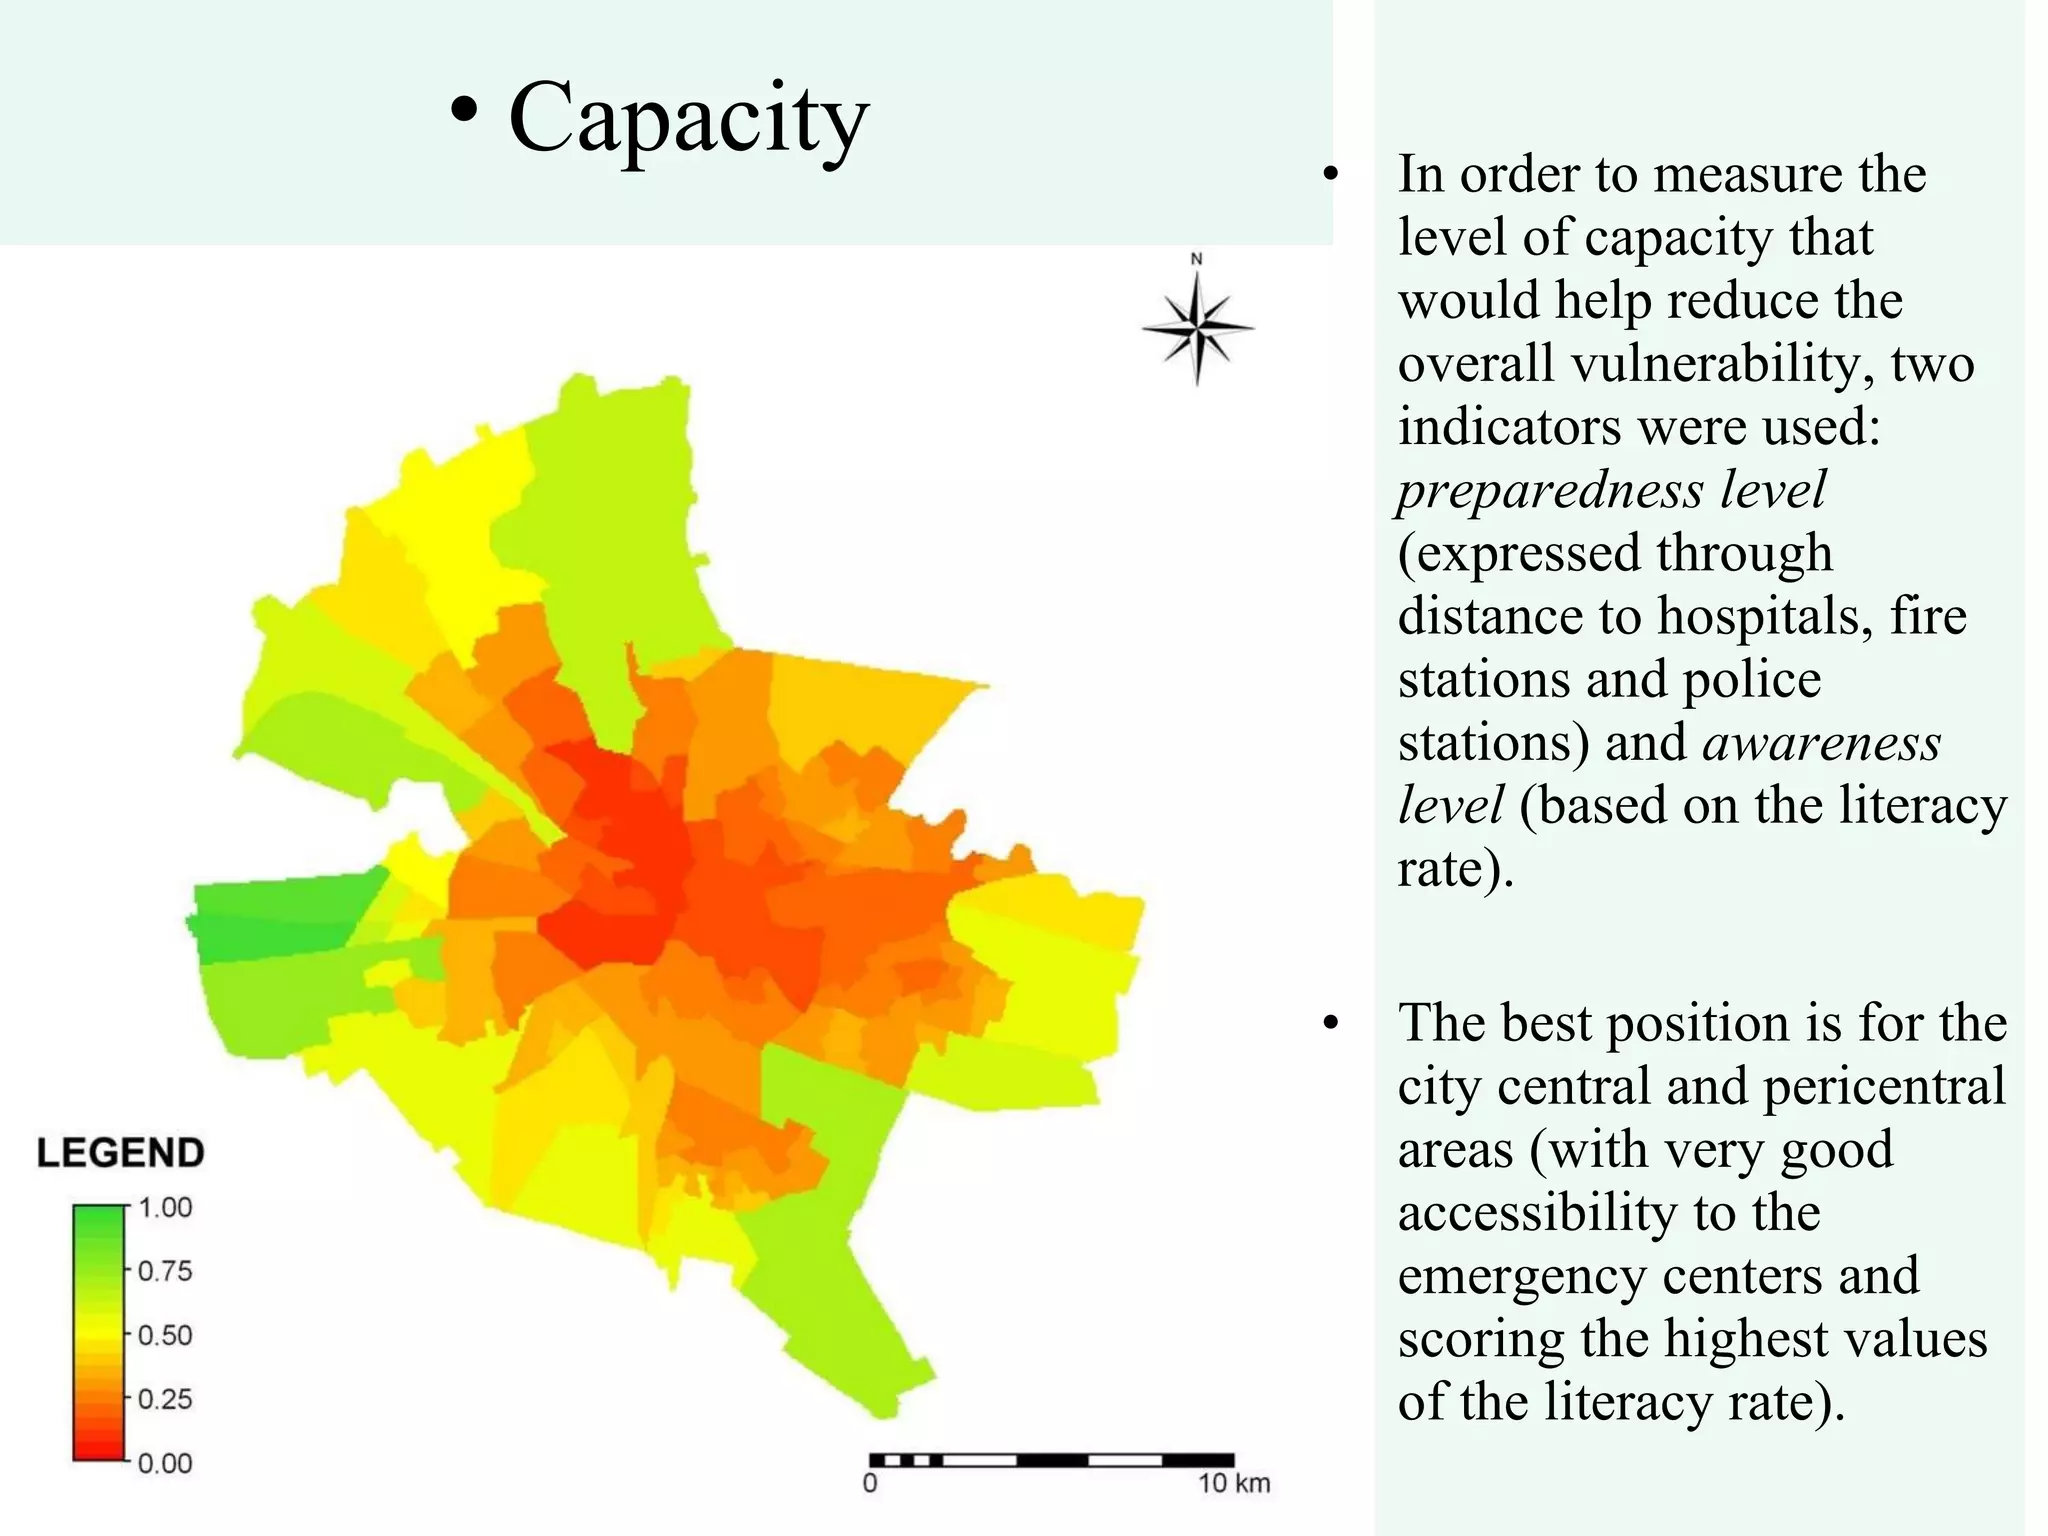
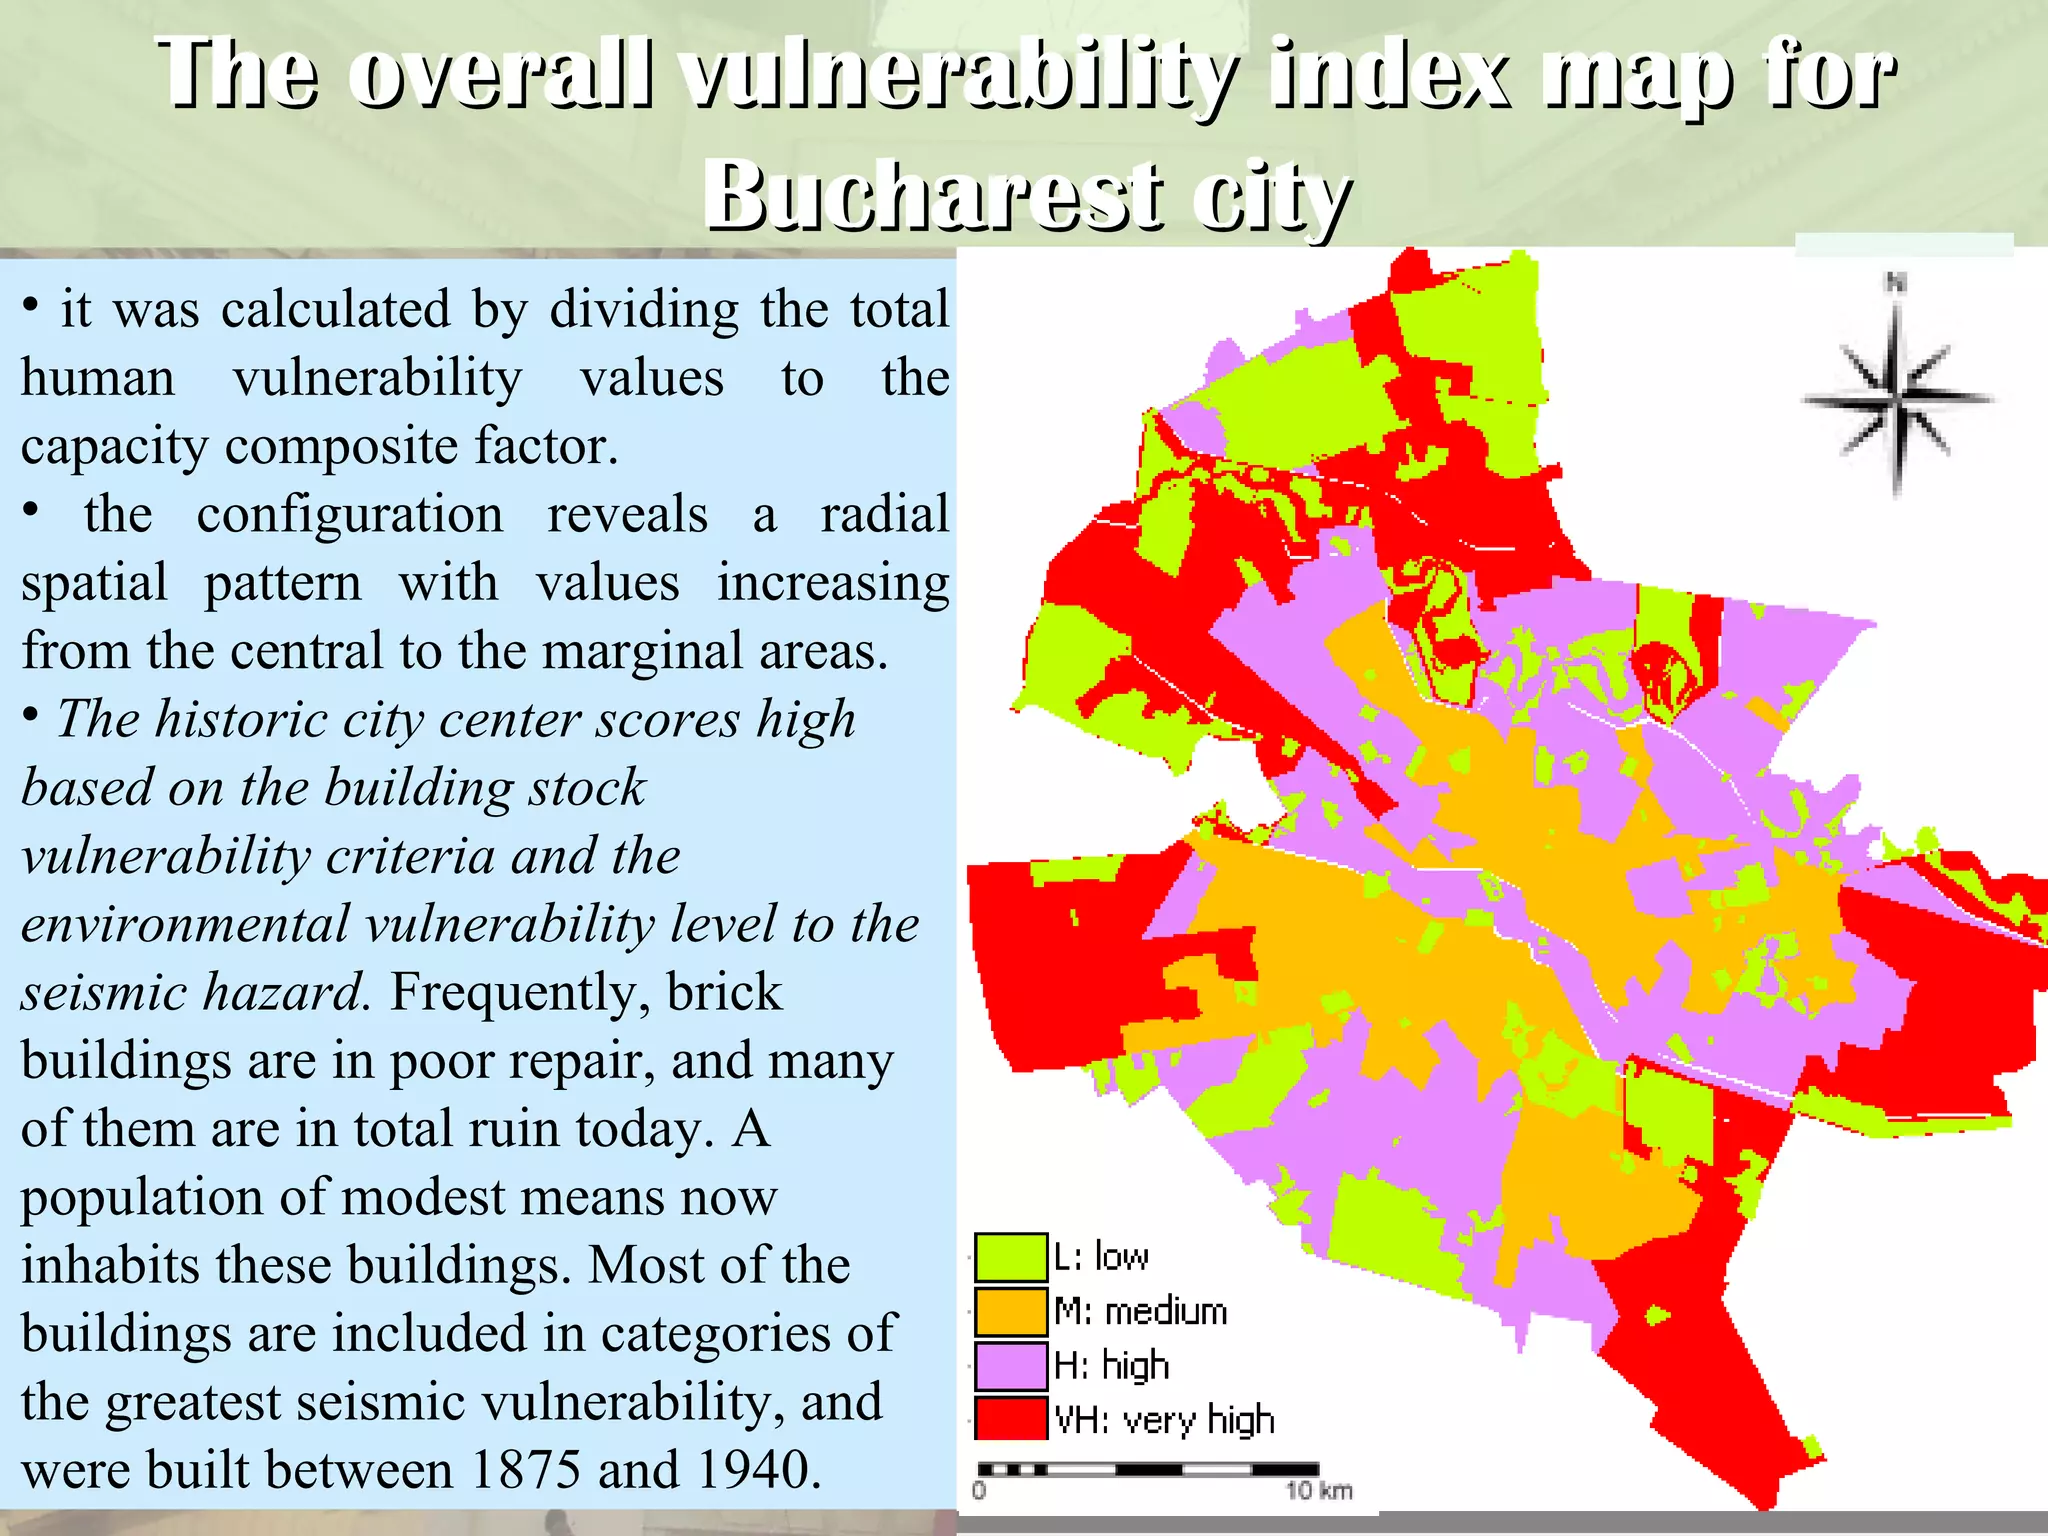
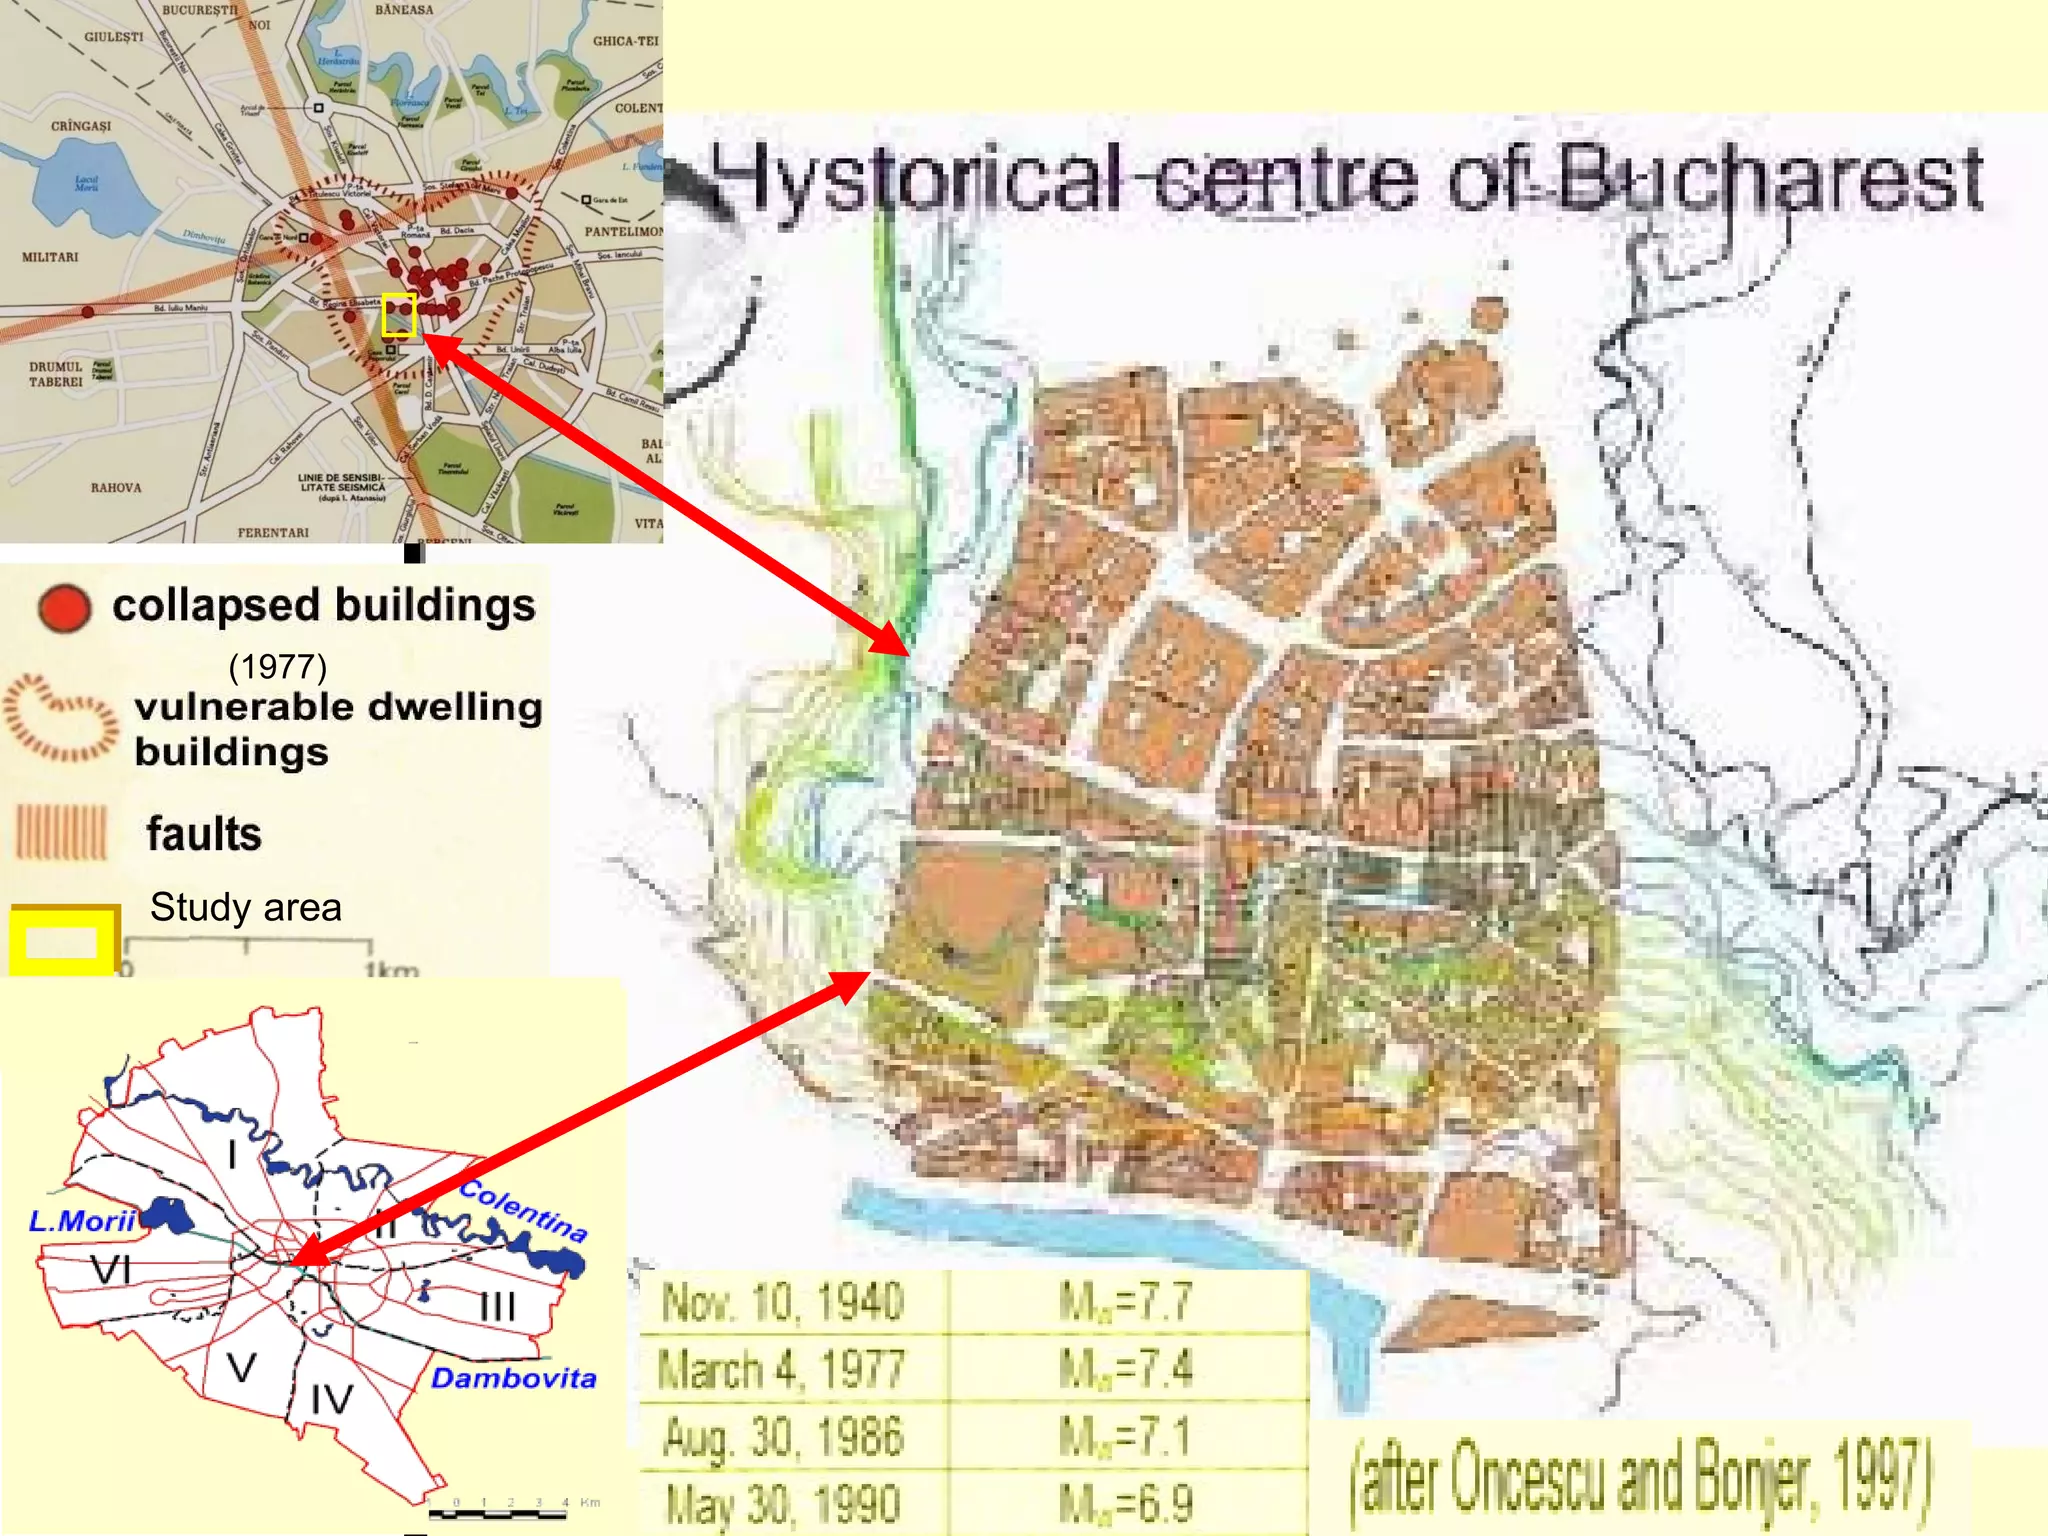
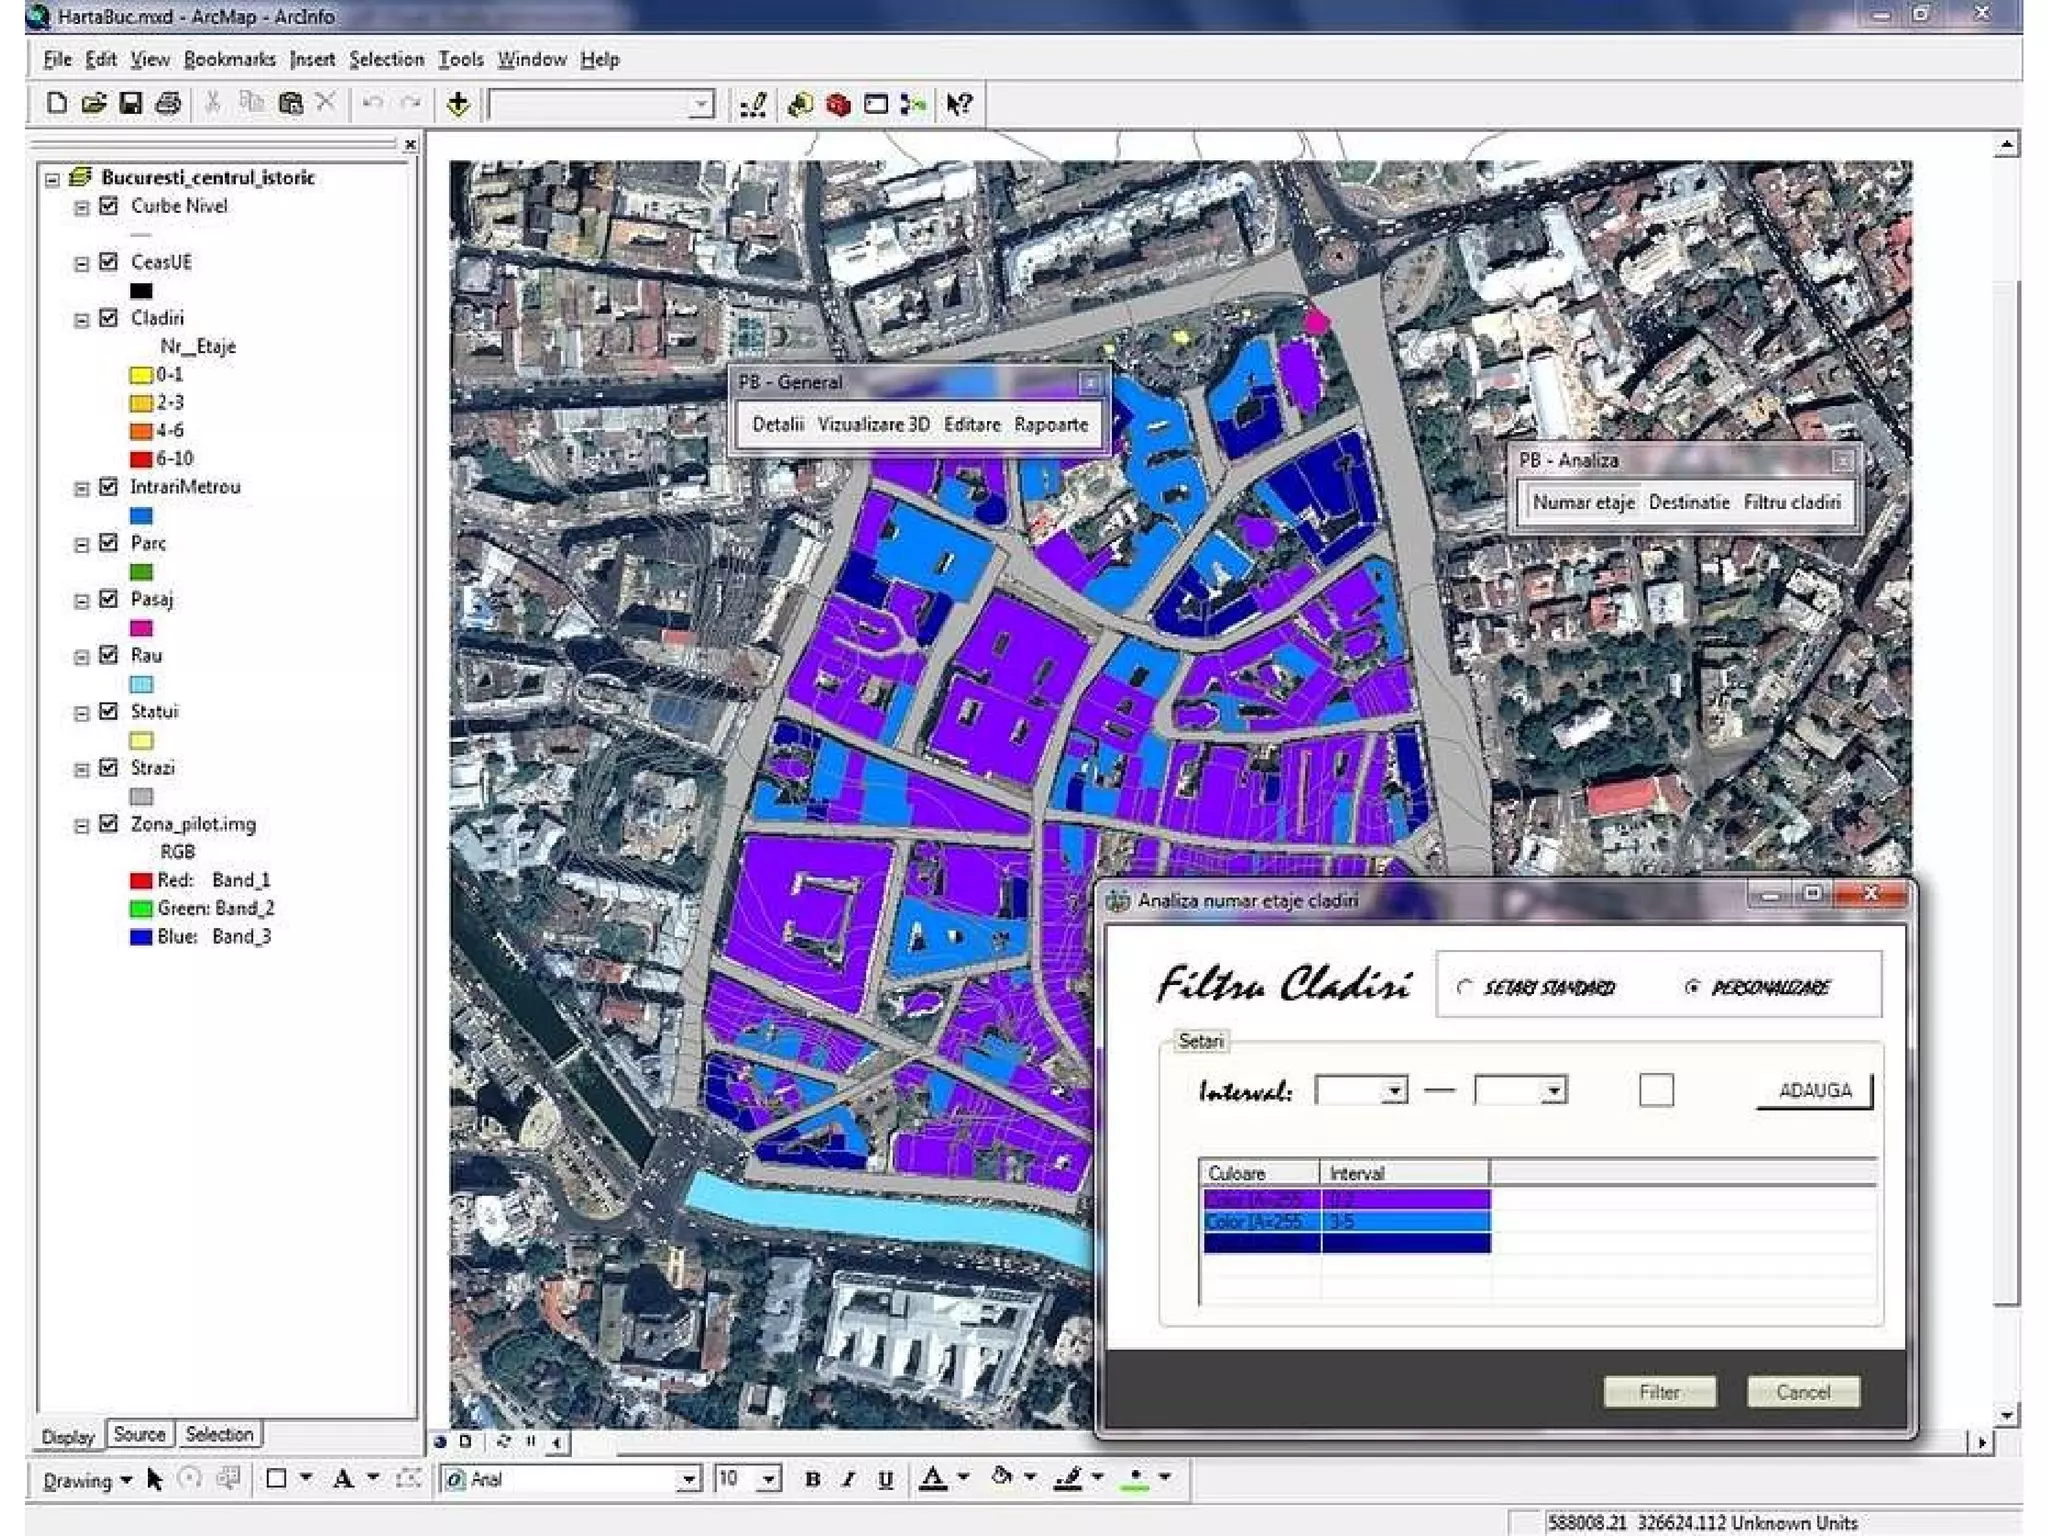
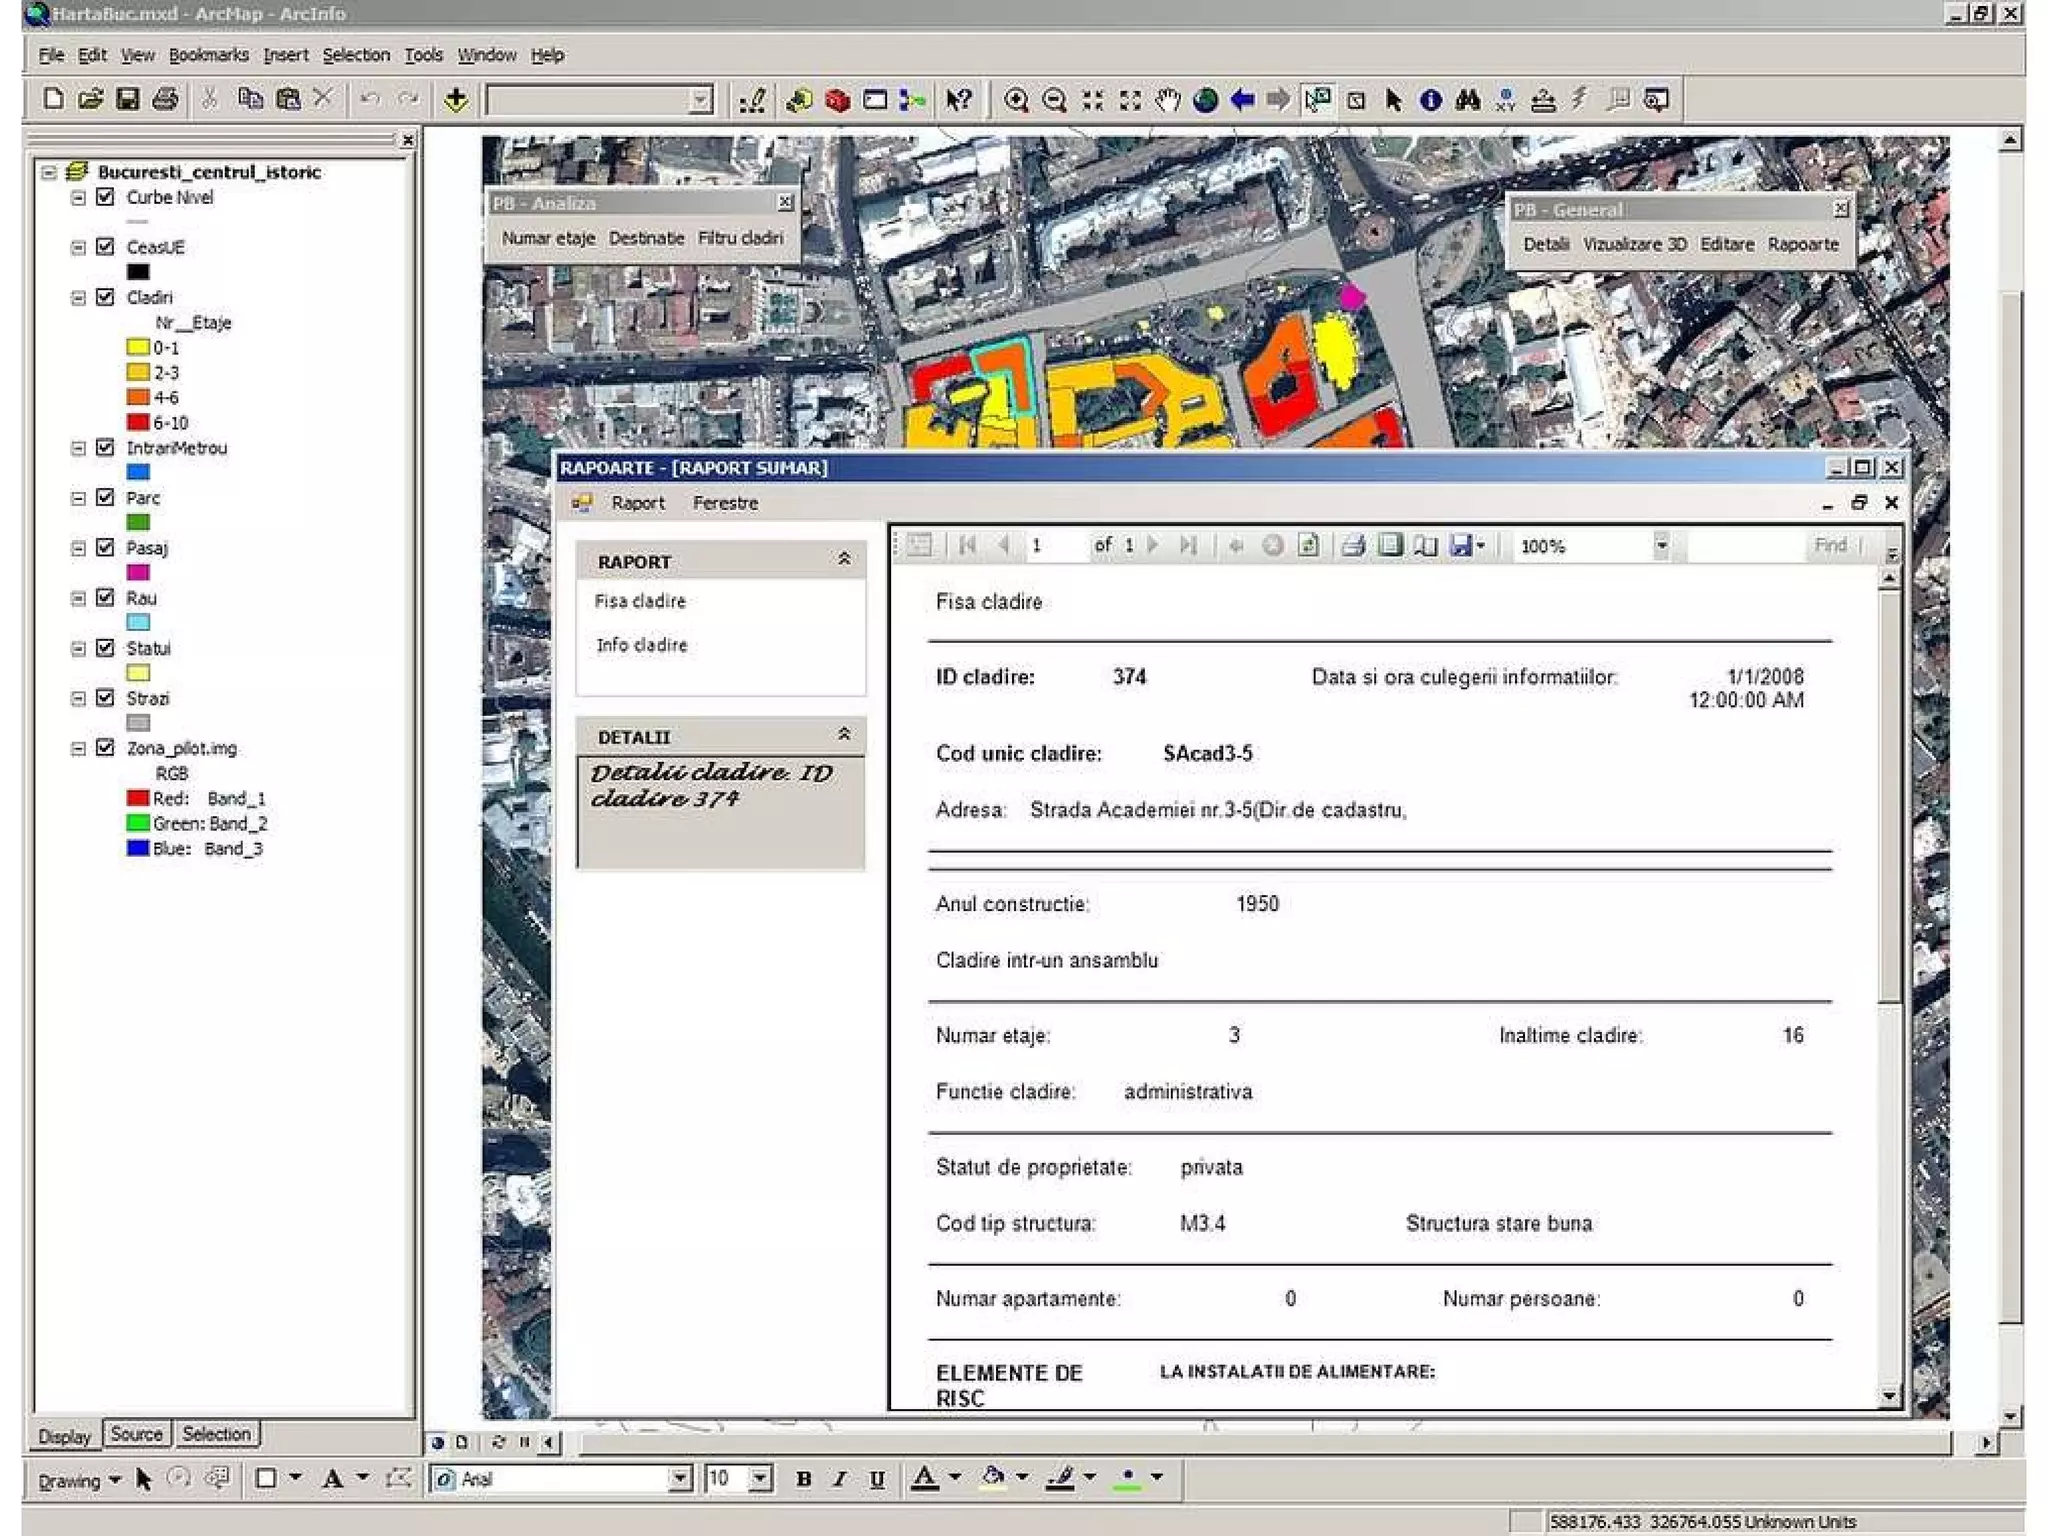
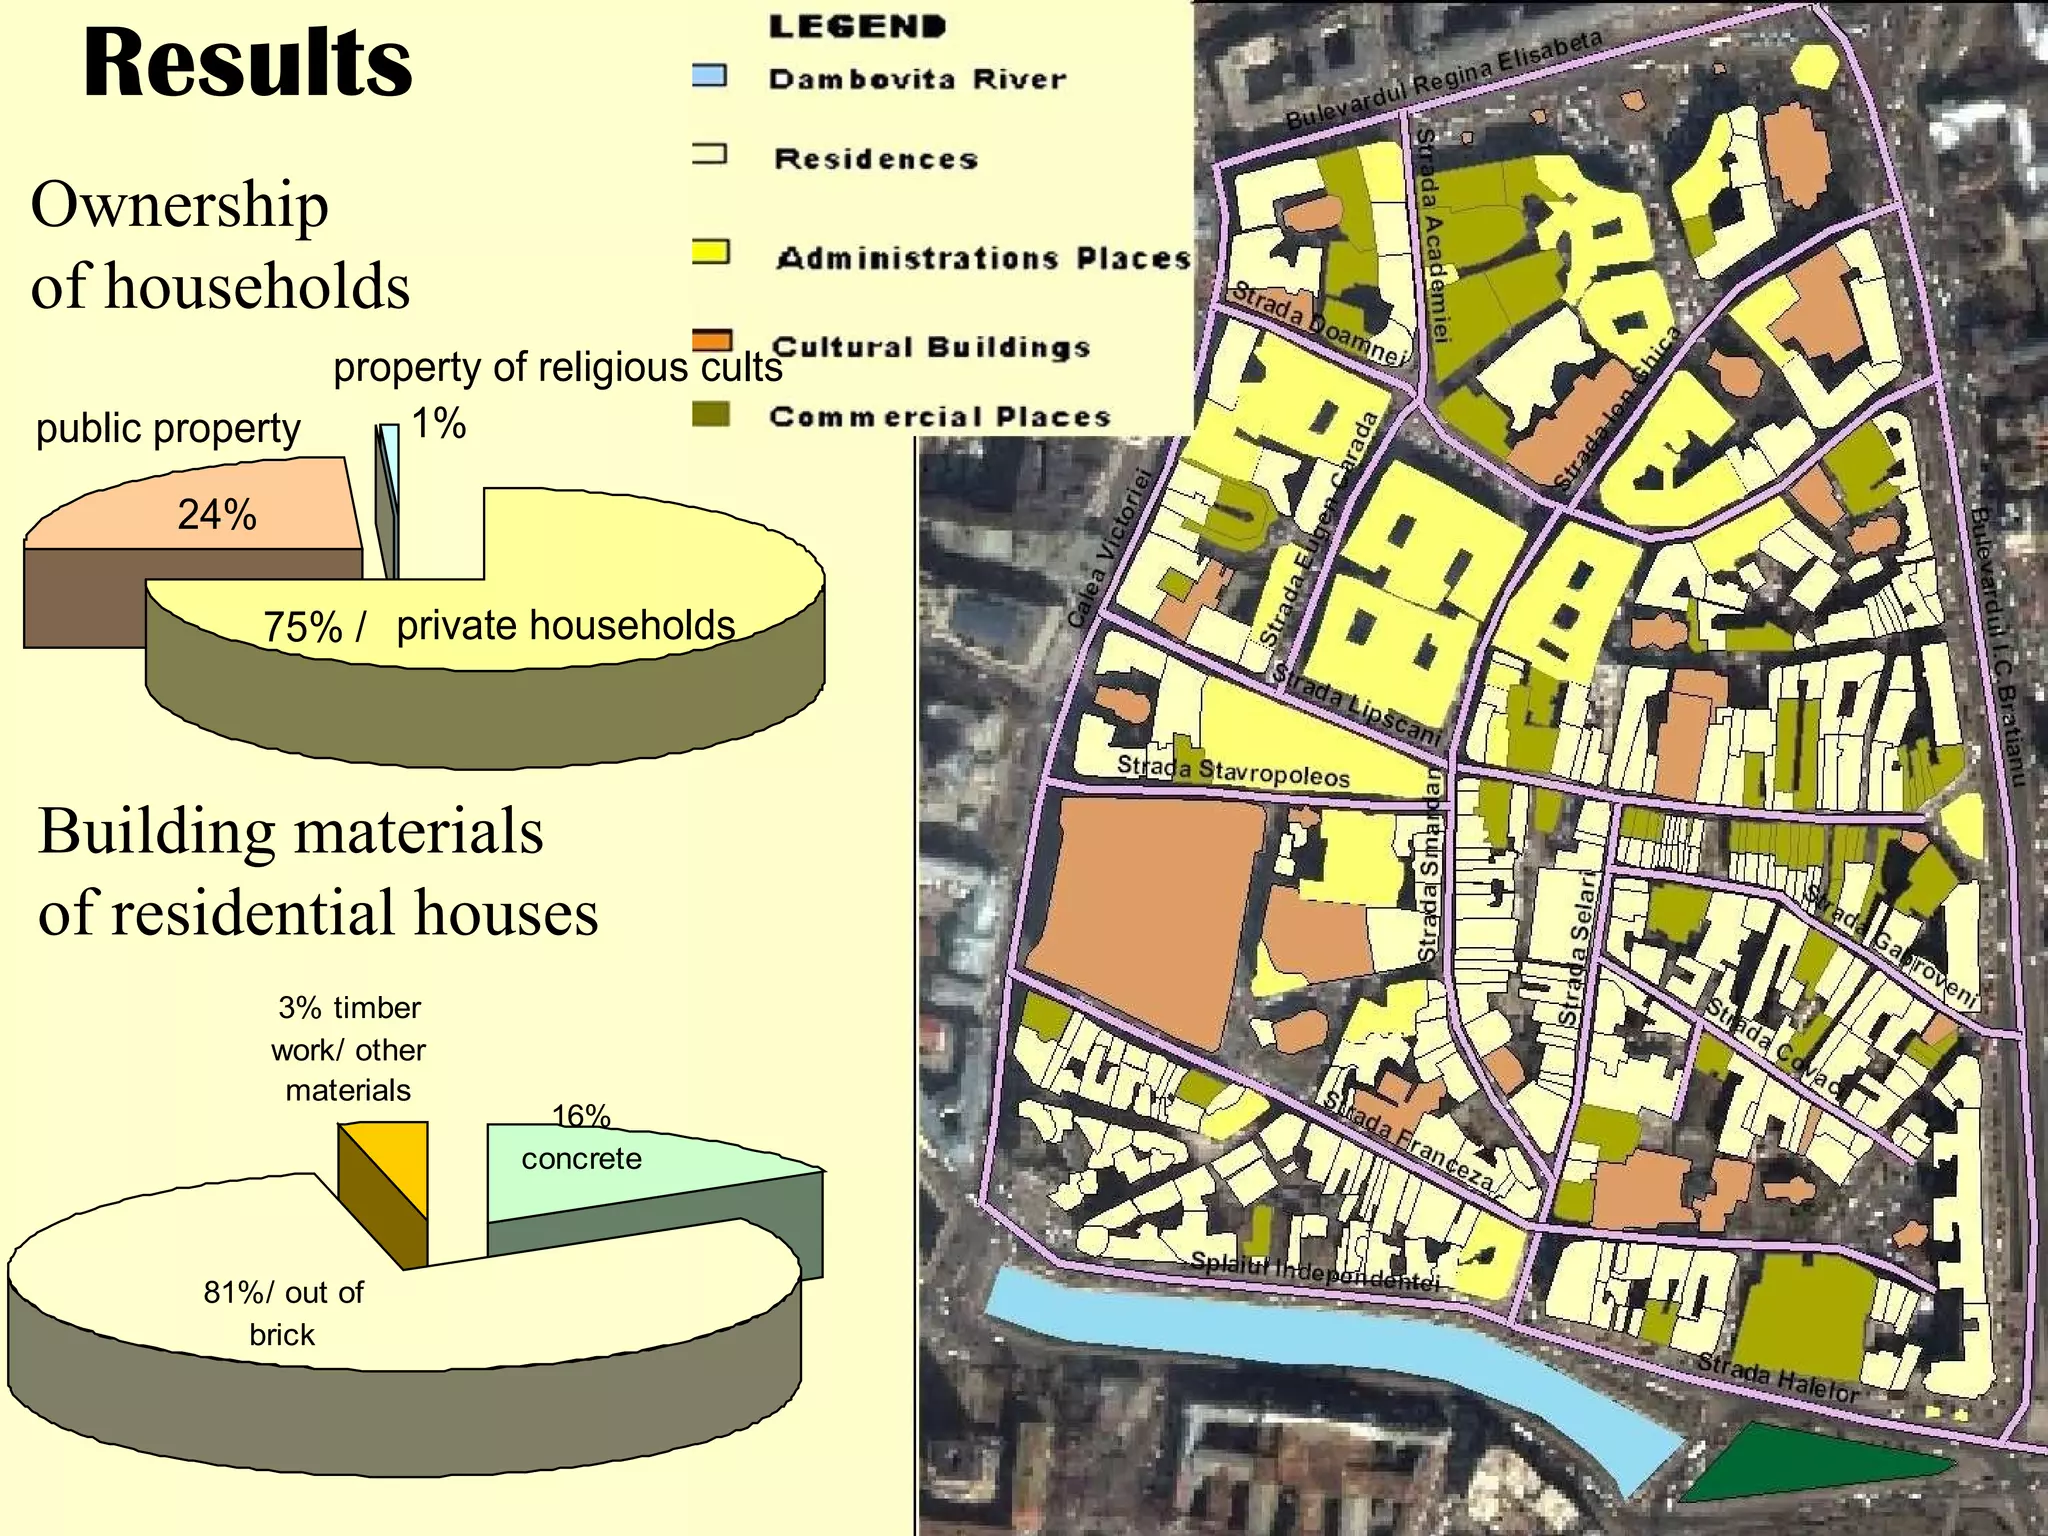
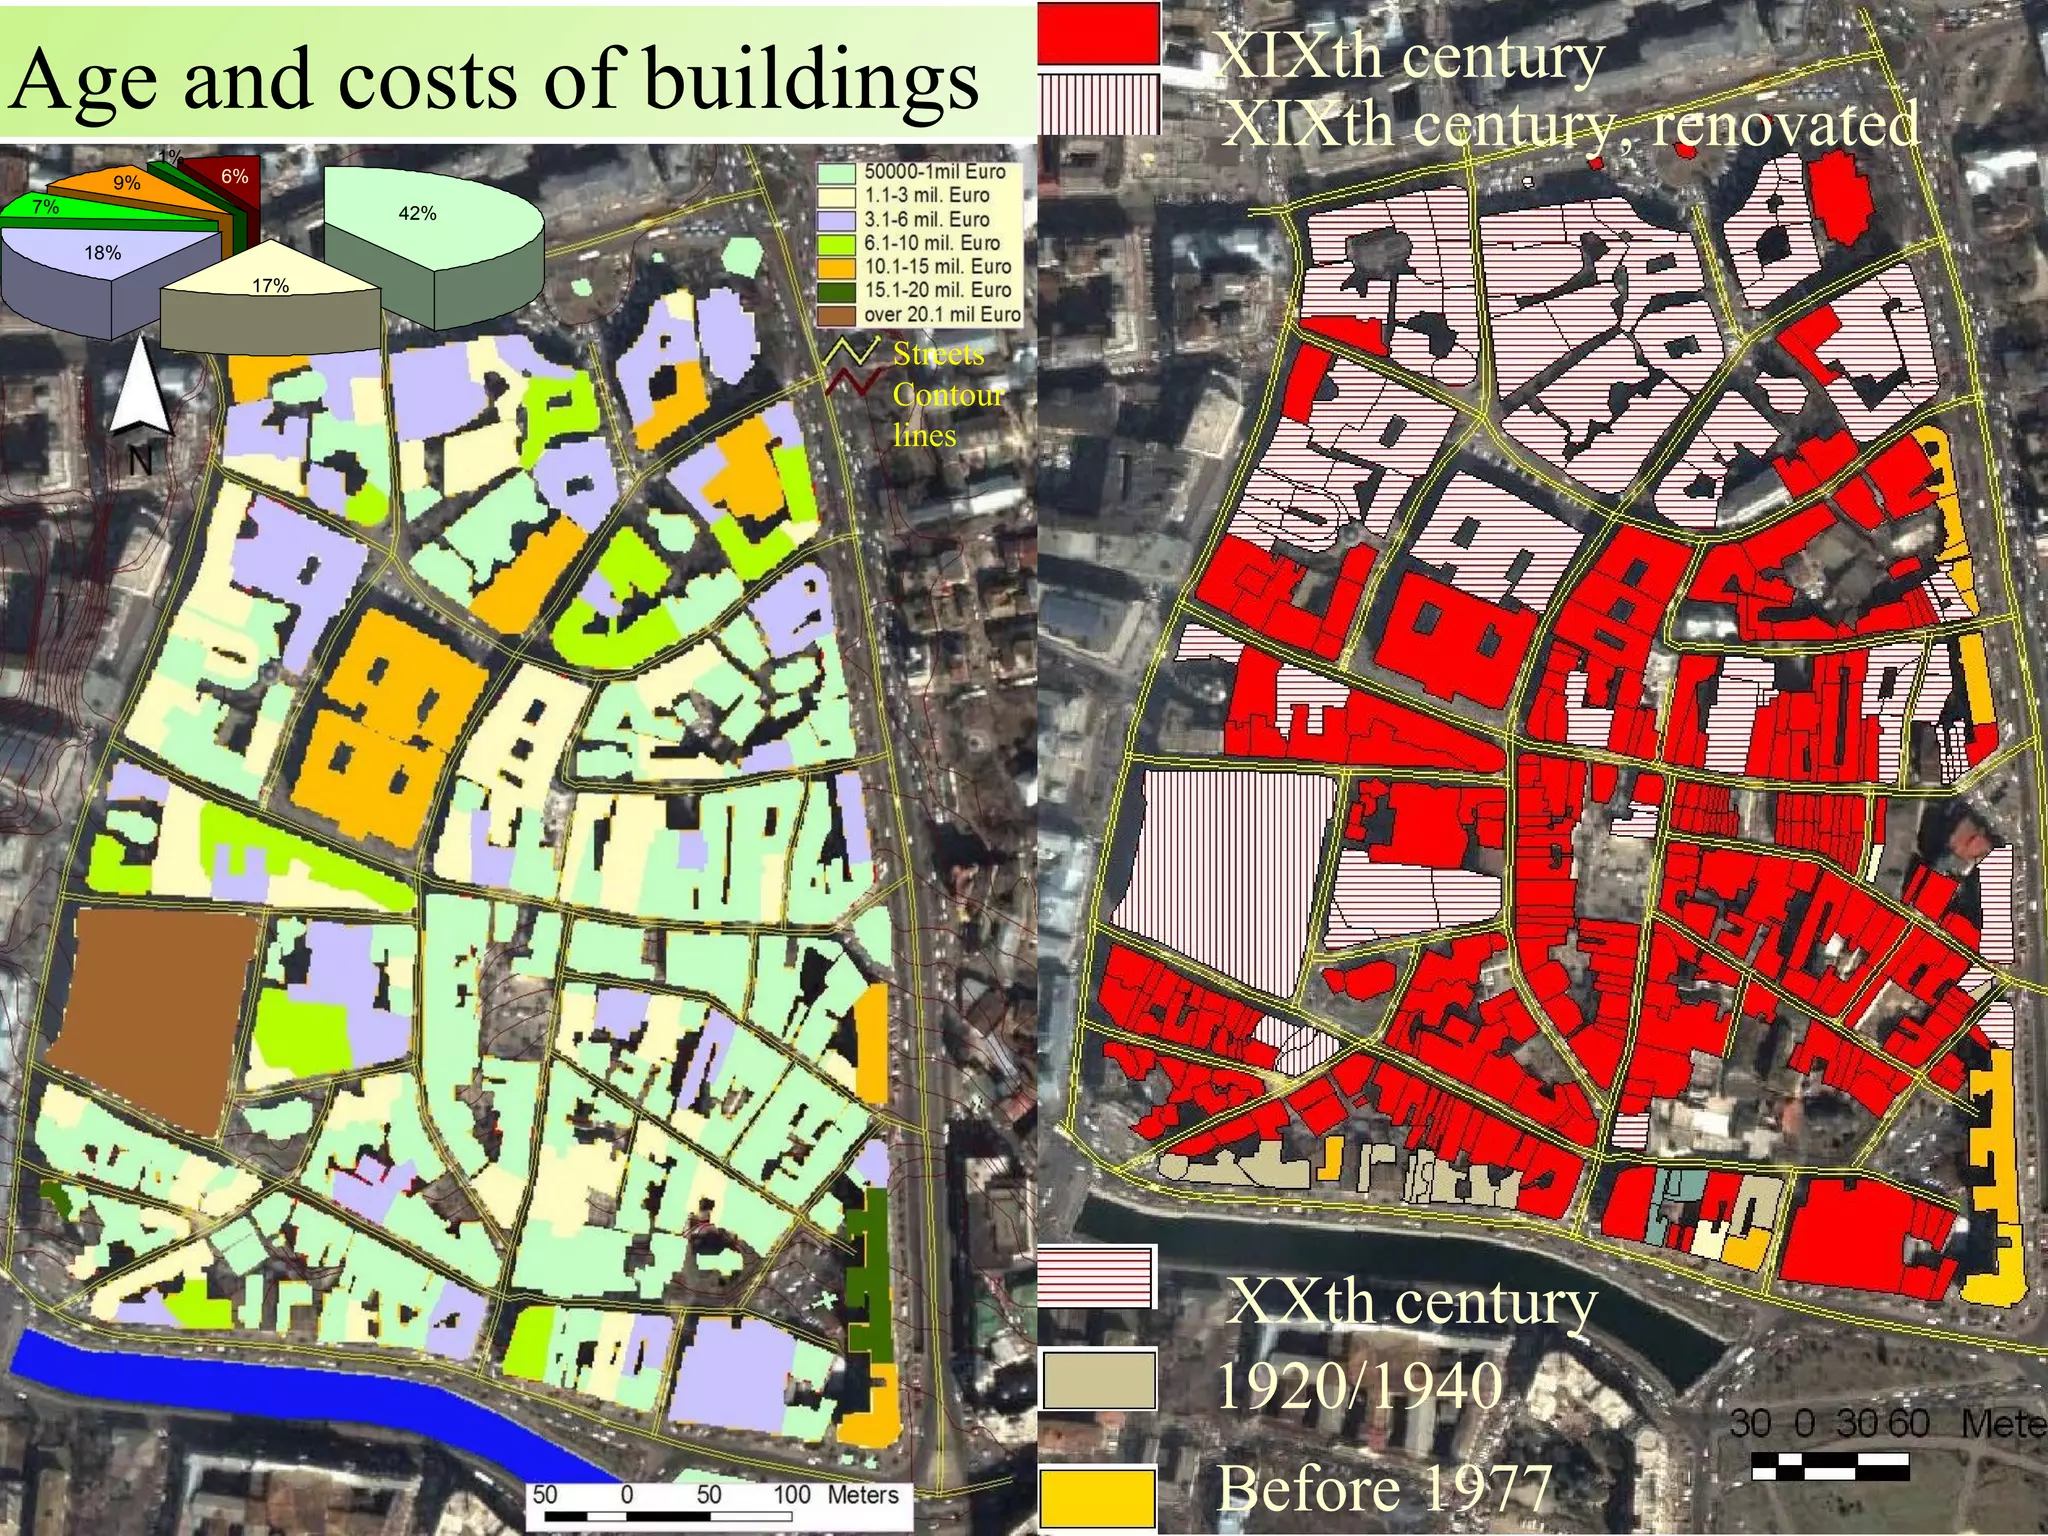
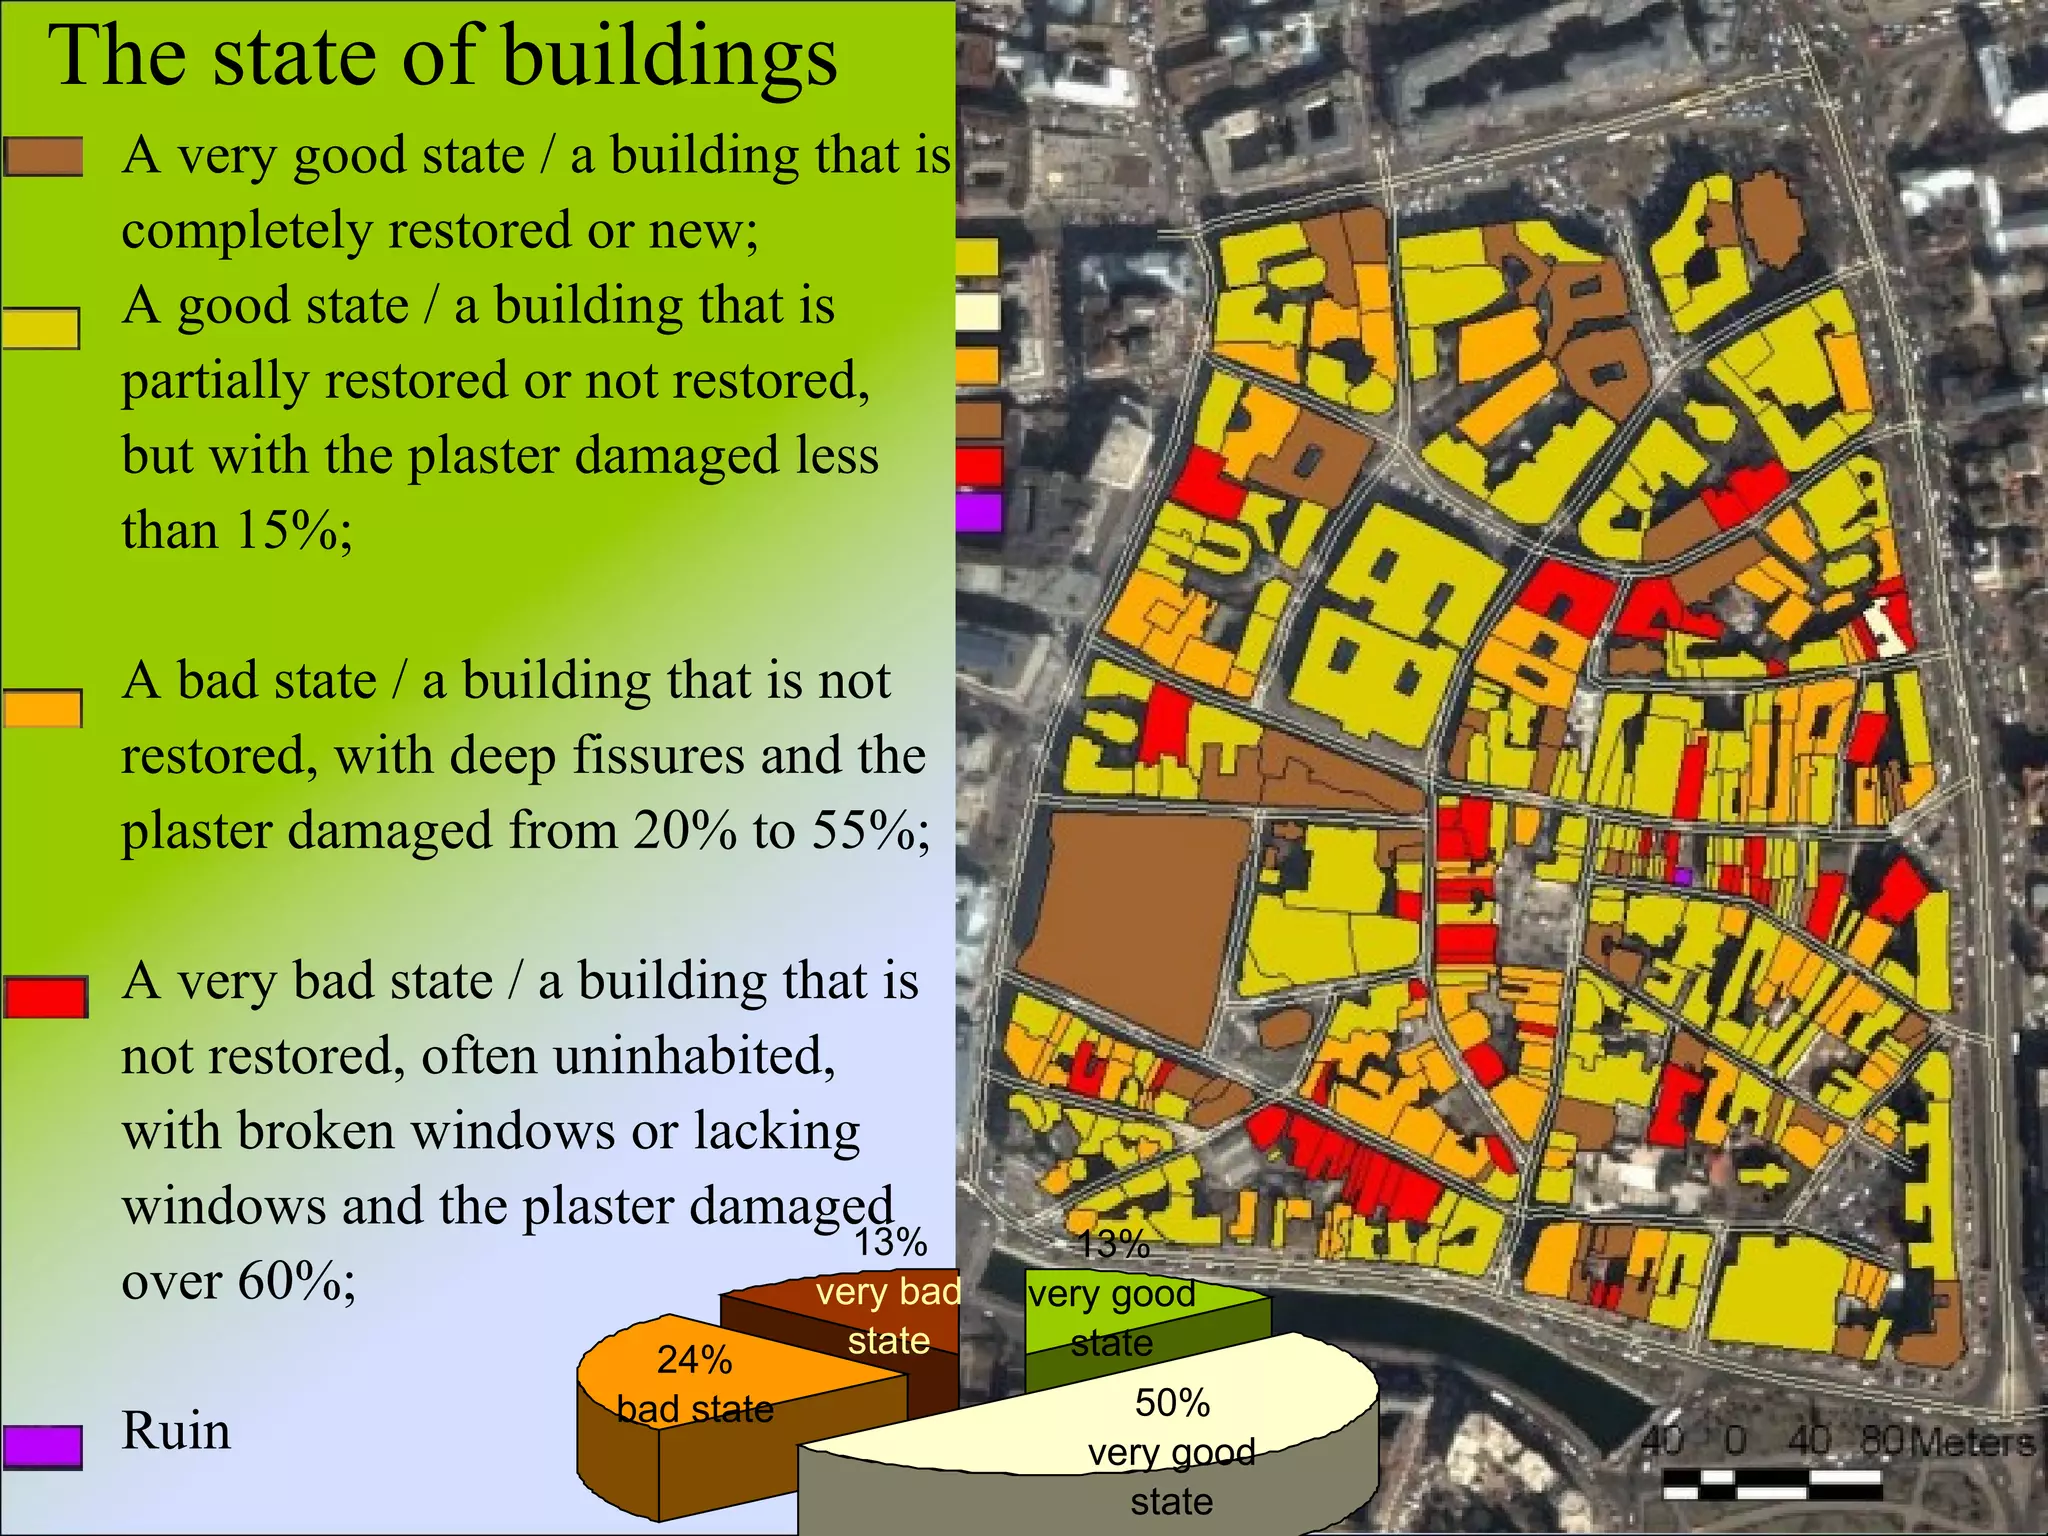
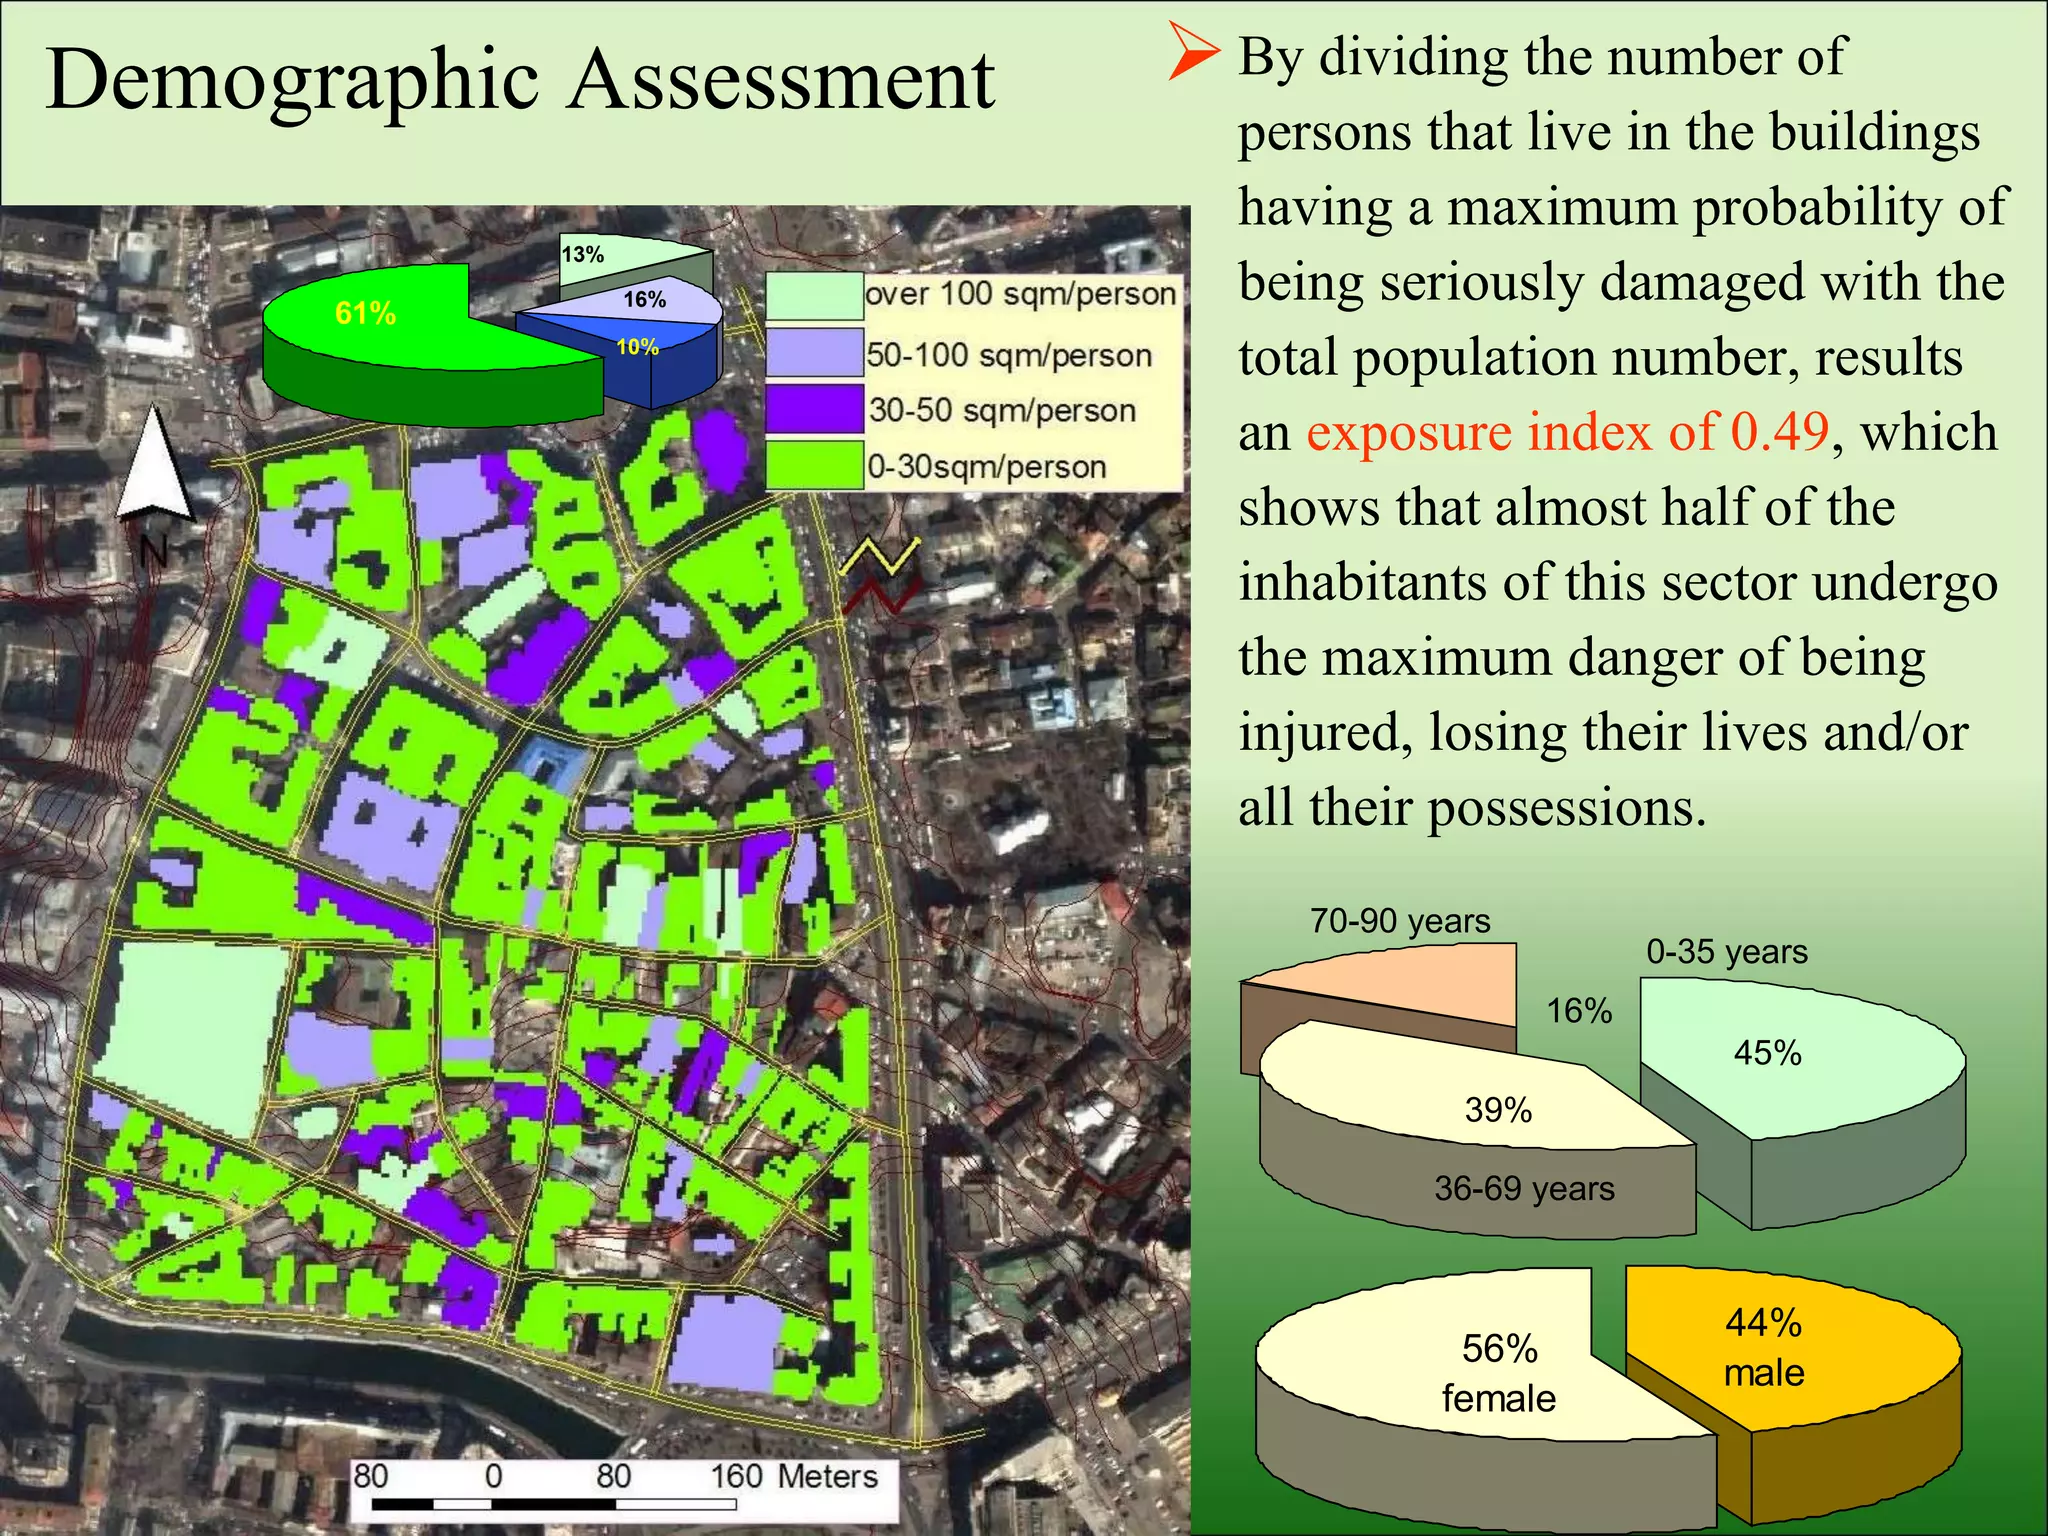
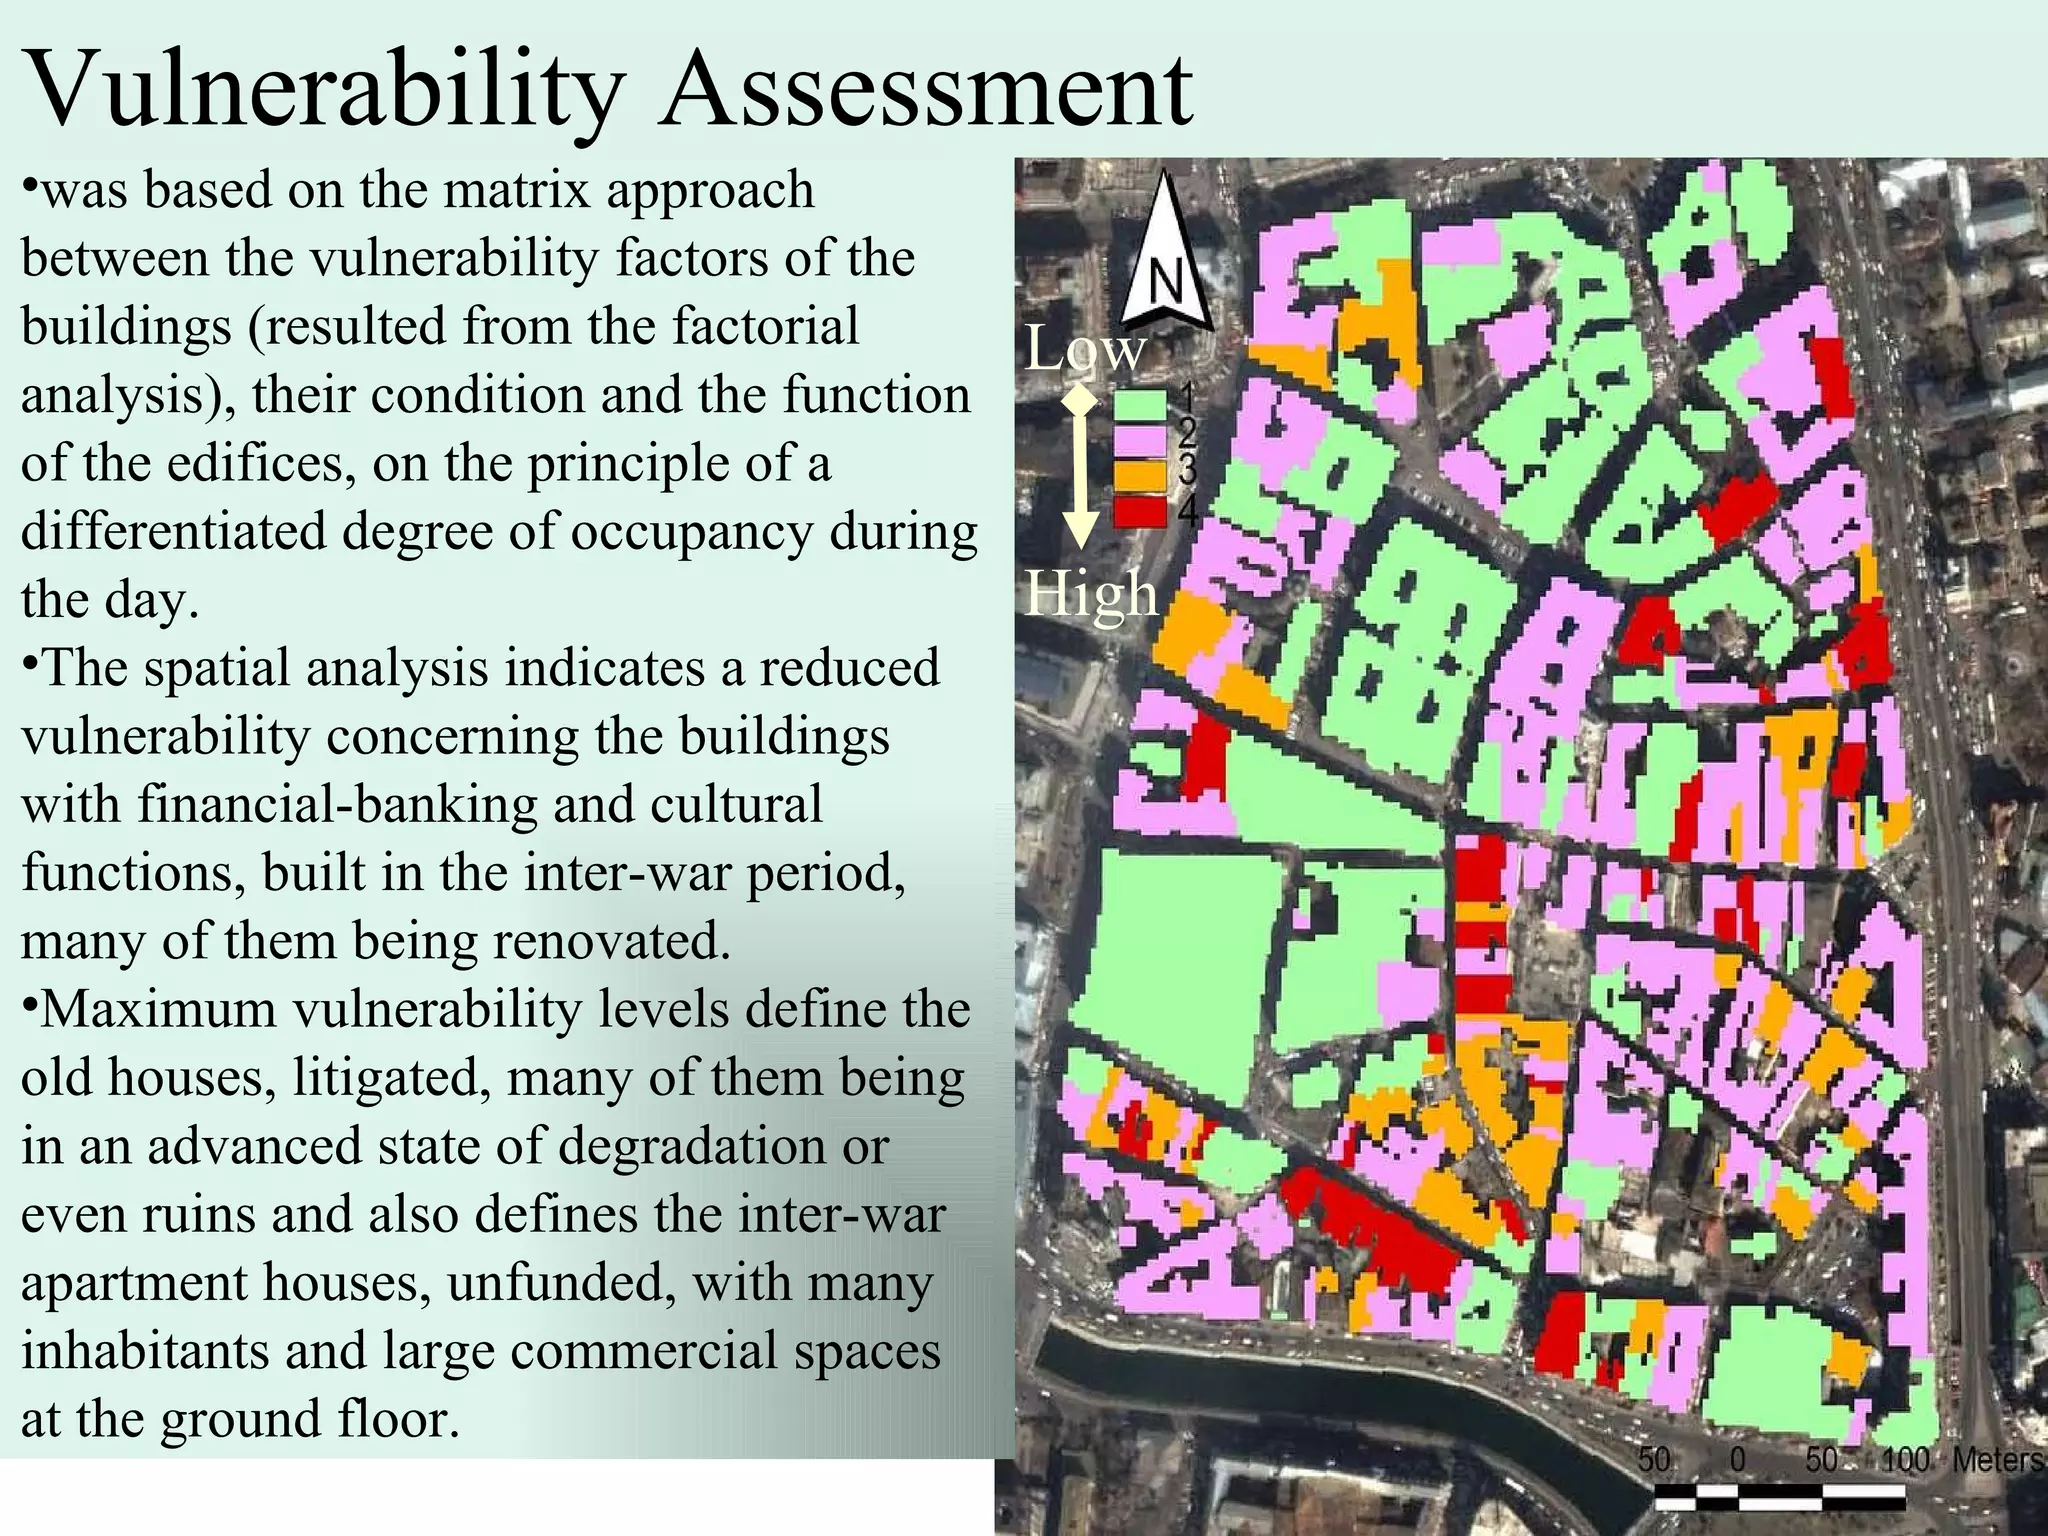
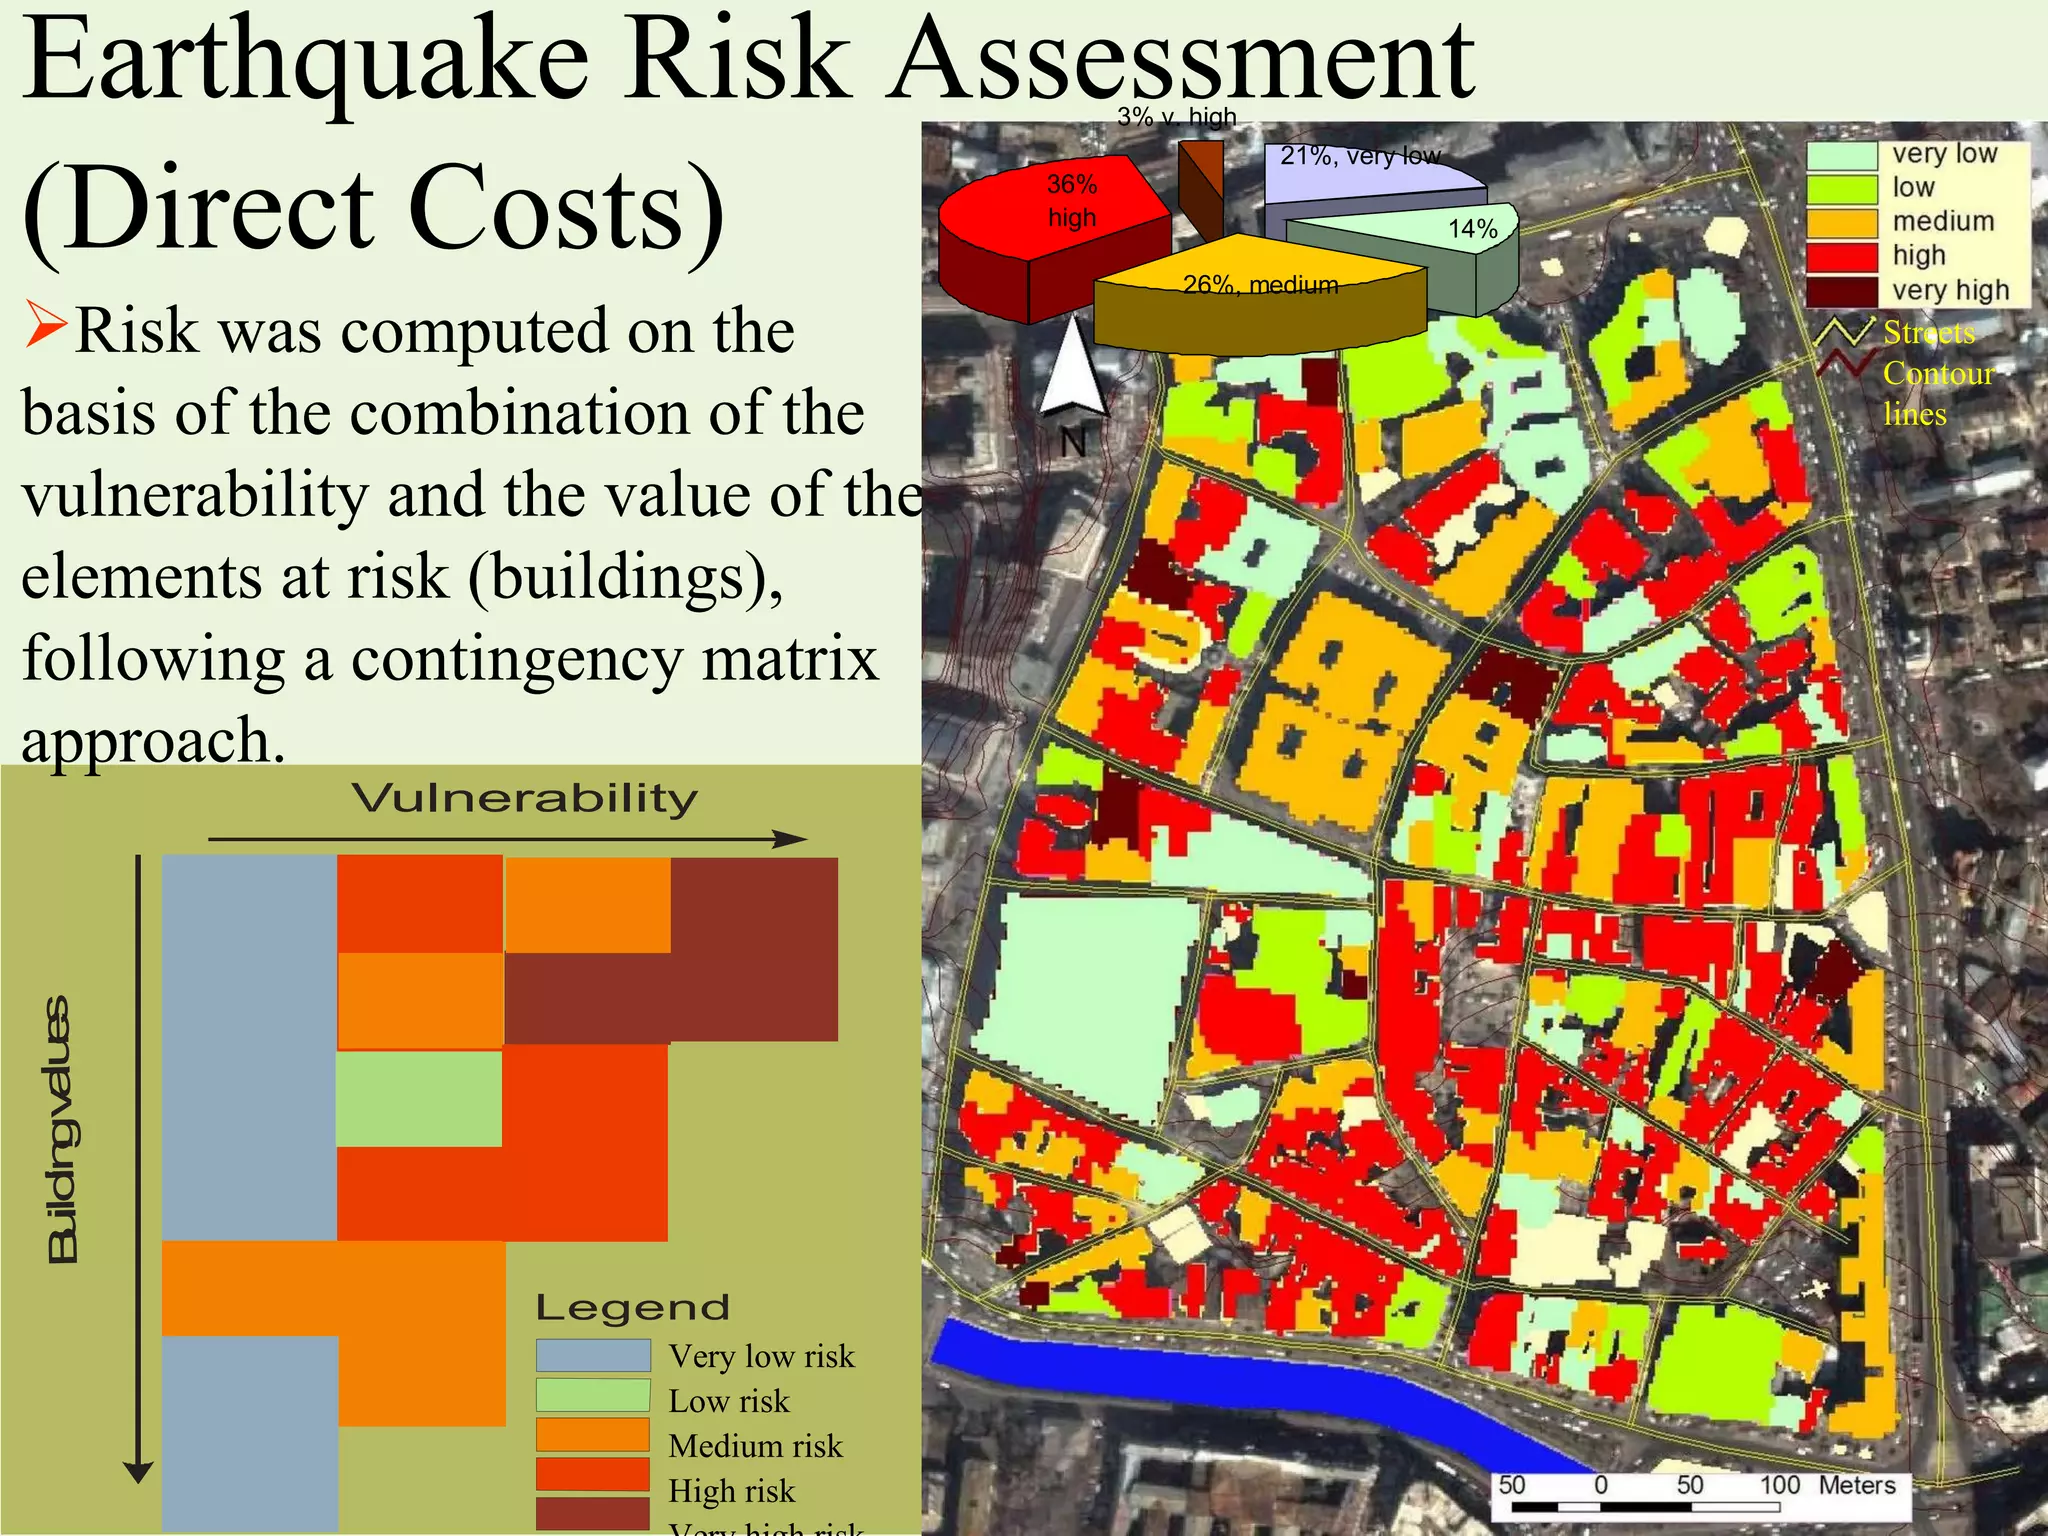
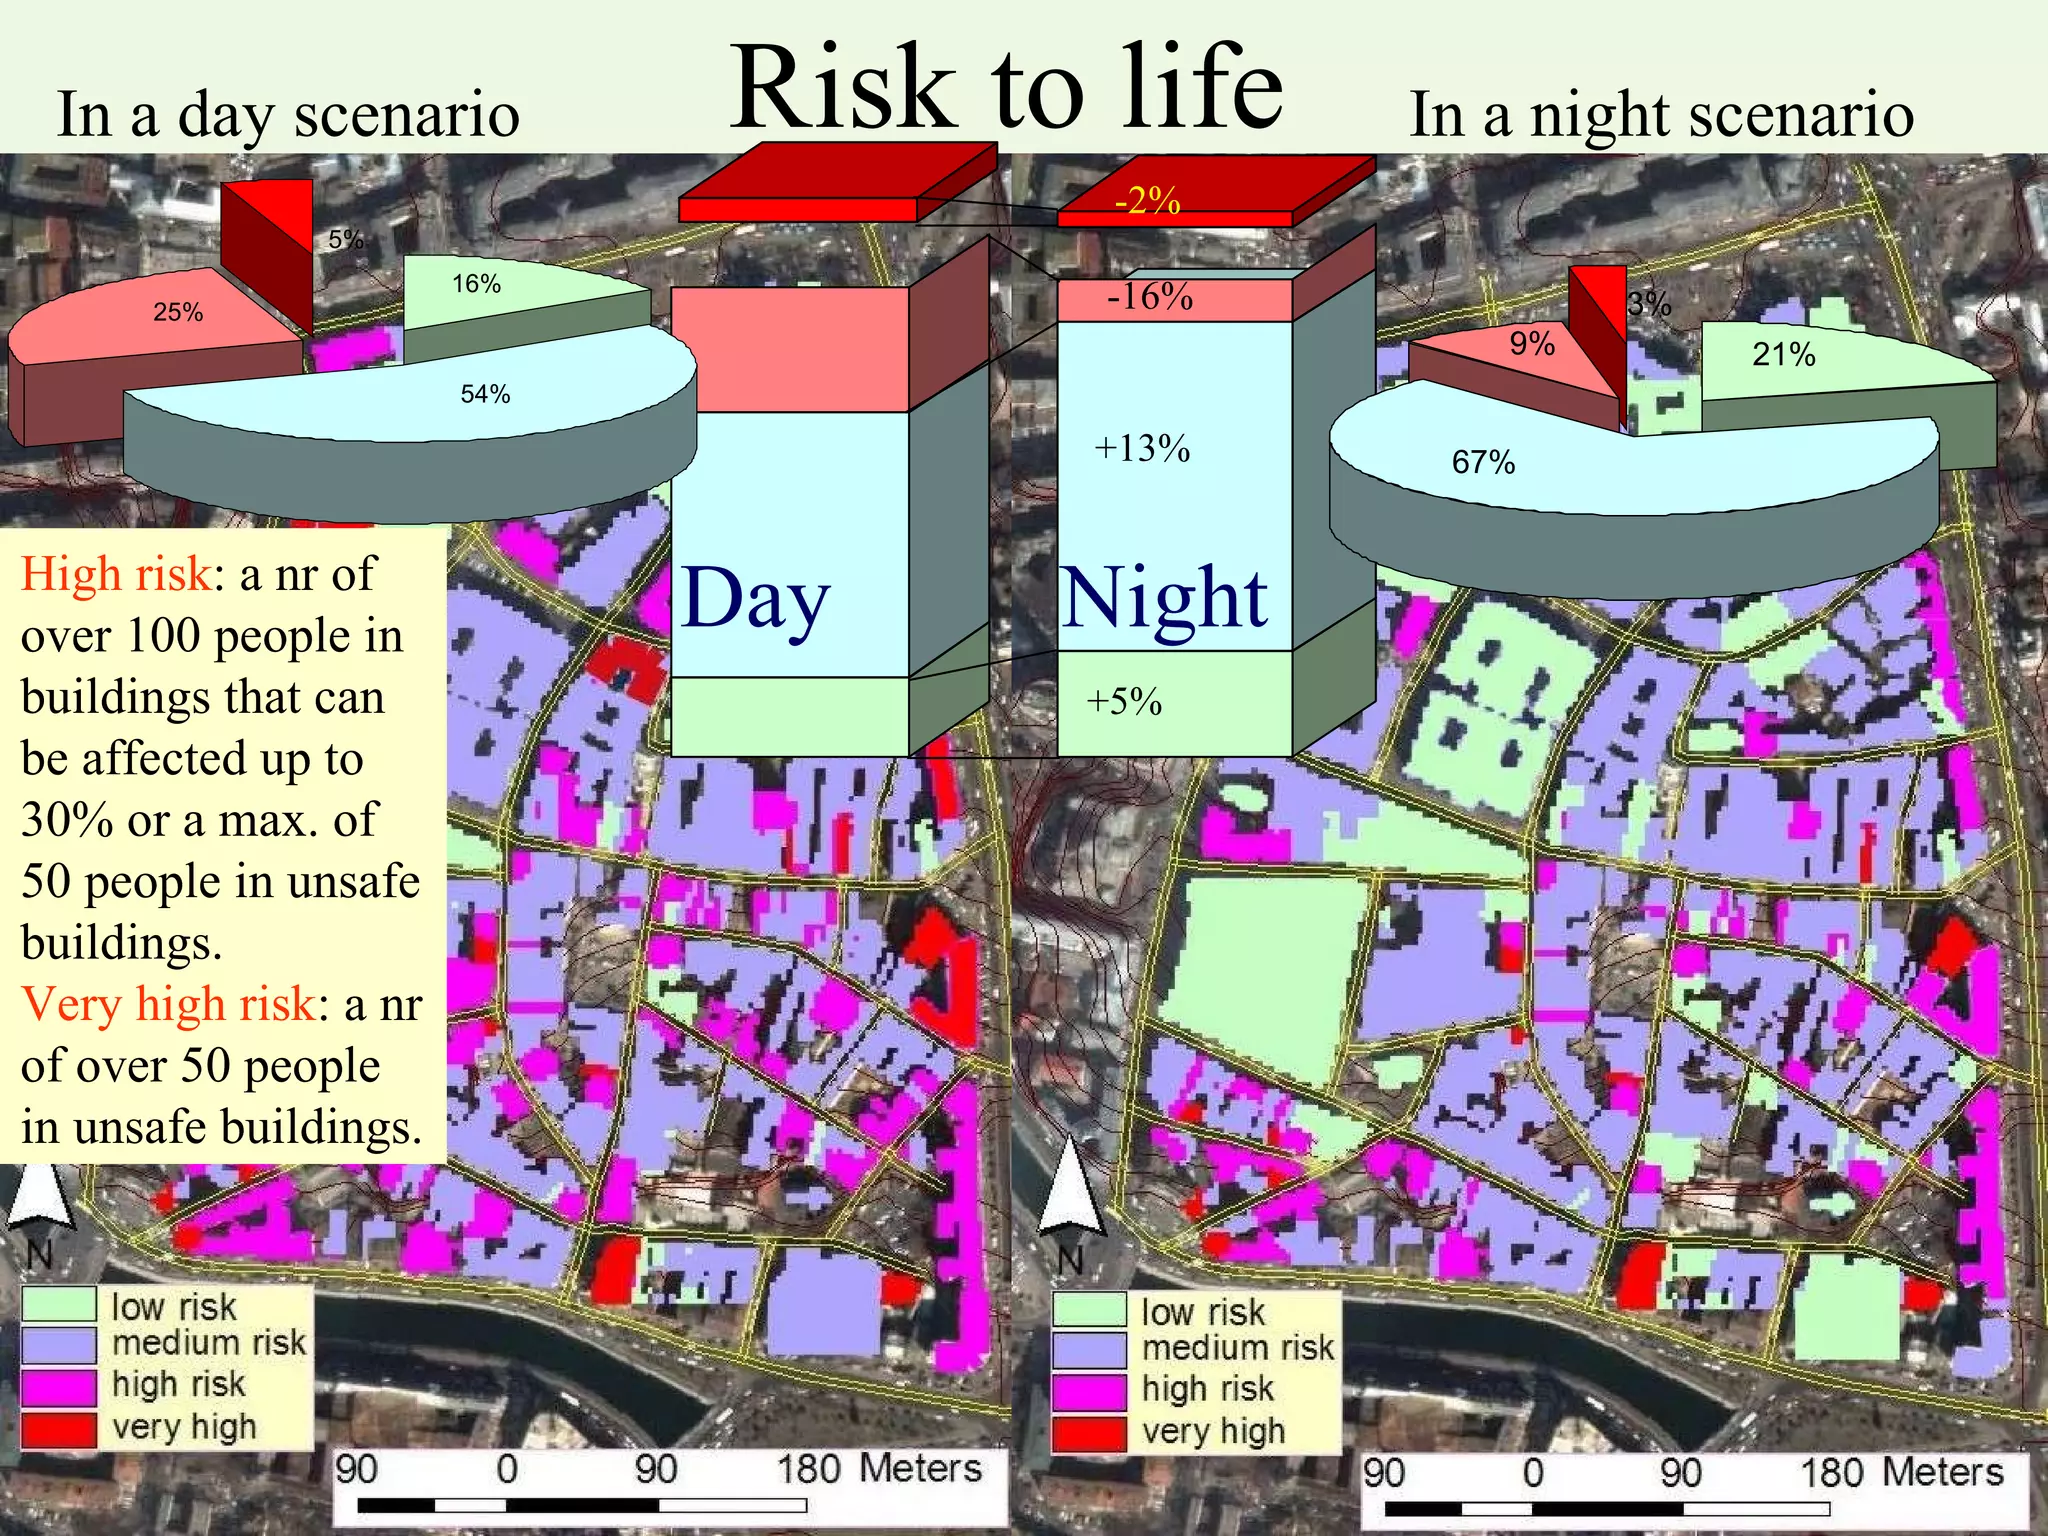
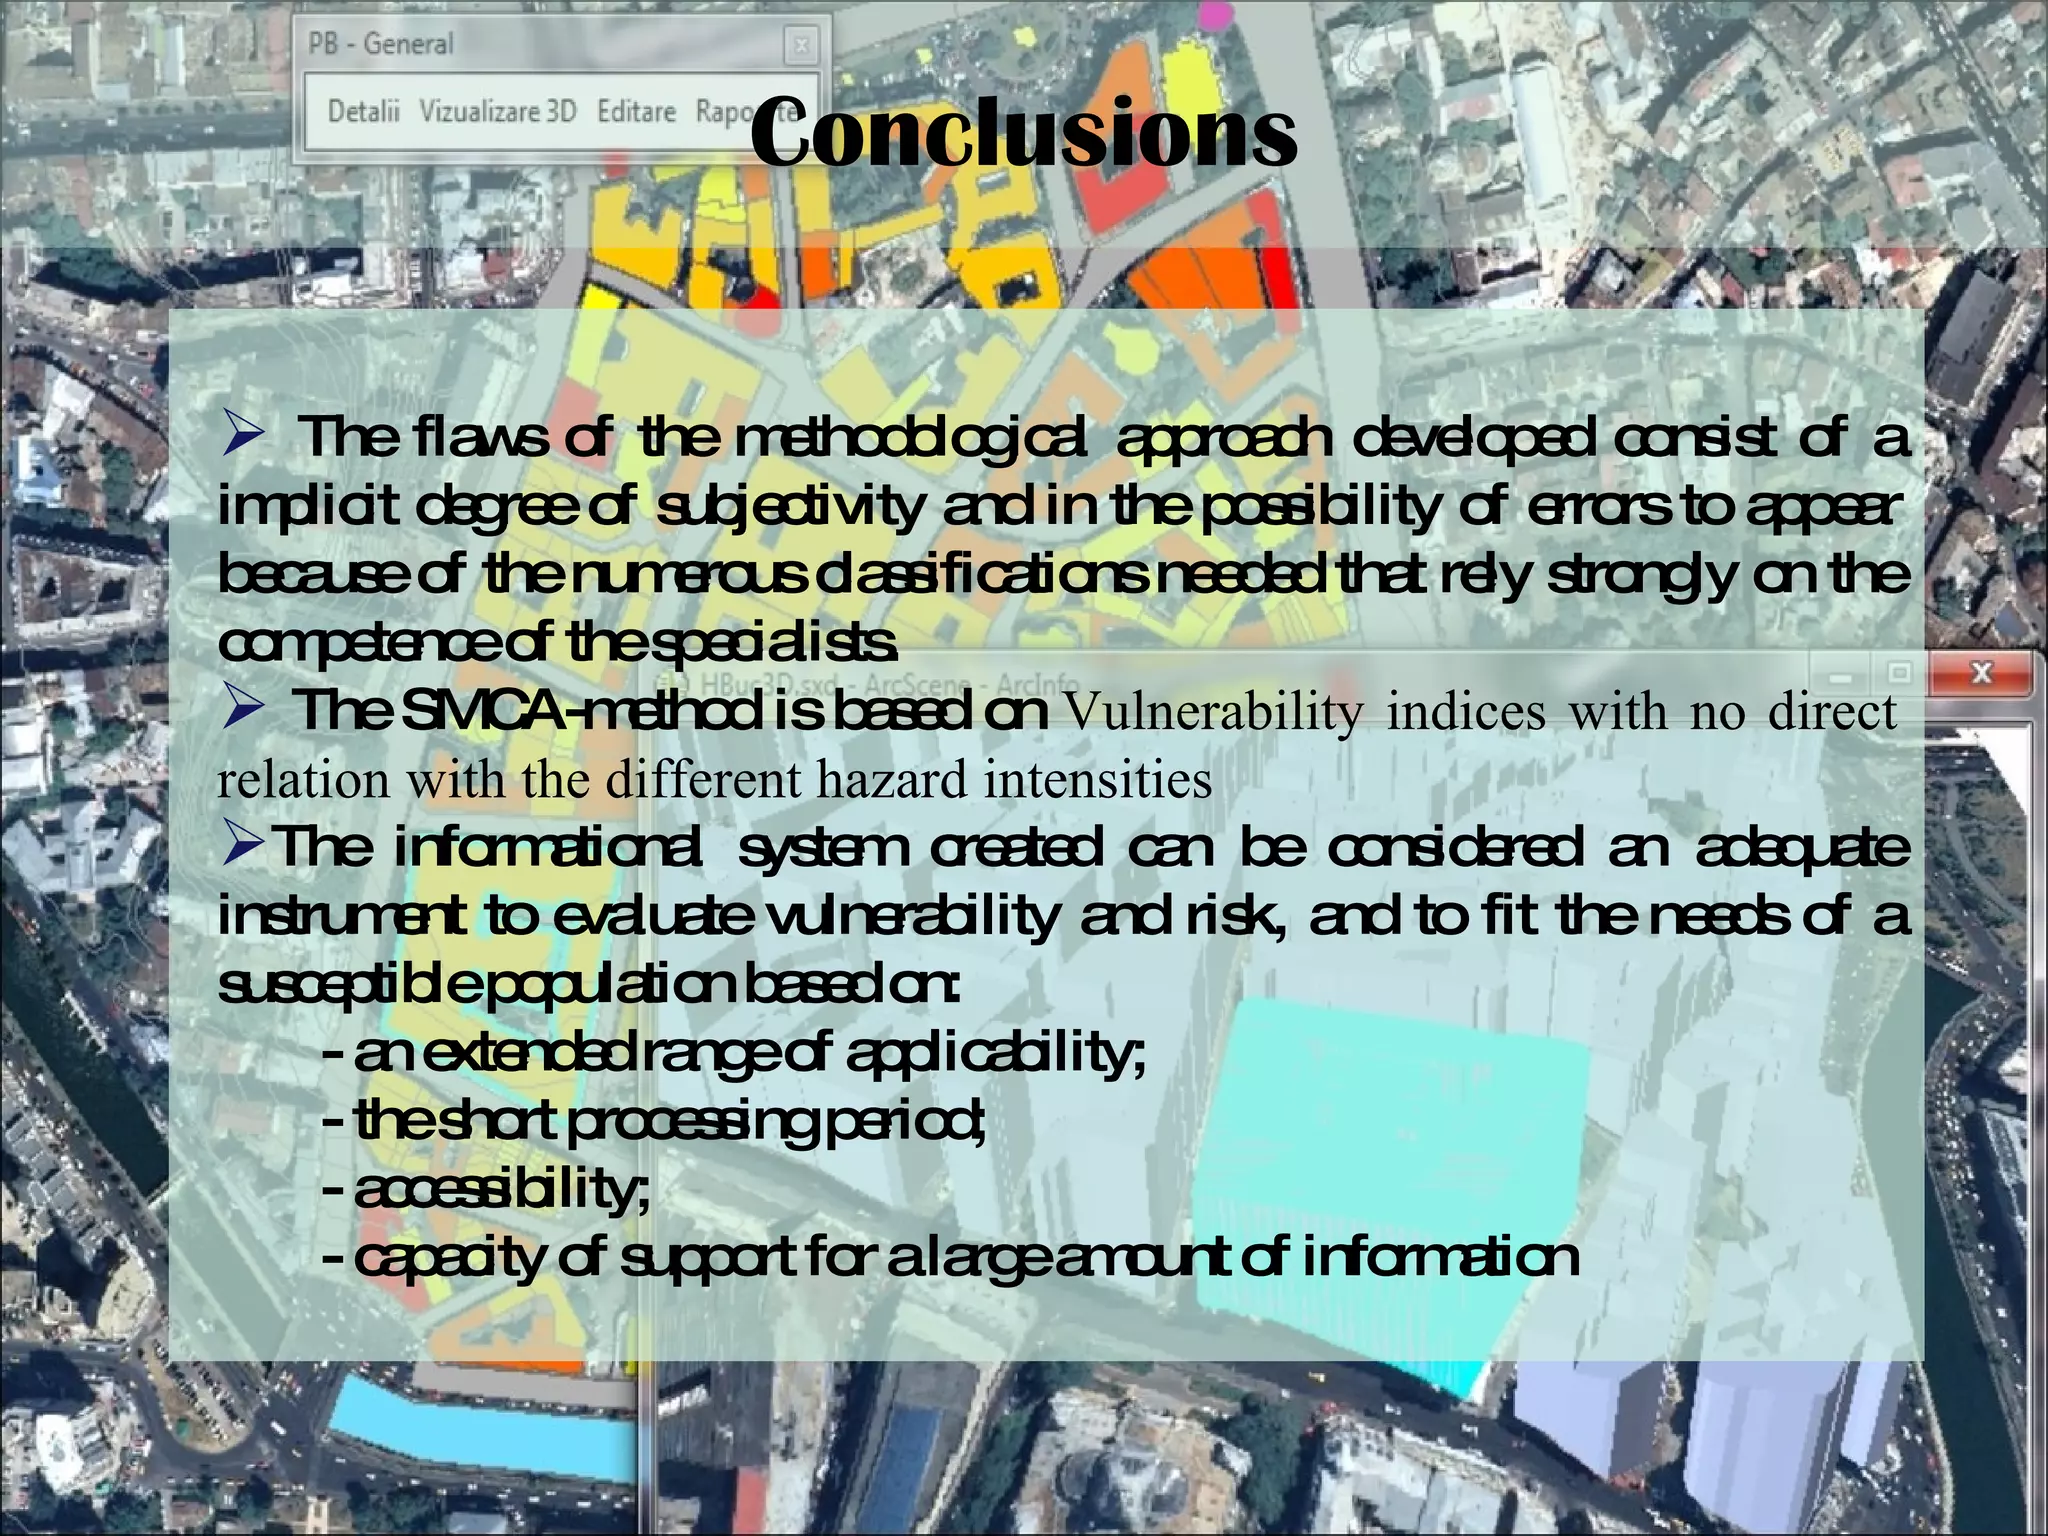
Director: Prof. dr. Iuliana ARMAS, University of Bucharest   Research Project:   Multihazard and vulnerability in the seismic context of the Bucharest Municipality  COST Action TU0801: Semantic Enrichment of 3D city models for sustainable urban development  Acronym: HERA (HAZARD, EXPOSURE, RISK, ADAPTABILITY)
Research Partners Faculty of Geography, Risk Research Center-   University of Bucharest,  prof. dr. Iuliana Armas (Coord.) Faculty of Cybernetics -  Academy for Economic Studies ,  prof. dr. Marian Dardala National Institute for Earth Physics ,  dr. Mircea Radulian Faculty of Civil, Industrial and Agricultural Constructions - Technical University of Constructions  in Bucharest,  prof. dr. Al. Aldea
OBJECTIVE of PHASE 2009 URBAN VULNERABILITY ASSESSMENT TO SEISMIC HAZARD THROUGH SPATIAL MULTI-CRITERIA ANALYSIS.    Overall Vulnerability = Total Vulnerability/Capacity  where: the total vulnerability of the analysed urban space was considered as a function between the  seismic   susceptibility of the natural system and the susceptibility of the socio-human system to be affected by a seismic hazard ; the  capacity  of the urban system to adapt and cope with disasters, was considered in the estimation of the overall vulnerability. The output map was classified in qualitative classes, comparing the histogram from the overall vulnerability.
Complex vulnerability is the central predictive variable in the risk equation. A half-century of experience in the natural risk field shows that the only effective way to diminish the natural risk is by reducing the vulnerability of natural and socio-economic systems.  Although multiple definitions and different conceptual vulnerability frameworks have been proposed, it is still difficult to quantitatively estimate physical and social vulnerability. After a general evaluation through the SMCA method of the overall vulnerability of Bucharest city, a focused research on the most vulnerable area of the historic center was done with the development of a soft to filter, analyze and visualize the results.
Conceptual Background Methodological Framework The following terminology background outlines vulnerability and capacity Vulnerability “ The conditions determined by physical, social, economic and environmental factors or processes, which increase the susceptibility of a community to the impact of hazards.” (UN/ISDR, 2004) Capacity “ A combination of all the strengths and resources available within a community (...) that can reduce the level of risk or the effects of a disaster. “  (UN/ISDR, 2004)
Study area Bucharest, the capital of Romania, is a populous city (1.9 mil.inhabitants –  INSSE.  2009* ) located in the alluvial Romanian Plain .  The total urbanized area is 228 km 2 The dwellings are part of 32 residential areas divided up into 6 sectors. Combining the natural  and urban attributes, with the seismic hazard induced by Vrancea source, Bucharest has been  ranked as the 10 th  capital city worldwide in the terms of seismic risk. *  National Institute of Statistics – ROMANIA
 
Met h odolog y The first step was to determine human vulnerability with the use of census data of population and housing, dated 2002 (Cutter et al. 2003; Dwyer et al. 2004). The scale of analysis was considered at the level of census units (2002).
The next step consisted in database processing through a series of structure exploration techniques based on the cluster analysis and factorial reduction procedures. Both techniques revealed the “coagulation” of variables in factors. During the subsequent processing, the scores of the variables in which the selected factors are saturated were aggregated and applied in a standard Spatial Multi-Criteria Analysis (SMCA).  Complex social vulnerability factor   (SVF) resulted from the factorial reduction procedure (PCA, Varimax)
The vulnerability of the  housing quality  (HQ) was calculated based on the formula:  HQ = (N r.a.   + N p.a.  + N o5  ) – ( N o  + N d ) The higher the value of this composite factor, the lower becomes the vulnerability of the area.
The vulnerability of the  economic level  (EL)  was calculated based on the formula:  EL = (N u   + N l ) – (N h.m.  + N h.w. )
the assessment was done based on the RADIUS methodology, in which Peak Ground Acceleration was calculated for 11 earthquake scenarios (the vulnerability hazard map compiling the average of the PGA values), and the amplification of soil was treated by simple multiplication values with the use of the 1:200000 Romanian geological map. Nevertheless, this method gives only a very general approximation of the hazard. Environmental Vulnerability
focused on 4 groups of vulnerability indexes, selected according to the available data, the statistical results and the expert’s opinion:  social vulnerability  (aggregated social factor, elderly population, ratio of female population in total population, ratio of widowed persons, housing density),  economic vulnerability  (aggregated economic factor and housing quality),  physical vulnerability  (the assessment of the buildings) and  environmental vulnerability  (susceptibility to the seismic hazards). In addition, the  coping and resilience capacity  was estimated based on a  Distance analysis  to the hospitals, fire stations and police stations and, also, based on the  literacy rate index . The (spatial) Multi-Criteria Analysis (SMCA)
Methodological flowchart
Following the MCA standardization (goal and maximum standardization) was the estimation of the weights among groups of factors using pairwise comparison and ranking methods (Saaty, 1980; Janssen, 2001).  In the process, weights were multiplied with the standardised values and intermediate criteria maps were generated and combined using decision rules, for a better definition of the weights.  As a result, the total vulnerability index map was obtained by adding up the performance of all cell values of the human and environmental vulnerability criteria for the particular alternative. The (spatial) Multi-Criteria Analysis (SMCA)
Results
 
Building-stock Vulnerability Struct ure Average height Vu Average  density
The total vulnerability index map for Bucharest city resulted from the previous spatial composite indicators:  social, economic  and  building stock vulnerability criteria , for describing the human vulnerability, and by adding the  environmental vulnerability  into the spatial multicriterial analysis .   Green city areas  and  barren grounds  were, also, included as spatial constraints .
In order to measure the level of capacity that would help reduce the overall vulnerability, two indicators were used:  preparedness level  (expressed through distance to hospitals, fire stations and police stations) and  awareness level  (based on the literacy rate). The best position is for the city central and pericentral areas (with very good accessibility to the emergency centers and scoring the highest values of the literacy rate). Capacity
The overall   vulnerability index map for Bucharest city it was calculated by dividing the total human vulnerability values to the capacity composite factor.  the configuration reveals a radial spatial pattern with values increasing from the central to the marginal areas.  The historic city center scores high based on the building stock vulnerability criteria and the environmental vulnerability level to the seismic hazard.  F requently, brick buildings are in poor repair, and many of them are in total ruin today. A population of modest means now inhabits these buildings. Most of the buildings are included in categories of the greatest seismic vulnerability, and were built between 1875 and 1940.
Study area (1977)


Editing building


Building materials  of residential houses Ownership  of households Results
Age and costs of buildings Streets Contour lines Before 1977 1920/1940 XIXth century XXth century XIXth century, renovated
The state of buildings A very good state / a building that is completely restored or new; A good state / a building that is partially restored or not restored, but with the plaster damaged less than 15%; A bad state / a building that is not restored, with deep fissures and the plaster damaged from 20% to 55%; A very bad state / a building that is not restored, often uninhabited, with broken windows or lacking windows and the plaster damaged over 60%; Ruin
By dividing the number of persons that live in the buildings having a maximum probability of being seriously damaged with the total population number, results an  exposure index of 0.49 , which shows that almost half of the inhabitants of this sector undergo the maximum danger of being injured, losing their lives and/or all their possessions.  Demographic Assessment
was based on the matrix approach between the vulnerability factors of the buildings (resulted from the factorial analysis), their condition and the function of the edifices, on the principle of a differentiated degree of occupancy during the day. The spatial analysis indicates a reduced vulnerability concerning the buildings with financial-banking and cultural functions, built in the inter-war period, many of them being renovated.  Maximum vulnerability levels define the old houses, litigated, many of them being in an advanced state of degradation or even ruins and also defines the inter-war apartment houses, unfunded, with many inhabitants and large commercial spaces at the ground floor.  Vulnerability Assessment Low High
Earthquake Ris k  Assessment (Direct Costs) Risk was computed on the basis of the combination of the vulnerability and the value of the elements at risk (buildings), following a contingency matrix approach.  Very low risk Low risk Medium risk High risk Very high risk Streets Contour lines
Risk to life In a day scenario  In a night scenario High risk : a nr of over 100 people in buildings that can be affected up to 30% or a max. of 50 people in unsafe buildings. Very high risk : a nr of over 50 people in unsafe buildings. Day  Night +5% +13% -16% -2%
Conclusions The flaws of the methodological approach developed consist of a implicit degree of subjectivity and in the possibility of errors to appear because of the numerous classifications needed that rely strongly on the competence of the specialists. The SMCA-method is based on  Vulnerability indices with no direct relation with the different hazard intensities The informational system created can be considered an adequate instrument to evaluate vulnerability and risk, and to fit the needs of a susceptible population based on: - an extended range of applicability;  - the short processing period;  - accessibility; - capacity of support for a large amount of information
Selected References Arion C., Vacareanu R., Lungu D.: (2004),  WP10 - Application to  Bucharest, RISK-UE. An advanced approach to earthquake risk scenarios with applications to different European towns. At  ftp.brgm.fr /pub/Risk-UE . Birkmann, J. (Ed.) (2006), Measuring Vulnerability to Hazards of Natural Origin, Towards Disaster Resilient Society.UNU Press, Tokyo. Global Review of Disaster Reduction Initiatives. (2004 version). United Nations, Geneva, p. 430. Grecu, B., M. Popa, M. Radulian, (2003). Seismic ground motion characteristics in the Bucharest area: Sedimentary cover versus seismic source control,  Romanian Reports in Physics , 55, 511-520. HAZUS – Technical Manual  (1997). Earthquake Loss Estimation Methodology, 3 Vol. Janssen R (2001) On the use of multi-criteria analysis in environmental impact assessment in The Netherlands. J Multi-Criteria Decis Anal 10:101–109 King, D., MacGregor, C., (2000), Using social indicators to measure community vulnerability to natural hazards.  Australian Journal of Emergency Management , 15(3): 52–57. Lungu, D., Aldea, A., Arion, C., Cornea, T., Vãcãreanu, R. (2004),  RISK-UE, WP1: European Distinctive features, inventory database and typology , Proceedings of the International Conference “Earthquake Loss Estimation and Risk Reduction” 24-26, Oct. 2002, Bucuresti, Vol.  2, Romania, pp. 251-272. Mândrescu, N., M. Radulian, (1999). Seismic microzoning of Bucharest (Romania): A critical review”,  Vrancea Earthquakes: Tectonics, Hazard, and Risk Mitigation , Editors: Wenzel, F., Lungu, D., O. Novak, Kluwer Academic Publishers, 109-122. RISK-UE,  An advanced approach to earthquake risk scenarios with applications to different European towns , Fifth Framework Programme of the European Commission, 2000-2004. Saaty TL (1980) The analytic hierarchy process. McGraw-Hill International Book Company, New York UN/ISDR (United Nations International Strategy for Disaster Reduction) (2004), Living with Risk. A Global Review of Disaster Reduction Initiatives. 2004 version. United Nations, Geneva, p. 430. .  UNEP (2002), Global Environment Outlook 3 – Past, Present and Future Perspectives.Earthscan Publications Ltd, London, United Kingdom, p. 426. Yeh C, Willis R, Deng H, Pan H (1999) Task oriented weighting in multi-criteria analysis. Eur J Oper Res. 119:130–146. Zaharia, B., M. Radulian, M. Popa, B. Grecu, A. Bǎlǎ and D. Tǎtaru, (2008). Estimation of the local response using Nakamura method for Bucharest area,  Romanian Reports in Physics , 60, 1, 131-144.

Research Project: Multihazard and vulnerability in the seismic context of the Bucharest Municipality

  • 1.
    Director: Prof. dr.Iuliana ARMAS, University of Bucharest Research Project: Multihazard and vulnerability in the seismic context of the Bucharest Municipality COST Action TU0801: Semantic Enrichment of 3D city models for sustainable urban development Acronym: HERA (HAZARD, EXPOSURE, RISK, ADAPTABILITY)
  • 2.
    Research Partners Facultyof Geography, Risk Research Center- University of Bucharest, prof. dr. Iuliana Armas (Coord.) Faculty of Cybernetics - Academy for Economic Studies , prof. dr. Marian Dardala National Institute for Earth Physics , dr. Mircea Radulian Faculty of Civil, Industrial and Agricultural Constructions - Technical University of Constructions in Bucharest, prof. dr. Al. Aldea
  • 3.
    OBJECTIVE of PHASE2009 URBAN VULNERABILITY ASSESSMENT TO SEISMIC HAZARD THROUGH SPATIAL MULTI-CRITERIA ANALYSIS.   Overall Vulnerability = Total Vulnerability/Capacity where: the total vulnerability of the analysed urban space was considered as a function between the seismic susceptibility of the natural system and the susceptibility of the socio-human system to be affected by a seismic hazard ; the capacity of the urban system to adapt and cope with disasters, was considered in the estimation of the overall vulnerability. The output map was classified in qualitative classes, comparing the histogram from the overall vulnerability.
  • 4.
    Complex vulnerability isthe central predictive variable in the risk equation. A half-century of experience in the natural risk field shows that the only effective way to diminish the natural risk is by reducing the vulnerability of natural and socio-economic systems. Although multiple definitions and different conceptual vulnerability frameworks have been proposed, it is still difficult to quantitatively estimate physical and social vulnerability. After a general evaluation through the SMCA method of the overall vulnerability of Bucharest city, a focused research on the most vulnerable area of the historic center was done with the development of a soft to filter, analyze and visualize the results.
  • 5.
    Conceptual Background MethodologicalFramework The following terminology background outlines vulnerability and capacity Vulnerability “ The conditions determined by physical, social, economic and environmental factors or processes, which increase the susceptibility of a community to the impact of hazards.” (UN/ISDR, 2004) Capacity “ A combination of all the strengths and resources available within a community (...) that can reduce the level of risk or the effects of a disaster. “ (UN/ISDR, 2004)
  • 6.
    Study area Bucharest,the capital of Romania, is a populous city (1.9 mil.inhabitants – INSSE. 2009* ) located in the alluvial Romanian Plain . The total urbanized area is 228 km 2 The dwellings are part of 32 residential areas divided up into 6 sectors. Combining the natural and urban attributes, with the seismic hazard induced by Vrancea source, Bucharest has been ranked as the 10 th capital city worldwide in the terms of seismic risk. * National Institute of Statistics – ROMANIA
  • 7.
  • 8.
    Met h odology The first step was to determine human vulnerability with the use of census data of population and housing, dated 2002 (Cutter et al. 2003; Dwyer et al. 2004). The scale of analysis was considered at the level of census units (2002).
  • 9.
    The next stepconsisted in database processing through a series of structure exploration techniques based on the cluster analysis and factorial reduction procedures. Both techniques revealed the “coagulation” of variables in factors. During the subsequent processing, the scores of the variables in which the selected factors are saturated were aggregated and applied in a standard Spatial Multi-Criteria Analysis (SMCA). Complex social vulnerability factor (SVF) resulted from the factorial reduction procedure (PCA, Varimax)
  • 10.
    The vulnerability ofthe housing quality (HQ) was calculated based on the formula: HQ = (N r.a. + N p.a. + N o5 ) – ( N o + N d ) The higher the value of this composite factor, the lower becomes the vulnerability of the area.
  • 11.
    The vulnerability ofthe economic level (EL) was calculated based on the formula: EL = (N u + N l ) – (N h.m. + N h.w. )
  • 12.
    the assessment wasdone based on the RADIUS methodology, in which Peak Ground Acceleration was calculated for 11 earthquake scenarios (the vulnerability hazard map compiling the average of the PGA values), and the amplification of soil was treated by simple multiplication values with the use of the 1:200000 Romanian geological map. Nevertheless, this method gives only a very general approximation of the hazard. Environmental Vulnerability
  • 13.
    focused on 4groups of vulnerability indexes, selected according to the available data, the statistical results and the expert’s opinion: social vulnerability (aggregated social factor, elderly population, ratio of female population in total population, ratio of widowed persons, housing density), economic vulnerability (aggregated economic factor and housing quality), physical vulnerability (the assessment of the buildings) and environmental vulnerability (susceptibility to the seismic hazards). In addition, the coping and resilience capacity was estimated based on a Distance analysis to the hospitals, fire stations and police stations and, also, based on the literacy rate index . The (spatial) Multi-Criteria Analysis (SMCA)
  • 14.
  • 15.
    Following the MCAstandardization (goal and maximum standardization) was the estimation of the weights among groups of factors using pairwise comparison and ranking methods (Saaty, 1980; Janssen, 2001). In the process, weights were multiplied with the standardised values and intermediate criteria maps were generated and combined using decision rules, for a better definition of the weights. As a result, the total vulnerability index map was obtained by adding up the performance of all cell values of the human and environmental vulnerability criteria for the particular alternative. The (spatial) Multi-Criteria Analysis (SMCA)
  • 16.
  • 17.
  • 18.
    Building-stock Vulnerability Structure Average height Vu Average density
  • 19.
    The total vulnerabilityindex map for Bucharest city resulted from the previous spatial composite indicators: social, economic and building stock vulnerability criteria , for describing the human vulnerability, and by adding the environmental vulnerability into the spatial multicriterial analysis . Green city areas and barren grounds were, also, included as spatial constraints .
  • 20.
    In order tomeasure the level of capacity that would help reduce the overall vulnerability, two indicators were used: preparedness level (expressed through distance to hospitals, fire stations and police stations) and awareness level (based on the literacy rate). The best position is for the city central and pericentral areas (with very good accessibility to the emergency centers and scoring the highest values of the literacy rate). Capacity
  • 21.
    The overall vulnerability index map for Bucharest city it was calculated by dividing the total human vulnerability values to the capacity composite factor. the configuration reveals a radial spatial pattern with values increasing from the central to the marginal areas. The historic city center scores high based on the building stock vulnerability criteria and the environmental vulnerability level to the seismic hazard. F requently, brick buildings are in poor repair, and many of them are in total ruin today. A population of modest means now inhabits these buildings. Most of the buildings are included in categories of the greatest seismic vulnerability, and were built between 1875 and 1940.
  • 22.
  • 23.
  • 24.
  • 25.
  • 26.
  • 27.
  • 28.
  • 29.
  • 30.
  • 31.
    Building materials of residential houses Ownership of households Results
  • 32.
    Age and costsof buildings Streets Contour lines Before 1977 1920/1940 XIXth century XXth century XIXth century, renovated
  • 33.
    The state ofbuildings A very good state / a building that is completely restored or new; A good state / a building that is partially restored or not restored, but with the plaster damaged less than 15%; A bad state / a building that is not restored, with deep fissures and the plaster damaged from 20% to 55%; A very bad state / a building that is not restored, often uninhabited, with broken windows or lacking windows and the plaster damaged over 60%; Ruin
  • 34.
    By dividing thenumber of persons that live in the buildings having a maximum probability of being seriously damaged with the total population number, results an exposure index of 0.49 , which shows that almost half of the inhabitants of this sector undergo the maximum danger of being injured, losing their lives and/or all their possessions. Demographic Assessment
  • 35.
    was based onthe matrix approach between the vulnerability factors of the buildings (resulted from the factorial analysis), their condition and the function of the edifices, on the principle of a differentiated degree of occupancy during the day. The spatial analysis indicates a reduced vulnerability concerning the buildings with financial-banking and cultural functions, built in the inter-war period, many of them being renovated. Maximum vulnerability levels define the old houses, litigated, many of them being in an advanced state of degradation or even ruins and also defines the inter-war apartment houses, unfunded, with many inhabitants and large commercial spaces at the ground floor. Vulnerability Assessment Low High
  • 36.
    Earthquake Ris k Assessment (Direct Costs) Risk was computed on the basis of the combination of the vulnerability and the value of the elements at risk (buildings), following a contingency matrix approach. Very low risk Low risk Medium risk High risk Very high risk Streets Contour lines
  • 37.
    Risk to lifeIn a day scenario In a night scenario High risk : a nr of over 100 people in buildings that can be affected up to 30% or a max. of 50 people in unsafe buildings. Very high risk : a nr of over 50 people in unsafe buildings. Day Night +5% +13% -16% -2%
  • 38.
    Conclusions The flawsof the methodological approach developed consist of a implicit degree of subjectivity and in the possibility of errors to appear because of the numerous classifications needed that rely strongly on the competence of the specialists. The SMCA-method is based on Vulnerability indices with no direct relation with the different hazard intensities The informational system created can be considered an adequate instrument to evaluate vulnerability and risk, and to fit the needs of a susceptible population based on: - an extended range of applicability; - the short processing period; - accessibility; - capacity of support for a large amount of information
  • 39.
    Selected References ArionC., Vacareanu R., Lungu D.: (2004), WP10 - Application to Bucharest, RISK-UE. An advanced approach to earthquake risk scenarios with applications to different European towns. At ftp.brgm.fr /pub/Risk-UE . Birkmann, J. (Ed.) (2006), Measuring Vulnerability to Hazards of Natural Origin, Towards Disaster Resilient Society.UNU Press, Tokyo. Global Review of Disaster Reduction Initiatives. (2004 version). United Nations, Geneva, p. 430. Grecu, B., M. Popa, M. Radulian, (2003). Seismic ground motion characteristics in the Bucharest area: Sedimentary cover versus seismic source control, Romanian Reports in Physics , 55, 511-520. HAZUS – Technical Manual (1997). Earthquake Loss Estimation Methodology, 3 Vol. Janssen R (2001) On the use of multi-criteria analysis in environmental impact assessment in The Netherlands. J Multi-Criteria Decis Anal 10:101–109 King, D., MacGregor, C., (2000), Using social indicators to measure community vulnerability to natural hazards. Australian Journal of Emergency Management , 15(3): 52–57. Lungu, D., Aldea, A., Arion, C., Cornea, T., Vãcãreanu, R. (2004), RISK-UE, WP1: European Distinctive features, inventory database and typology , Proceedings of the International Conference “Earthquake Loss Estimation and Risk Reduction” 24-26, Oct. 2002, Bucuresti, Vol. 2, Romania, pp. 251-272. Mândrescu, N., M. Radulian, (1999). Seismic microzoning of Bucharest (Romania): A critical review”, Vrancea Earthquakes: Tectonics, Hazard, and Risk Mitigation , Editors: Wenzel, F., Lungu, D., O. Novak, Kluwer Academic Publishers, 109-122. RISK-UE, An advanced approach to earthquake risk scenarios with applications to different European towns , Fifth Framework Programme of the European Commission, 2000-2004. Saaty TL (1980) The analytic hierarchy process. McGraw-Hill International Book Company, New York UN/ISDR (United Nations International Strategy for Disaster Reduction) (2004), Living with Risk. A Global Review of Disaster Reduction Initiatives. 2004 version. United Nations, Geneva, p. 430. . UNEP (2002), Global Environment Outlook 3 – Past, Present and Future Perspectives.Earthscan Publications Ltd, London, United Kingdom, p. 426. Yeh C, Willis R, Deng H, Pan H (1999) Task oriented weighting in multi-criteria analysis. Eur J Oper Res. 119:130–146. Zaharia, B., M. Radulian, M. Popa, B. Grecu, A. Bǎlǎ and D. Tǎtaru, (2008). Estimation of the local response using Nakamura method for Bucharest area, Romanian Reports in Physics , 60, 1, 131-144.