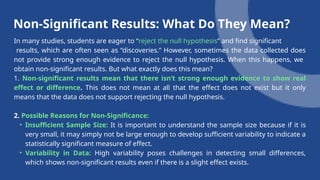
Understanding Null
Hypothesis in
Statistics Homework
STATISTICS HELP DESK
NON-SIGNIFICANT RESULTS?
PHONE: +44-1666260813 WEBSITE: www.statisticshelpdesk.com
Introduction
In the context of statistics, learners and researchers encounter “non-significant results”
which can feel frustrating. What does it actually mean by non-significant results, and how
do they relate to null hypothesis? As we all know, the null hypothesis is an essential
concept in statistics and is usually denoted by H0. This concept can be a bit tricky
particularly to students, especially if it is their first time. Often, researchers can be at a loss
as to how to proceed when encountering non-significant results, so this ppt includes a
handy guide to understand the meaning, the purpose of the null hypothesis, as well as
how it should be interpreted.
What is the Null Hypothesis?
H₀ represents a state in which there is no effect and no difference within a given
situation. For example, in research that seeks to establish if a newly developed medicine
impacts blood pressure, the null hypothesis might be “the drug has no effect on
pressure.” The null hypothesis also known as H0 is just a starting or base hypothesis
against which you test the data. If your data gives adequate evidence to reject the null
hypothesis, you will be in a position to say that the effect or the difference is most
probably present.
The null hypothesis provides a structured approach to evaluating claims. When testing
the null hypothesis researchers collect empirical evidence that either supports or rejects
its validity. It must always be borne in mind that rejecting or failing to reject the null
hypothesis does not give a definitive verdict. what it does give is whether the data
accumulated provides sufficient evidence to lean in one direction.
Non-Significant Results: What Do They Mean?
In many studies, students are eager to “reject the null hypothesis” and find significant
results, which are often seen as “discoveries.” However, sometimes the data collected does
not provide strong enough evidence to reject the null hypothesis. When this happens, we
obtain non-significant results. But what exactly does this mean?
1. Non-significant results mean that there isn’t strong enough evidence to show real
effect or difference. This does not mean at all that the effect does not exist but it only
means that the data does not support rejecting the null hypothesis.
2. Possible Reasons for Non-Significance:
• Insufficient Sample Size: It is important to understand the sample size because if it is
very small, it may simply not be large enough to develop sufficient variability to indicate a
statistically significant measure of effect.
• Variability in Data: High variability poses challenges in detecting small differences,
which shows non-significant results even if there is a slight effect exists.
Non-Significant Results: What Do They Mean?
• Effect Truly Doesn't Exist: Sometimes, the null hypothesis might be valid meaning
indeed there is no effect or difference resulting in non-significant results.
3. Misconceptions Around Non-Significance:
Students may treat non-significant findings as failures but in fact, they are useful set of
information. Non-significant results imply that further investigation is needed with refined
methods and collection of large sample size.
P-Value and Its Role in Interpreting
Non-Significant Results
A very important component in deciding on the level of significance is a p-value that
stands for the probability of observing the data and something more or less assuming
the null hypothesis is true. Usually, the p-value is defined with a threshold, that is 0.05%,
meaning if the p-value is below this value, the results are significant and we can reject a
null hypothesis. However, it’s important not to overinterpret the p-value:
• A p-value above 0.05 doesn’t prove the null hypothesis is true; it simply suggests
insufficient evidence to reject it.
• Statistical significance is not synonymous with practical importance. A small effect
might be meaningfully significant with a large sample size but in reality, can be little
important.
Practical Steps for Students Facing
Non-Significant Results
1. Consider Sample Size and Power: A small sample size is one of the reasons for non-
significant results. With statistical power analysis, you can determine whether your
sample size was appropriate or not.
2. Re-evaluate Data Collection and Measurement Methods: Non- significant results
may also indicate that there are some methodological flaws. Data should be collected
correctly and accurately. Data collection methods should be appropriate with respect to
the hypothesis being tested.
3. Explore Possible Confounding Variables: confounding variables can impact the
variables of interest. By carefully managing these confounding variables, error can be
minimized for obtaining significant results.
Practical Steps for Students Facing
Non-Significant Results (contd.)
4. Use Effect Sizes in Analysis: Effect size provides valuable information about the
magnitude of the observed effect, even if the results are non-significant. It can tell if
further investigation should be done on a larger sample size.
5. Replicate and Review: On some occasions, non-significant findings suggest
conducting a follow up study involving another sample or the application of improved
techniques. Results from this replicated study confirms whether the non-significant
results were due to random chance, measurement error, or absence of the effect.
Statistics Homework
Help Service!
why you
need it?
Statistics can be tricky for beginners, particularly understanding null
hypothesis testing or interpreting non-significant results. Our
statistics homework help service can provide step by step solution
to your statistics assignment and extend professional expert
assistance to teach you’re the nuances and fundamental principles
of statistics. To make a long story short, with our help, you can solve
complicated tasks, gain an understanding of how statistical results
should be interpreted, and stay ahead in your coursework. Our best
features include:
·24/7 Availability: Access help anytime, no matter the deadline or time zone.
·Customized Support: Solutions are tailored to your specific assignment needs.
·Expert Tutors: Work with seasoned statisticians who simplify complex concepts.
Final Thoughts
Non-significant results are ordinary but meaningful information in statistics. They
describe the data, the method used and paves way to future research. This is why, when
you are doing your homework, you should be prepared to accept non-significant results
as part of the scientific process and in many cases as important as significant outcomes.
Accepting these outcomes contributes to better understanding of statistical data and
analysis. For more deeper analysis and understanding you may consider seeking help
from statistics homework help expert along with referring to the textbooks mentioned in
the next slide.
Additional Resources
For Understanding Null Hypothesis and Non-Significant Results
“Statistics for the
Behavioral
Sciences” by
Frederick J.
Gravetter and
Larry B. Wallnau
01
“Research
Methods in
Psychology” by
Beth Morling
02
“The Essentials of
Biostatistics for
Physicians,
Nurses, and
Clinicians” by
Michael R.
Chernick
03
“Statistical
Methods for
Psychology” by
David C. Howell
04
Understanding the nuances of null hypothesis testing and non-significant results can be challenging, so
here are some textbooks and resources to guide your studies:
Thank
You.
STATISTICS HELP DESK
WHATSAPP: +44-1666260813 WEBSITE: www.statisticshelpdesk.com
EMAIL: homework@statisticshelpdesk.com

Understanding Null Hypothesis in Statistics Homework

  • 1.
    Understanding Null Hypothesis in StatisticsHomework STATISTICS HELP DESK NON-SIGNIFICANT RESULTS? PHONE: +44-1666260813 WEBSITE: www.statisticshelpdesk.com
  • 2.
    Introduction In the contextof statistics, learners and researchers encounter “non-significant results” which can feel frustrating. What does it actually mean by non-significant results, and how do they relate to null hypothesis? As we all know, the null hypothesis is an essential concept in statistics and is usually denoted by H0. This concept can be a bit tricky particularly to students, especially if it is their first time. Often, researchers can be at a loss as to how to proceed when encountering non-significant results, so this ppt includes a handy guide to understand the meaning, the purpose of the null hypothesis, as well as how it should be interpreted.
  • 3.
    What is theNull Hypothesis? H₀ represents a state in which there is no effect and no difference within a given situation. For example, in research that seeks to establish if a newly developed medicine impacts blood pressure, the null hypothesis might be “the drug has no effect on pressure.” The null hypothesis also known as H0 is just a starting or base hypothesis against which you test the data. If your data gives adequate evidence to reject the null hypothesis, you will be in a position to say that the effect or the difference is most probably present. The null hypothesis provides a structured approach to evaluating claims. When testing the null hypothesis researchers collect empirical evidence that either supports or rejects its validity. It must always be borne in mind that rejecting or failing to reject the null hypothesis does not give a definitive verdict. what it does give is whether the data accumulated provides sufficient evidence to lean in one direction.
  • 4.
    Non-Significant Results: WhatDo They Mean? In many studies, students are eager to “reject the null hypothesis” and find significant results, which are often seen as “discoveries.” However, sometimes the data collected does not provide strong enough evidence to reject the null hypothesis. When this happens, we obtain non-significant results. But what exactly does this mean? 1. Non-significant results mean that there isn’t strong enough evidence to show real effect or difference. This does not mean at all that the effect does not exist but it only means that the data does not support rejecting the null hypothesis. 2. Possible Reasons for Non-Significance: • Insufficient Sample Size: It is important to understand the sample size because if it is very small, it may simply not be large enough to develop sufficient variability to indicate a statistically significant measure of effect. • Variability in Data: High variability poses challenges in detecting small differences, which shows non-significant results even if there is a slight effect exists.
  • 5.
    Non-Significant Results: WhatDo They Mean? • Effect Truly Doesn't Exist: Sometimes, the null hypothesis might be valid meaning indeed there is no effect or difference resulting in non-significant results. 3. Misconceptions Around Non-Significance: Students may treat non-significant findings as failures but in fact, they are useful set of information. Non-significant results imply that further investigation is needed with refined methods and collection of large sample size.
  • 6.
    P-Value and ItsRole in Interpreting Non-Significant Results A very important component in deciding on the level of significance is a p-value that stands for the probability of observing the data and something more or less assuming the null hypothesis is true. Usually, the p-value is defined with a threshold, that is 0.05%, meaning if the p-value is below this value, the results are significant and we can reject a null hypothesis. However, it’s important not to overinterpret the p-value: • A p-value above 0.05 doesn’t prove the null hypothesis is true; it simply suggests insufficient evidence to reject it. • Statistical significance is not synonymous with practical importance. A small effect might be meaningfully significant with a large sample size but in reality, can be little important.
  • 7.
    Practical Steps forStudents Facing Non-Significant Results 1. Consider Sample Size and Power: A small sample size is one of the reasons for non- significant results. With statistical power analysis, you can determine whether your sample size was appropriate or not. 2. Re-evaluate Data Collection and Measurement Methods: Non- significant results may also indicate that there are some methodological flaws. Data should be collected correctly and accurately. Data collection methods should be appropriate with respect to the hypothesis being tested. 3. Explore Possible Confounding Variables: confounding variables can impact the variables of interest. By carefully managing these confounding variables, error can be minimized for obtaining significant results.
  • 8.
    Practical Steps forStudents Facing Non-Significant Results (contd.) 4. Use Effect Sizes in Analysis: Effect size provides valuable information about the magnitude of the observed effect, even if the results are non-significant. It can tell if further investigation should be done on a larger sample size. 5. Replicate and Review: On some occasions, non-significant findings suggest conducting a follow up study involving another sample or the application of improved techniques. Results from this replicated study confirms whether the non-significant results were due to random chance, measurement error, or absence of the effect.
  • 9.
    Statistics Homework Help Service! whyyou need it? Statistics can be tricky for beginners, particularly understanding null hypothesis testing or interpreting non-significant results. Our statistics homework help service can provide step by step solution to your statistics assignment and extend professional expert assistance to teach you’re the nuances and fundamental principles of statistics. To make a long story short, with our help, you can solve complicated tasks, gain an understanding of how statistical results should be interpreted, and stay ahead in your coursework. Our best features include: ·24/7 Availability: Access help anytime, no matter the deadline or time zone. ·Customized Support: Solutions are tailored to your specific assignment needs. ·Expert Tutors: Work with seasoned statisticians who simplify complex concepts.
  • 10.
    Final Thoughts Non-significant resultsare ordinary but meaningful information in statistics. They describe the data, the method used and paves way to future research. This is why, when you are doing your homework, you should be prepared to accept non-significant results as part of the scientific process and in many cases as important as significant outcomes. Accepting these outcomes contributes to better understanding of statistical data and analysis. For more deeper analysis and understanding you may consider seeking help from statistics homework help expert along with referring to the textbooks mentioned in the next slide.
  • 11.
    Additional Resources For UnderstandingNull Hypothesis and Non-Significant Results “Statistics for the Behavioral Sciences” by Frederick J. Gravetter and Larry B. Wallnau 01 “Research Methods in Psychology” by Beth Morling 02 “The Essentials of Biostatistics for Physicians, Nurses, and Clinicians” by Michael R. Chernick 03 “Statistical Methods for Psychology” by David C. Howell 04 Understanding the nuances of null hypothesis testing and non-significant results can be challenging, so here are some textbooks and resources to guide your studies:
  • 12.
    Thank You. STATISTICS HELP DESK WHATSAPP:+44-1666260813 WEBSITE: www.statisticshelpdesk.com EMAIL: homework@statisticshelpdesk.com