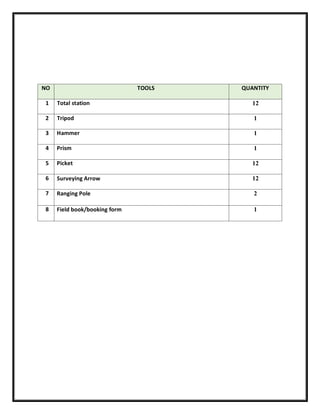
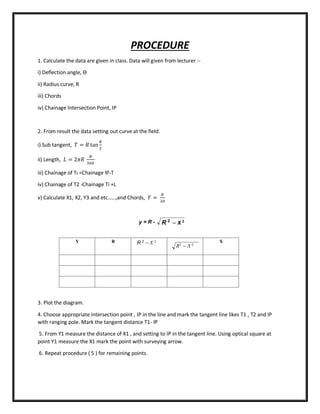
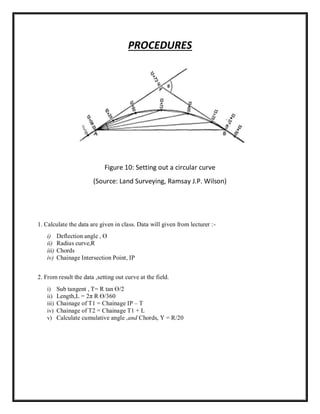
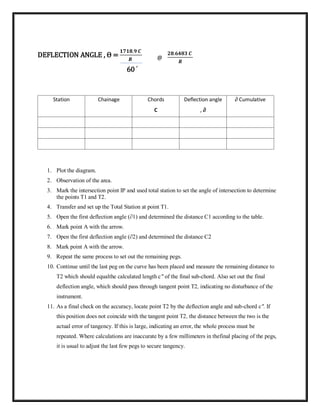
The document is a field work report for a surveying exercise to set out a ranging curve. It includes information on the materials and tools used, two methods for setting out the curve (offset from tangent line and using deflection angles), and results including calculation data and tables of station coordinates, chords, and deflection angles. The objectives were to calculate data for a given curve, set it out in the field using total station, and analyze the results.


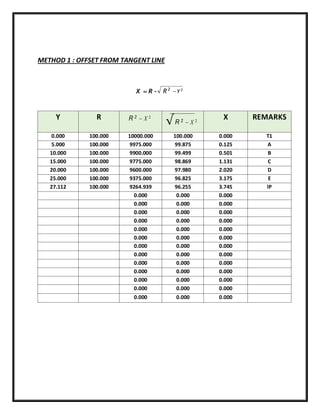
![CALCULATION DATA OFFSET FROM TANGENT LINE
𝜃 = 30°20′20′′
J = 100 m
IP = 100 m
C = 5 m
𝑱𝟐
− 𝒀𝟐
FOR T1
= 𝟏𝟎𝟎. 𝟎𝟎𝟎𝟐
− 𝟎. 𝟎𝟎𝟎𝟐
= 10000.000
𝑱𝟐
− 𝒀𝟐
𝑭𝑶𝑹 𝑨
= 𝟏𝟎𝟎. 𝟎𝟎𝟎𝟐 − 𝟓. 𝟎𝟎𝟎𝟐
= 9975.000
√𝑱𝟐 + 𝒀𝟐 𝑭𝑶𝑹 𝑻𝟏
= √𝟏𝟎𝟎. 𝟎𝟎𝟎𝟐 + 𝟎. 𝟎𝟎𝟎𝟐
= 𝟏𝟎𝟎. 𝟎𝟎𝟎
√𝑱𝟐 + 𝒀𝟐 𝑭𝑶𝑹 𝑨
= √𝟏𝟎𝟎. 𝟎𝟎𝟎𝟐 + 𝟓. 𝟎𝟎𝟎𝟐
= 𝟗𝟗. 𝟖𝟕𝟓
𝑿 = 𝑱 − √𝑱𝟐 + 𝒀𝟐 𝑭𝑶𝑹 𝑻𝟏
= 𝟏𝟎𝟎. 𝟎𝟎𝟎 − 𝟏𝟎𝟎. 𝟎𝟎𝟎
= 𝟎. 𝟎𝟎𝟎
𝑿 = 𝑱 − √𝑱𝟐 + 𝒀𝟐 𝑭𝑶𝑹 𝑨
= 𝟏𝟎𝟎. 𝟎𝟎𝟎 − 𝟗𝟗. 𝟖𝟕𝟓
= 𝟎. 𝟏𝟐𝟓
𝑱𝑻 = 𝟏𝟎𝟎 𝒕𝒂𝒏
[𝟑𝟎°𝟐𝟎′𝟐𝟎′′]
𝟐
= 27.112 m
𝑳 = 𝟐 𝝅 (𝟏𝟎𝟎)[
𝟑𝟎°𝟐𝟎′
𝟐𝟎′′
𝟑𝟔𝟎°
]
= 𝟓𝟐. 𝟗𝟓 𝐦
𝑪 = 𝟐(𝟏𝟎𝟎) 𝒔𝒊𝒏 [
𝟑𝟎°𝟐𝟎′
𝟐𝟎′′
𝟐
]
= 𝟓𝟐. 𝟑𝟑 𝐦
T1 = 100 – 27.112
= 72.888 m
T2 = 72.888 + 52.95
= 125.839 m](https://image.slidesharecdn.com/reportsurveyrangingcurvecivilengineering-221209124307-4bef6a39/85/REPORT-SURVEY-RANGING-CURVE-CIVIL-ENGINEERING-pdf-13-320.jpg)
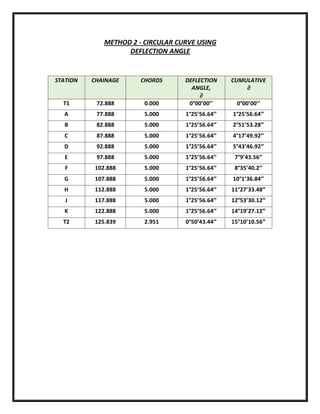
![CALCULATION DATA CIRCULAR CURVE USING DEFLECTION ANGLE
𝜃 = 30°20′20′′
J = 100 m
IP = 100 m
C = 5 m
𝑰𝑷 𝑭𝑶𝑹 𝑨 = 𝟕𝟐. 𝟖𝟖𝟖 + 𝟓 = 𝟕𝟕. 𝟖𝟖𝟖
𝑰𝑷 𝑭𝑶𝑹 𝑩 = 𝟕𝟕. 𝟖𝟖𝟖 + 𝟓 = 𝟖𝟐. 𝟖𝟖𝟖
𝑫𝑬𝑭𝑳𝑬𝑪𝑻 𝑨𝑵𝑮𝑳𝑬, 𝜽 (𝑭𝑶𝑹 𝑨) → 𝟐𝟖.𝟔𝟒𝟖𝟑
𝑪
𝑹
= 𝟐𝟖.𝟔𝟒𝟖𝟑
(𝟓)
𝟏𝟎𝟎
= 𝟏°𝟐𝟓′
𝟓𝟔.𝟕𝟎′′
𝑫𝑬𝑭𝑳𝑬𝑪𝑻 𝑨𝑵𝑮𝑳𝑬, 𝜽 (𝑭𝑶𝑹 𝑻𝟐) → 𝟐𝟖.𝟔𝟒𝟖𝟑
𝑪
𝑹
= 𝟐𝟖.𝟔𝟒𝟖𝟑
(𝟐.𝟗𝟓𝟏)
𝟏𝟎𝟎
= 𝟎°𝟓𝟎′
𝟒𝟑.𝟒𝟖′′
𝑪𝑼𝑴𝑼𝑳𝑨𝑻𝑰𝑽𝑬 𝑨𝑵𝑮𝑳𝑬, 𝜽 (𝑭𝑶𝑹 𝑩)
= 𝟏. 𝟒𝟑𝟐𝟒 + 𝟏. 𝟒𝟑𝟐𝟒
= 𝟐. 𝟖𝟔𝟒𝟖
𝑪𝑼𝑴𝑼𝑳𝑨𝑻𝑰𝑽𝑬 𝑨𝑵𝑮𝑳𝑬, 𝜽 (𝑭𝑶𝑹 𝑪)
= 𝟐. 𝟖𝟔𝟒𝟖 + 𝟏. 𝟒𝟑𝟐𝟒
= 𝟒. 𝟐𝟗𝟕𝟐
𝑪𝑼𝑴𝑼𝑳𝑨𝑻𝑰𝑽𝑬 𝑨𝑵𝑮𝑳𝑬, 𝜽 (𝑭𝑶𝑹 𝑫)
= 𝟒. 𝟐𝟗𝟕𝟐 + 𝟏. 𝟒𝟑𝟐𝟒
= 𝟓. 𝟕𝟐𝟗𝟕
𝑱𝑻 = 𝟏𝟎𝟎 𝒕𝒂𝒏
[𝟑𝟎°𝟐𝟎′𝟐𝟎′′]
𝟐
= 27.112 m
𝑳 = 𝟐 𝝅 (𝟏𝟎𝟎)[
𝟑𝟎°𝟐𝟎′
𝟐𝟎′′
𝟑𝟔𝟎°
]
= 𝟓𝟐. 𝟗𝟓 𝐦
𝑪 = 𝟐(𝟏𝟎𝟎) 𝒔𝒊𝒏 [
𝟑𝟎°𝟐𝟎′
𝟐𝟎′′
𝟐
]
= 𝟓𝟐. 𝟑𝟑 𝐦
T1 = 100 – 27.112
= 72.888 m
T2 = 72.888 + 52.95
= 125.839 m](https://image.slidesharecdn.com/reportsurveyrangingcurvecivilengineering-221209124307-4bef6a39/85/REPORT-SURVEY-RANGING-CURVE-CIVIL-ENGINEERING-pdf-14-320.jpg)