Downloaded 201 times
![PURPOSE:
To determine the alkalinity of a water sample using a double – endpoint titration for
-
determination of [OH ] and [CO3 2-].
INTRODUCTION:
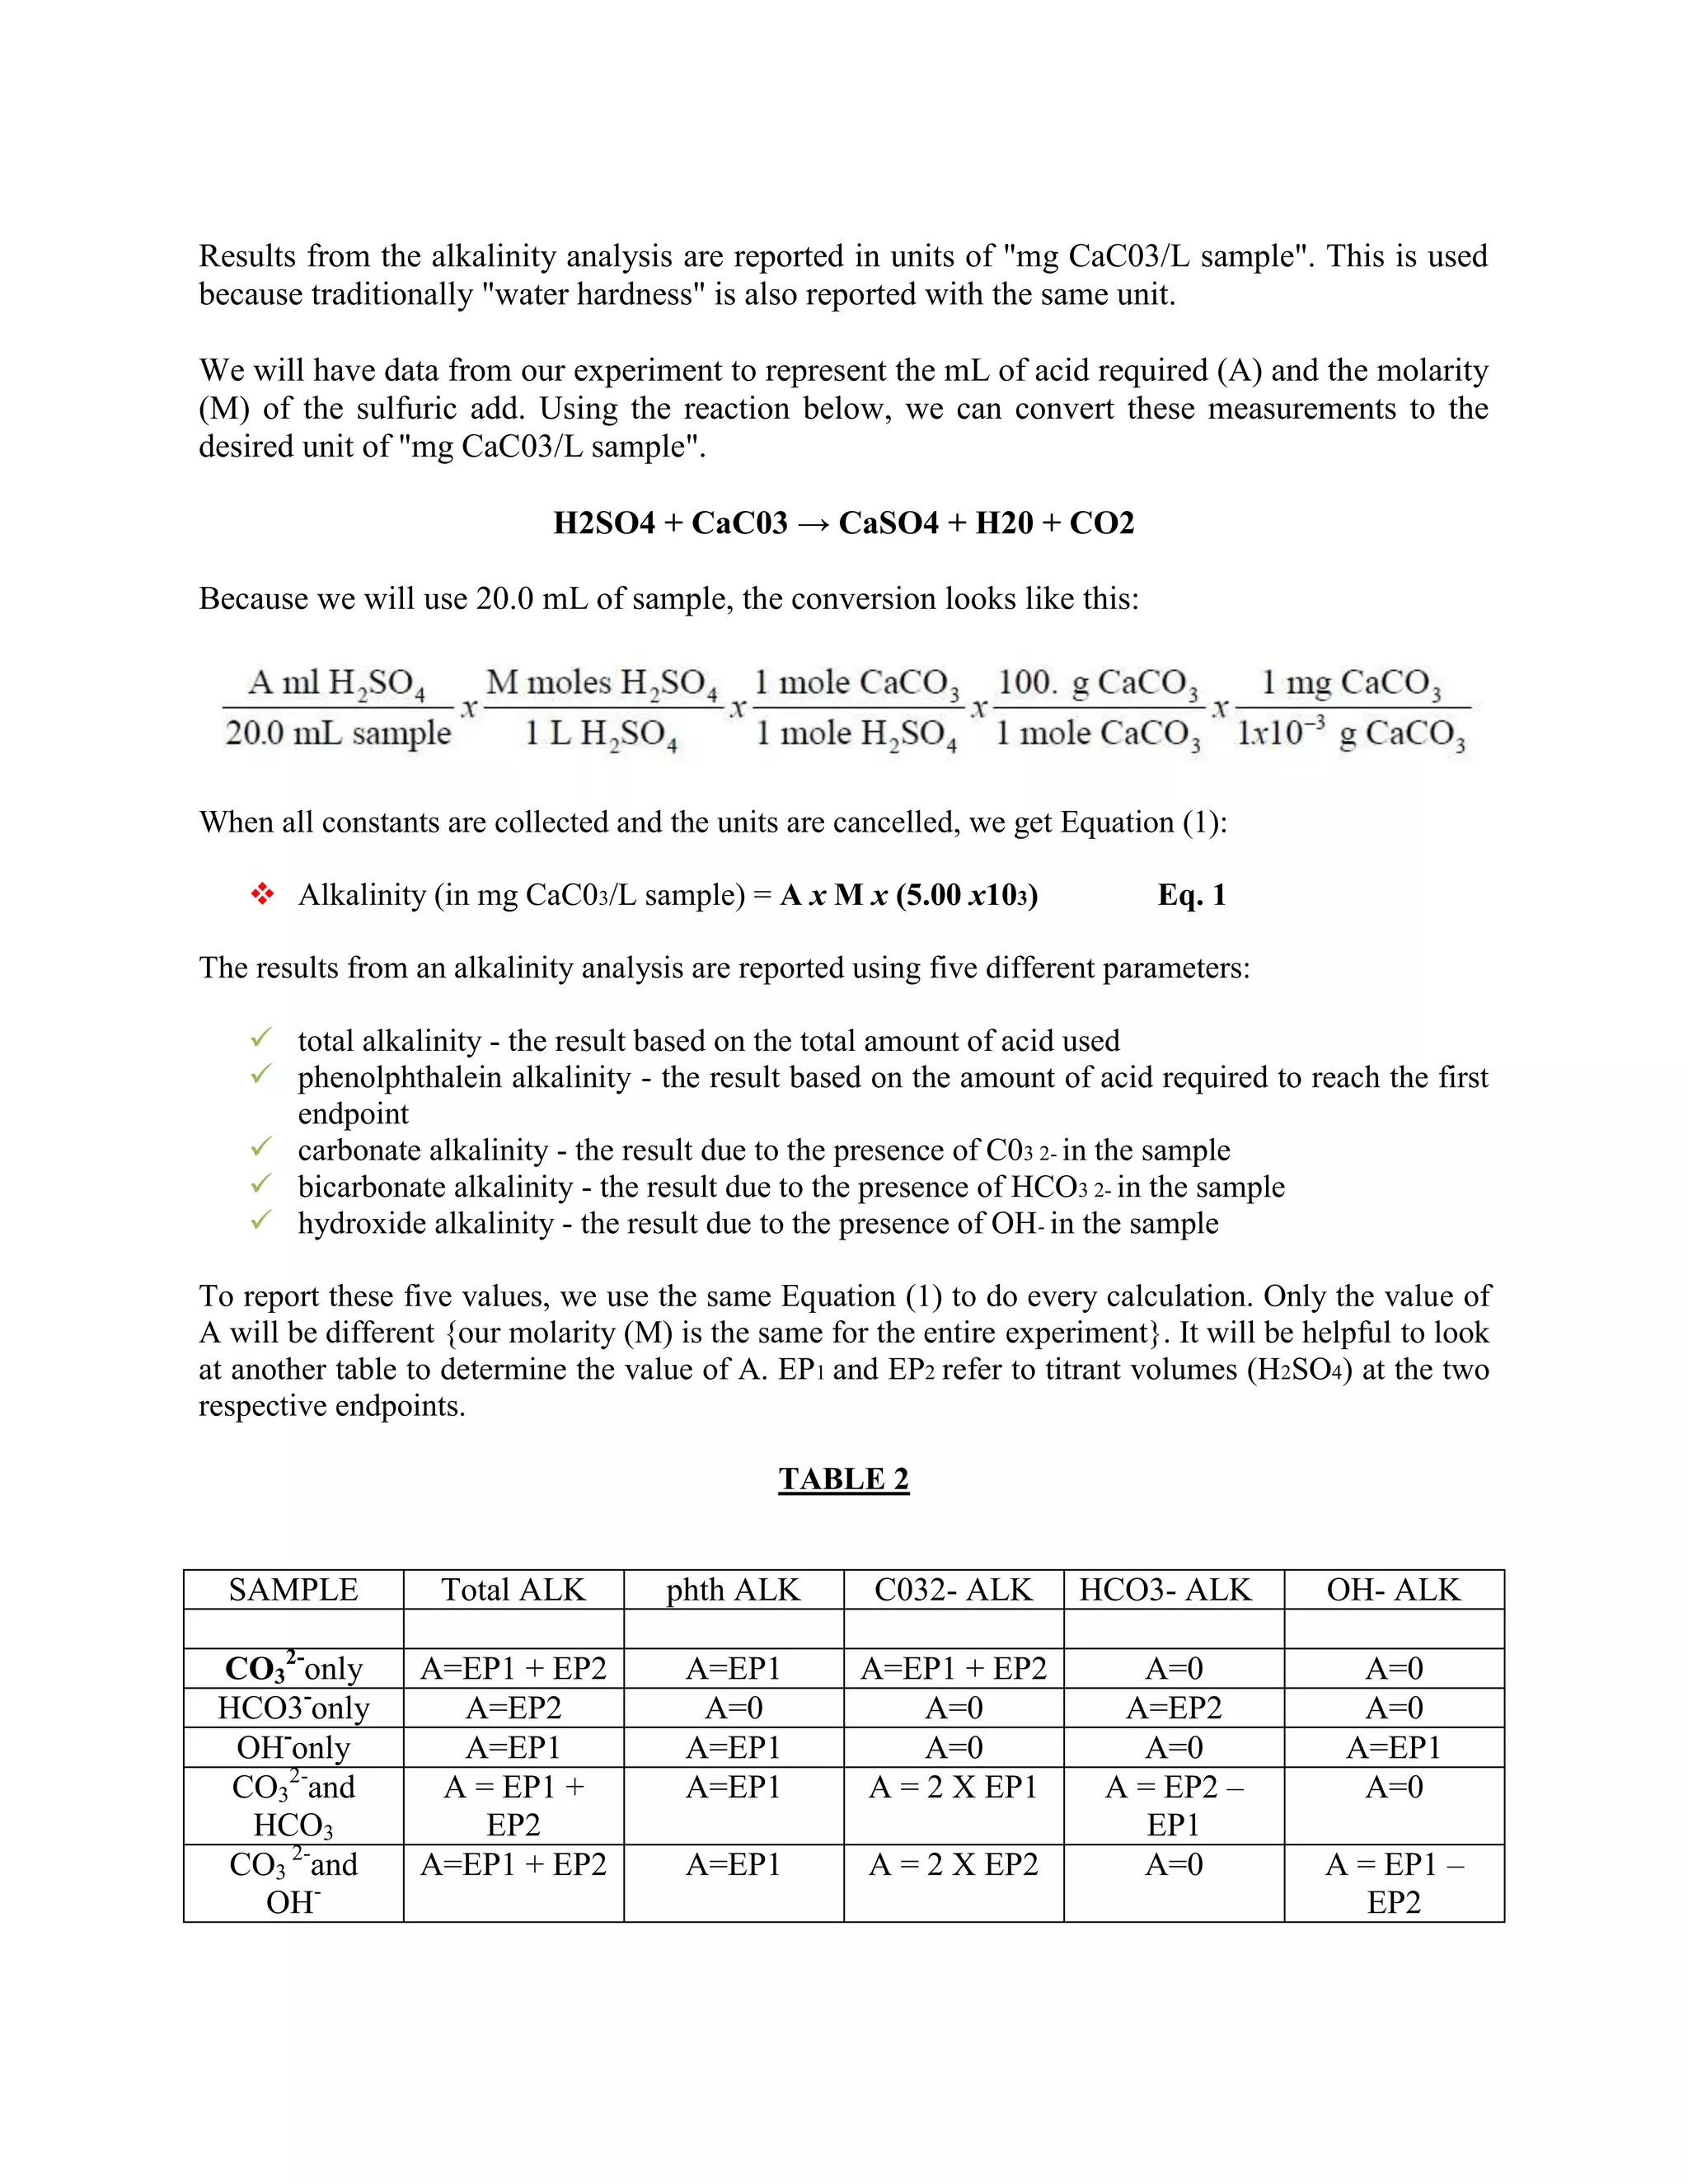
Alkalinity is a parameter that is measured on almost all environmental samples -drinking
water,natural waters, polluted waters, sewage, and industrial wastes. Alkalinity refers to the
buffering capacity of water samples and to their ability to neutralize acidic pollution from rainfall
or wastewater. For municipal sewage or industrial wastes, the amount of alkalinity is important
in determining the type of treatment which should be employed.
Alkalinity is primarily caused by the presence of carbonate (C03 2-) and bicarbonate (HC03-)
ions, although hydroxide (OH-) ions may also contribute, especially when there is industrial
pollution. Living organisms, such as aquatic life, function best in a pH range of 5.0 to 9.0 and
levels of 20 to 200 mg/L are typical alkalinity values for fresh water. When the pH is above 8.3,
carbonate (CO3 2-) is the primary contributor to alkalinity; when the pH is below 8.3,
bicarbonate (HCO3 -) becomes the dominating factor. The values of alkalinity are reported in
units of "mg CaCO3/L" because of its relationship to hardness, which is reported using the same
unit.
Although large environmental labs perform alkalinity tests using automated methods (1
sample/minute), we will employ the traditional analyses of using an acid-base titration with two
endpoints. To gain insight into the double-endpoint titration technique you will perform a
potentiometric titration, pH vs. titrant volume of your water sample. These techniques are
described in more detail below.
The alkalinity analysis consists of:
A. Preparation and Standardization of a Titrant.
B. Titration of a prepared unknown using the standardized titrant.
C. Titration of a natural water sample (well, river or lake water) using the standardized
titrant.
DETERMINATION OF ALKALINITY
A sample may contain any of the three anions (carbonate, bicarbonate, or hydroxide) or some
combinations of them. Because these can all behave as bases, we will titrate with a strong acid.
Hydrochloric acid (HCL) can be used, but we will be using sulfuric acid (H2S04). Regardless of
the source of the H+ the following reactions will occur:
(1st endpoint) H+ + CO3 2- → HCO3 –](https://image.slidesharecdn.com/reportonalkalinitytestazlan-121124080329-phpapp02/75/Report-on-alkalinity-test-1-2048.jpg)

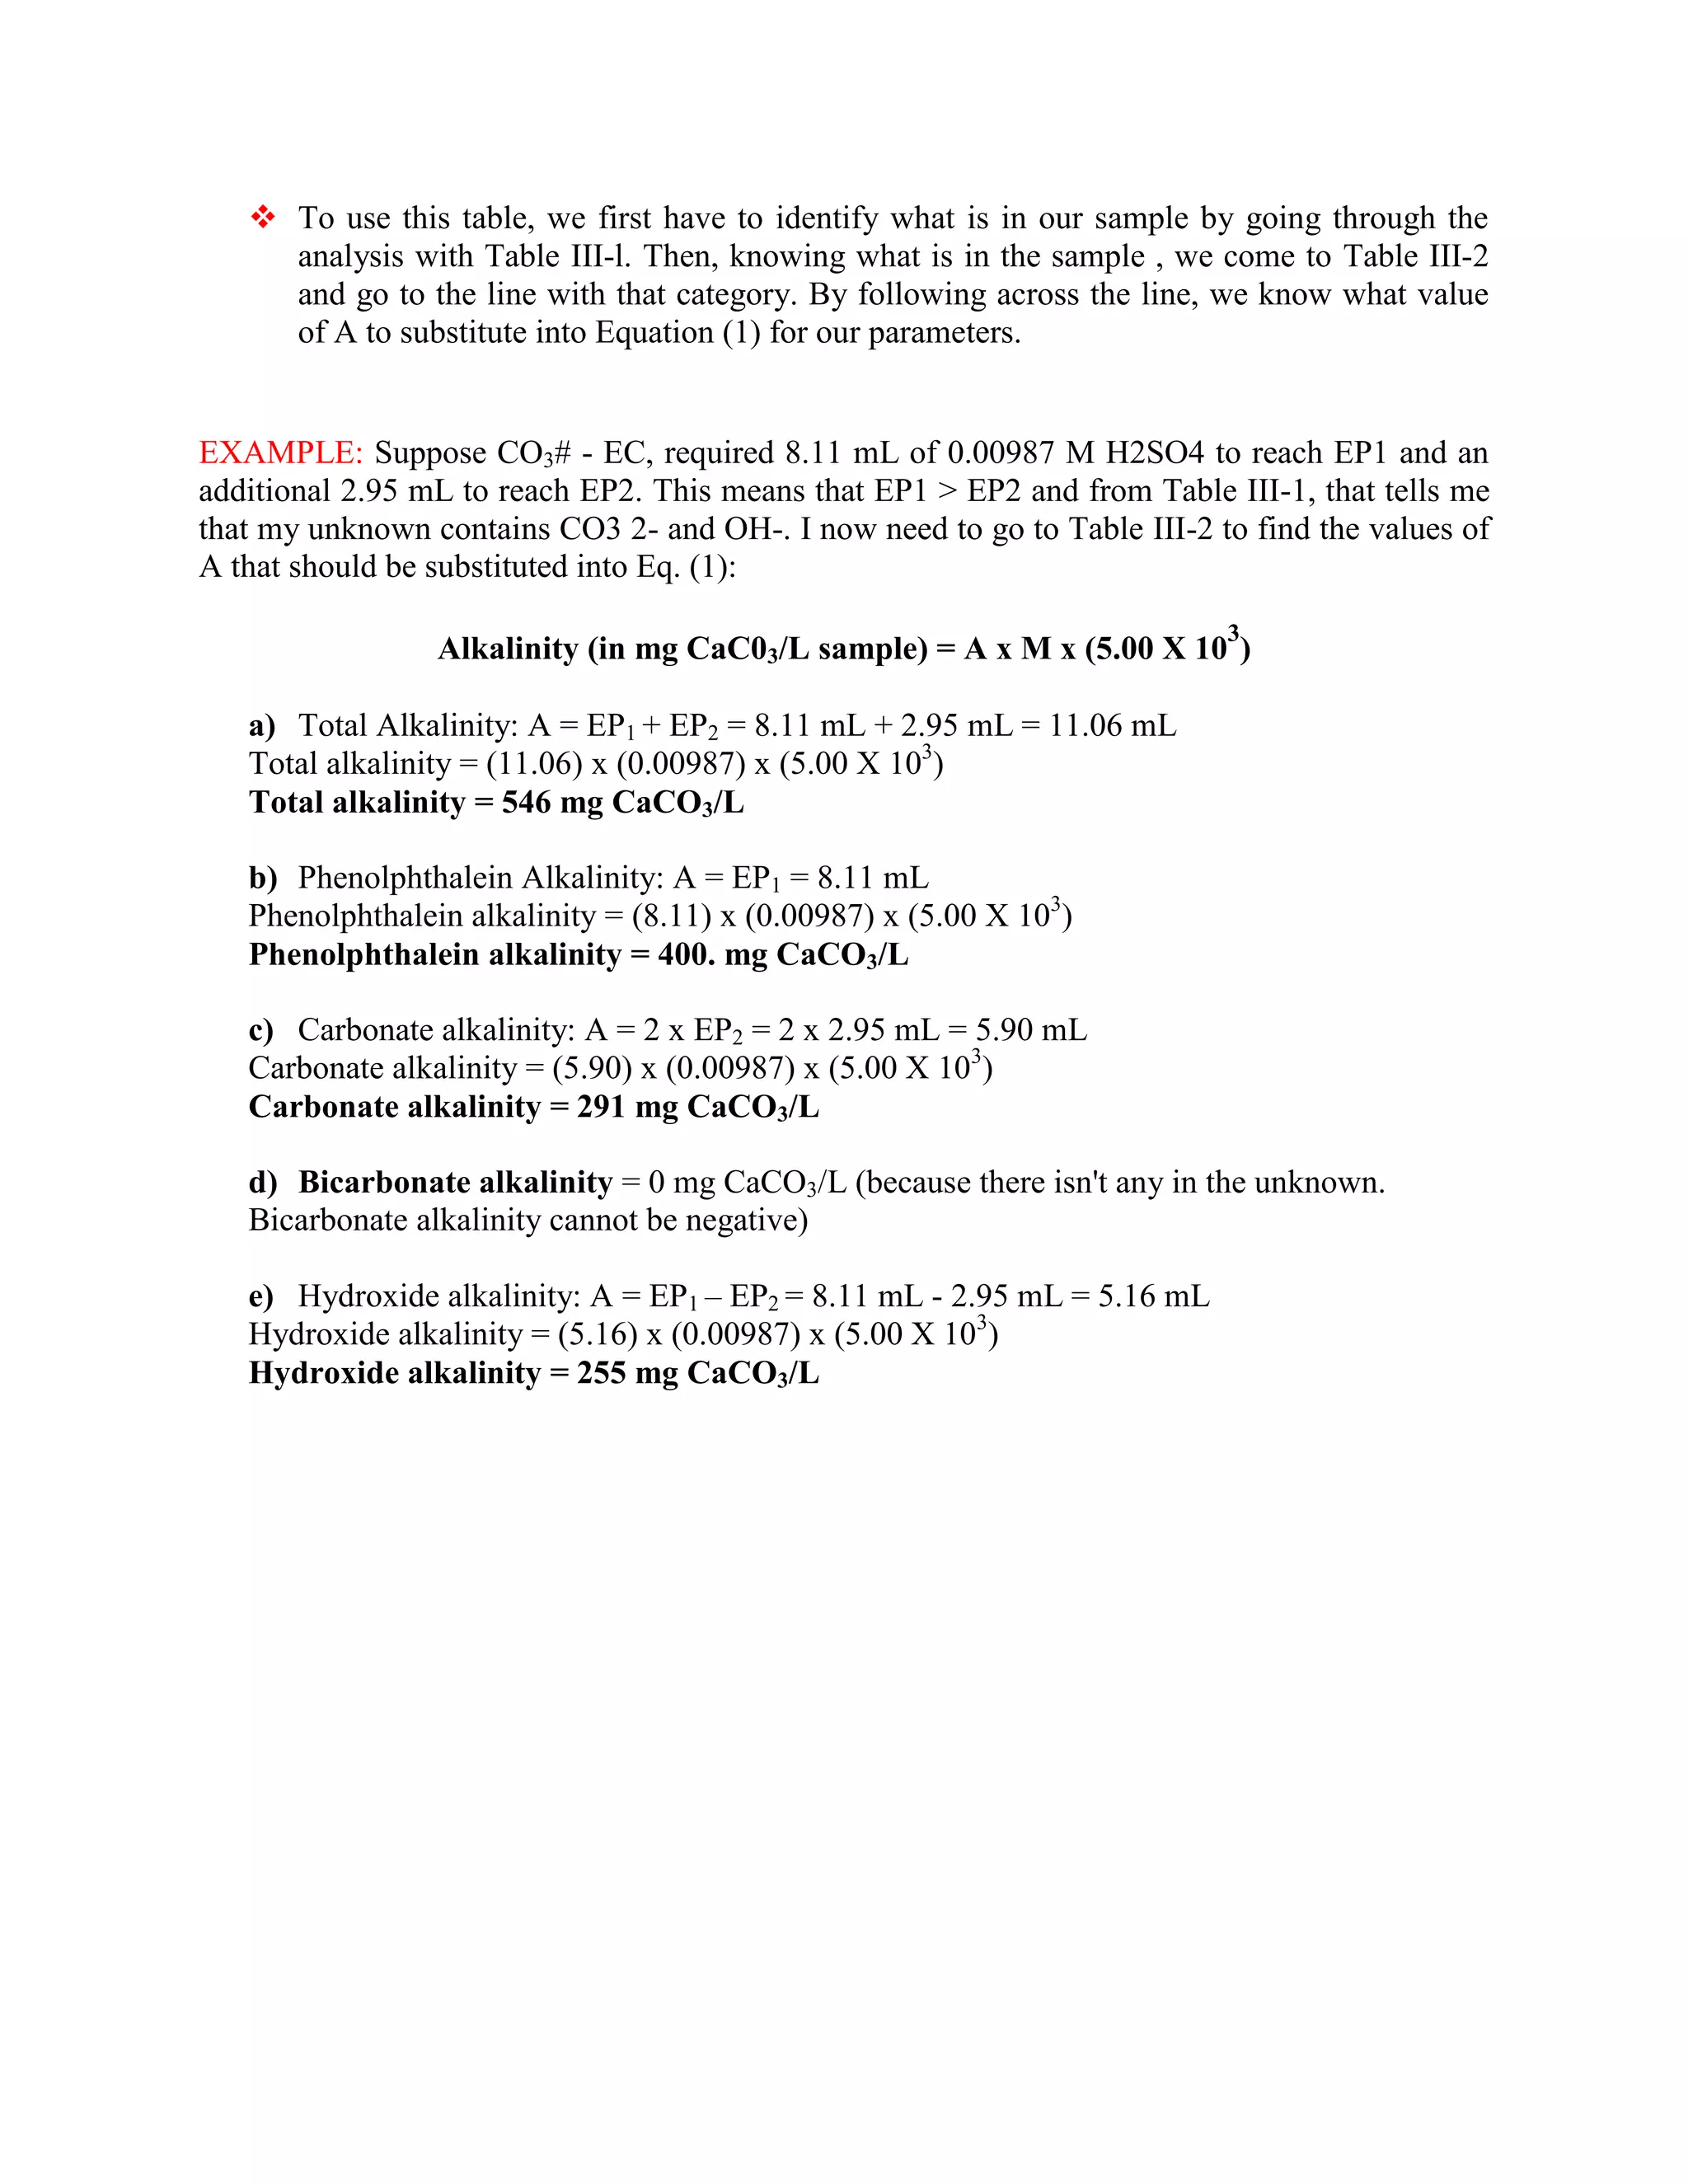
![If bicarbonate is the only substance in the sample, what would happen when phenolphthalein is
added to detect the first endpoint? The indicator would immediately turn colorless because
HC03- would give a pH lower than the first endpoint. [Actually the indicator might appear as a
very light pink color, but would require only a drop or two of acid to become colorless.]
In other words, the bicarbonate is ready to be titrated only to the second endpoint and would
require some amount of acid (Y mL [H+]).
► Notice that if bicarbonate is the only original species, it should require approximately 0 mL of
[H+] for the first endpoint.
3. HYDROXIDE ONLY (OH-)
If hydroxide is the only substance in the sample, it is very basic and the phenolphthalein will turn
a deep pink. Thus acid needs to be added until the color disappears. At that time, we know that
all of the OH- has been converted to water, which can no longer react with additional acid.
When we add the mixed indicator it should immediately change color (or it might require a drop
or two of acid). This occurs because there isn’t any base left to react with the acid.
► Notice that if hydroxide is the only original species, it should require approximately 0 mL of
[H+] for the second endpoint.
4. CARBONATE (CO3 2-) and BICARBONATE (HCO3 -)
During the first titration, only the carbonate reacts, producing bicarbonate at the first endpoint.
Then bicarbonate reacts with acid to reach the second endpoint, but we now have two sources of
the HC03-.](https://image.slidesharecdn.com/reportonalkalinitytestazlan-121124080329-phpapp02/75/Report-on-alkalinity-test-3-2048.jpg)
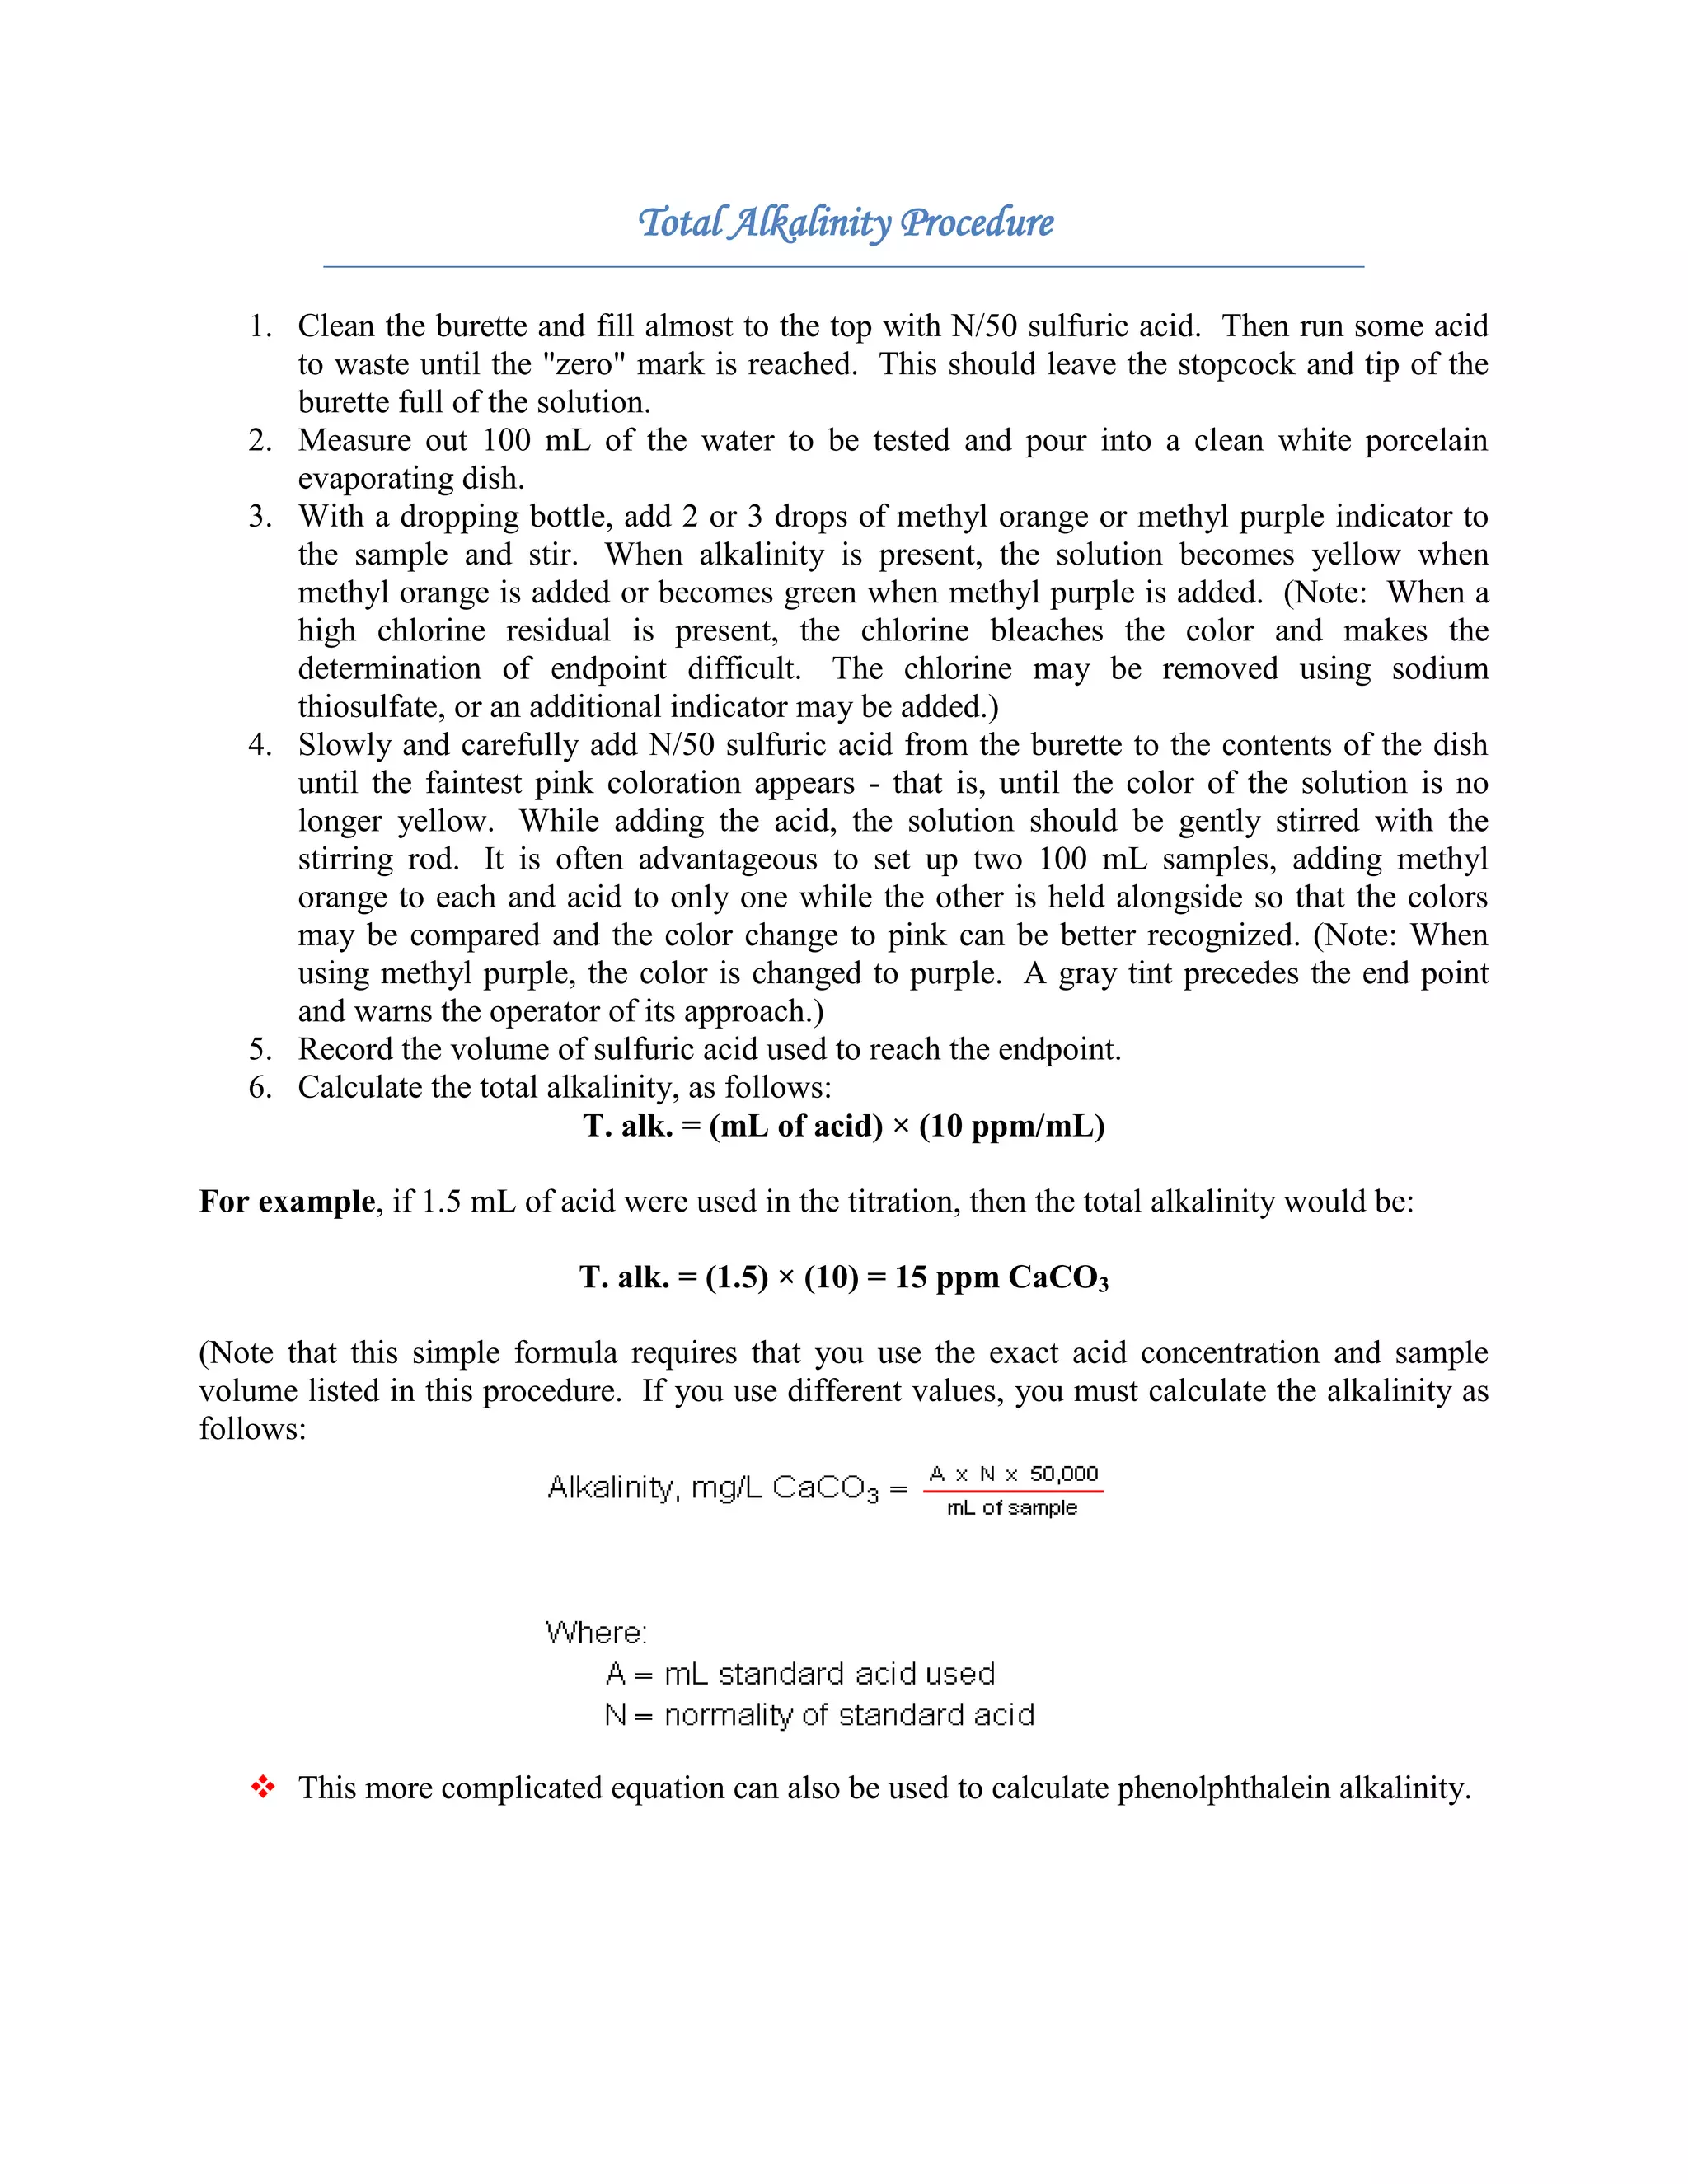
![► Bicarbonate that was originally in the sample
► Bicarbonate that was produced from the carbonate during the first titration.Essentially the
results are identical to adding the two separate situations together.
► Notice that this means the second endpoint volume (X + Y) will be larger than the first
endpoint and neither endpoint requires zero mL of acid.
5. CARBONATE ONLY (CO32-) and HYDROXIDE (OH-)
Again we can add the two individual results together to predict the relative volumes of the two
endpoints. For the first titration, acid is needed to react with both the carbonate and the
hydroxide ions, but when the first endpoint is reached, the hydroxide is finished, because it has
all been converted to water.
Then the bicarbonate (produced from the carbonate) is left to react with the acid to reach the
second endpoint.
► Notice that this means the first endpoint volume (X + Z) will be larger than the second
endpoint volume (X) and neither endpoint is zero.
Table 1
SAMPLE EP1 volume EP2 volume Comparison
CO32-only X mL [H+] X mL [H+] EP1 = EP2
HCO3-only X mL [H+] Y mL [H+] EP1 ≈ 0
OH-only X mL [H+] 0 mL [H+] EP2 ≈ 0
CO32-and HCO3 X mL [H+] {X+Y} mL [H+] EP1< EP2 but EP1 ≠ 0
CO3 2-and OH- {X+Z} mL [H+] X mL [H+] EP1> EP2 but EP2 ≠ 0
To use this table we only have to know how much acid was required to reach each
endpoint and match it up with one of the five possibilities.
CALCULATIONS TO REPORT ALKALINITY VALUES](https://image.slidesharecdn.com/reportonalkalinitytestazlan-121124080329-phpapp02/75/Report-on-alkalinity-test-4-2048.jpg)

This document provides instructions for determining the alkalinity of a water sample using a double-endpoint titration. Alkalinity is caused by carbonate, bicarbonate, and hydroxide ions and refers to a water sample's ability to neutralize acids. A titration with sulfuric acid is conducted, with two endpoints detected using different pH indicators. The volumes of acid needed at each endpoint can identify which ions are present and be used to calculate the sample's total, phenolphthalein, carbonate, bicarbonate, and hydroxide alkalinities in mg/L CaCO3. Tables are provided to match titration results to ion combinations and determine which acid volumes to use