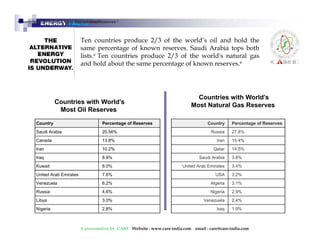
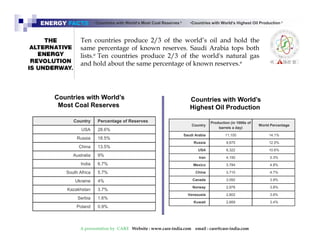
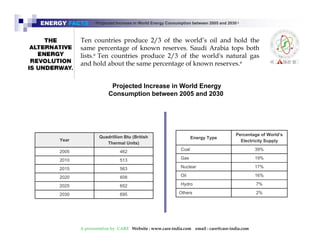
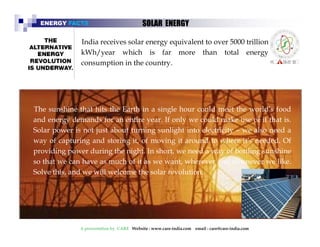
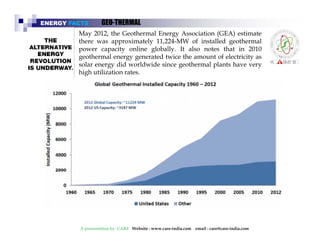
How has renewable energy and Alternate energy fared .
Some facts about renewable energy Potential and Installed capacities ,........updated till 2014 available
NATIONAL GREEN CORPS, NATIONAL SERVICE SCHEME, CLIMATE EDUCATION AND ENERGY C...W G Kumar
A training module to introduce College Lecturers and School Teachers to the subject of Climate Education and Live Projects that they can do in their institution and elsewhere
Energy Conservation & Efficiency: Guidebook for Responsible Energy Management AurovilleConsulting
Energy Conservation & Efficiency is a guidebook designed for responsible energy management. This publication is devised to help residents understand various technologies available in the market and make premediated choices in choosing the most energy efficient appliances. It provides tips in achieving energy savings for common electrical appliances used in households and also lists benefits of switching to energy efficient fixtures in an environmental perspective. Results presented in this show that there is substantial energy saving and CO2 emission reduction by energy conservation and efficiency initiatives.
Energy Conservation, Energy in Afghanistan, Ways to Save energy, Sources Of Energy In Afghanistan
Engr.Ahmad Sameer Nawab
Kardan University Kabul, Afghanistan
small presentation on energy conservation, providing just a backbone to the information so that you can move forward in giving your presentation a body to cover. Hoping it would serve the purpose you are looking for.
Solar street Lights
Most solar panels turn on and turn off automatically by sensing outdoor light using a light source.Solar streetlights are designed to work throughout the night. Many can stay lit for more than one night if the sun is not available for a couple of days. Older models included lamps that were not fluorescent or LED. Solar lights installed in windy regions are generally equipped with flat panels to better cope with the winds.
All you need to learn and start composting with aid of earth worms on your own.
Composting of waste to produce bio fertilizer by decomposition or by the use of earthworms called vermiculture.
What is Vermicomposting?
Vermicomposting is a simple biotechnological process of composting, in which certain species of earthworms are used to enhance the process of waste conversion and produce a better end product. Vermicomposting differs from composting in several ways (Gandhi et al. 1997). It is a mesophilic process, utilizing microorganisms and earthworms that are active at 10–32°C (not ambient temperature but temperature within the pile of moist organic material). The process is faster than composting; because the material passes through the earthworm gut, a significant but not yet fully understood transformation takes place, whereby the resulting earthworm castings (worm manure) are
rich in microbial activity and plant growth regulators, and fortified with pest repellence attributes as well! In short, earthworms, through a type of biological alchemy, are capable of transforming garbage into ‘gold’
An attempt to spread a general awarness among the populace on basics of systems, taking the mystery out and Keeping it simply simple.
We are blessed with Solar Energy in abundance at no cost. The solar radiation incident on the surface of the earth can be conveniently utilized for the benefit of human society. One of the popular devices that harness the solar energy is solar hot water system (SHWS).
A solar water heater consists of a collector to collect solar energy and an insulated storage tank to store hot water. The solar energy incident on the absorber panel coated with selected coating transfers the heat to the riser pipes underneath the absorber panel.
The water passing through the risers get heated up and is delivered the storage tank.
The re-circulation of the same water through absorber panel in the collector raises the temperature to 80 C (Maximum) in a good sunny day. The total system with solar collector, storage tank and pipelines is called solar hot water system.
Wind turbines, like aircraft propeller blades, turn in the moving air and power an electric generator that supplies an electric current. Simply stated, a wind turbine is the opposite of a fan. Instead of using electricity to make wind, like a fan, wind turbines use wind to make electricity. The wind turns the blades, which spin a shaft, which connects to a generator and makes electricity.
Wind Turbine Types
Modern wind turbines fall into two basic groups; the horizontal-axis variety, like the traditional farm windmills used for pumping water, and the vertical-axis design, like the eggbeater-style Darrieus model, named after its French inventor. Most large modern wind turbines are horizontal-axis turbines.
Turbine Components
Horizontal turbine components include:
blade or rotor, which converts the energy in the wind to rotational shaft energy;
a drive train, usually including a gearbox and a generator;
a tower that supports the rotor and drive train; and
other equipment, including controls, electrical cables, ground support equipment, and interconnection equipment.
Power generation from wind has emerged as one of the most rapidly growing renewable energy technologies. The estimated power generation capacity in India through wind is about 45,000 MW. The installed capacity is about 1,870 MW, which is about 4% of the total estimated potential.
Globally, wind generation capacity has increased by 27% in the year 2002 and is expected to expand 15 – fold in the next 20 years. Wind energy technologies have matured and large capacity wind turbines in the range of 1.25 to 1.65 MW are now being manufactured in India. The productivity of larger capacity machines is higher than that of smaller machines. Minimum wind velocity required for power generation is about 2.5 m/s and the maximum could be 30 m/s.
Energy generation for 1 MW turbine could be about 28 to 30 lakhs units per year, with a plant load factor of 25 to 30% Among the different renewable energy sources, wind energy is currently making a significant contribution to the installed capacity of power generation, and is emerging as a competitive option. The programme covers research and development, survey and assessment of wind resources, implementation of demonstration and private sector projects and promotional policies. As a result, India, with an installed capacity of about 3000 MW, ranks fifth in the world after Germany, USA, Spain and Denmark in wind power generation.
Small wind energy systems, namely water pumping windmills, aero generators and wind-solar hybrid systems can also be used for harnessing wind power potential, in addition to the large capacity wind turbines. These systems have been found to be very useful for meeting water pumping and small power requirements in decentralised mode in rural and remote windy areas of the country, which are un-electrified or have intermittent electric supply.
A TEXT BOOK : Complete and comprehensive inputs in Learning about Biogas and Biogas digestors:We have tried to take the mystery away from biogas.
Biogas is a renewable energy source with many different production pathways and various excellent opportunities to use.
One main advantage of biogas is the waste reduction potential. Biogas production by anaerobic digestion is popular for treating biodegradable waste because valuable fuel can be produced while destroying disease-causing pathogens and reducing the volume of disposed waste products.
Biogas burns more cleanly than coal, and emits less carbon dioxide per unit of energy. The carbon in biogas was recently extracted from the atmosphere by photosynthetic plants. Releasing it back into the atmosphere adds less total atmospheric carbon than burning fossil fuels.
Thus, biogas production kills two birds with one stone: it reduces waste and produces energy. In addition, the residues from the digestation process can be used as high quality fertilizer. This closes the nutrient cycle.
Why Use Renewable Energy?
Viable Alternative
Fossil fuel are more expensive
Environmental concerns/Green Technology and sustainability
Multiple/limitless fuel to turn a Renewable Energy Infrastructure like wind, solar and wastes
Increase range of Technologies
Cost effective than its alternative
Inverted Energy: Energy Storage Case Study Inverted2019
We built Inverted Energy to be a facilitator in the global shift towards future mobility and energy storage.
With a mission to accelerate the world's transition to sustainable energy, we have developed commercially advanced clean energy technologies, promotion sustainability by working with organisations in building energy storage projects with innovative technologies to move India forward.
We aim to democratise energy access through innovation in energy storage technology. #GoBeyond the Ordinary
Offshore Wind Energy – Potential for India
This presentation analyze energy demand scenario, especially that of almost unlimited wind energy and highlight vast potential of offshore wind energy for India in territorial water along its long coastline. Challenges to exploit this potential, financial viability of such offshore energy projects, social, environmental, and other related issues are discussed in Indian context to serve as a useful tool for policymakers to allocate resources for detailed studies for estimation and its ultimate utilization to add to growing pool of renewable energy
TiE Bangalore UNDP Energy programme and EnterpreneurshipTiE Bangalore
A Talk by Dr. S.N. Srinivas on on some of the project initiatives at UNDP, their implications to policy making, opportunities it has created/ can create for entrepreneurs.
Beginning from understanding the need to shift from conventional energy sources to Renewable Energy Sources (RES), the presentation talks about various technical and economic challenges faced in the process of increasing its penetration into the grid. The later half of the presentation describes various solar policies both at National (JNNSM) and State levels in India with emphasis on Gujarat and Karnataka state solar policies.
January 2024. Wind energy is characterized by its use of airflow for the production of mechanical power or electricity, making it a non-polluting renewable energy resource. Wind energy is generated by harnessing the kinetic energy of the wind via wind turbines. There are two major wind turbine types: Vertical Axis Wind Turbine (VAWT) and Horizontal Axis Wind Turbine (HAWT).
Wind energy is a clean and renewable source of energy that offers numerous benefits, including reduced pollution, lower carbon emissions, climate change mitigation, cleaner air, health improvement, energy cost savings, revenue from electricity generation, job creation, and economic growth.
However, wind technologies face challenges such as the high initial cost of installation, lack of political support, lack of grid infrastructure, and the intermittent nature of wind energy, which can disrupt grid stability.
Technology and innovation have driven advances in wind turbine design. As technology continues to improve, wind power turbines are becoming larger and more efficient, enabling them to generate more electricity and reduce costs. The use of renewable sources of energy, including wind energy, has grown due to several factors, such as concerns about the environmental impacts of the use of conventional fossil fuel sources and the associated carbon emissions, as well as the decreasing cost of wind energy technologies.
Policy wise, the Paris Agreement aims to reduce global temperature rise below 2°C by 2050, requiring a clean energy transition. Renewable energy, including wind energy, and carbon capture can achieve 90% carbon emission reduction to reach net zero by 2050. Wind energy use directly supports Sustainable Development Goal SDG7: Ensure access to affordable, reliable, sustainable, and modern energy for all.
In this slideshow, you will learn about the definition, types, advantages, challenges, UN policy, and global statistics of wind energy utilization. Discover how wind energy technologies can reduce global carbon emissions and accelerate the clean energy transition and meet net zero emission goals by 2050. For more slideshows on environmental sustainability, please visit s2adesign.com
Developing Solar Projects under REC Mechanism in IndiaBhargav Parmar
Instead of signing MoU, PPA, submitting performance bank guarantee etc for 25 years or participating in cut throat bidding process (project is viable only to module manufacturers for the rate it can be achieved), I suggest to develop the solar project under REC Mechanism, as for selling the power through average exchange rate and realizing the mean value of REC rate for first five years and half of the floor price for next 5 years, yields levellised rate of Rs.10.536*. [Solar Tariff in Gujarat: Rs. 9.28 for project commissioned up to 2013, Rs. 8.63 for project commissioned up to 2014 and Rs. 8.03 for project commissioned up to 2015].
Even if REC floor price is reduced by half for next 5 years and NIL thereafter, developing the project under REC and selling the power through Energy Exchange, would yield rate of Rs.9.647 which is more than maximum rate of NVVN against cost of generation not more than Rs.6.50. [NVVN is the nodal agency of NTPC for procuring solar power to meet their REC requirement. In the 1st phase NVVN finalized bid for 150 MW Solar Projects and in latest bid for 350 MW Solar Projects. In the latest NVVN bid the price offer for solar power projects were minimum Rs.7.49 and maximum Rs.9.44]
Moving to a generational shift to technologies using renewable energy sources with zero fuel cost for generation of energy.
A glimpse of things to come . Some innovative ideas that use the surroundings to produce Energy. These are Concept technologies, Pilot projects , some way beyond pilot projects Some successfully running..A window into the technology that is in incubation stage and ready to be unleashed. Commited to energy security using renewable enrgy sources.
Strategic Energy Innovations. Creating a better, more sustainable future through innovation.
Climate change and rising energy costs have brought resource efficiency to the forefront of many communities' agendas.
A Case study of saving 300% in Electrical Bills and Energy :Essel world Useing Energy Efficient Devices
This case study was done in 2008 or Essel World
The then, GM was Jude Monterio. We thank him for providing us an opportunity to study in detail their electrical installation and useage.
The use of energy efficient devices a CFL in lieu of a Incadescent bulb, or better replaced with a LED lamp helps save 300% to 500% in the Electrical bills, also saving approx 28 Megawatt of power
All figures provided are based on cost of energy at the time prevalent
We put a few tips to help conserve , save
10 Tips to save Energy and MOney.
Simple acts in everyday life
Simple and efficient ways to save both money and energy.
Understanding Paper sizes and the terminology used in the industry.
The size difference between Raw paper sizes and cut paper sizes.
The terms used worldwide for paper sizes.
How printers and manufacturers define sizes in the language
a1, a2, a3, a4, ansi, architectural paper, book binding, booklets, brochres, paper, paper mill, paper sizes, paper trade, printing, recycling paper, understanding paper terminology
Initially, paper was made out of fibres from mulberry bark,papyrus, straw or cotton. Wood only emerged as the chief raw material for paper mass production as recently as the mid 19th century.
The printed page is immediate, its message cutting across cultures; a tactile experience that demands attention and creates desire. It is a passport to knowledge, a storage medium, a persuasive tool and an entertaining art form.
Paper is a sustainable resource and a permanent document.
Paper making simplified
Making paper at home wth hand made make it yourself paper making, from waste to paper, paper making , Do it yourself.
Industry and businesses provide almost half the amount of recovered paper in the form of cuttings/shavings and unsold newspapers/magazines. Households contribute over a third. Almost any household paper, including used newspapers, cardboard, packaging, stationery, direct mail, magazines, catalogues, greeting cards and wrapping paper, can be recycled.
Recovered paper compares favorably with the production of wood-based pulp made by chemical or mechanical means in terms of environmental pollution and energy consumption.
All about paper Manufacturing: Paper Making Process
Industry and businesses provide almost half the amount of recovered paper in the form of cuttings/shavings and unsold newspapers/magazines. Households contribute over a third. Almost any household paper, including used newspapers, cardboard, packaging, stationery, direct mail, magazines, catalogues, greeting cards and wrapping paper, can be recycled. Recovered paper compares favorably with the production of wood-based pulp made by chemical or mechanical means in terms of environmental pollution and energy consumption.
Pencil and its impact on the environment. paper pencil vs the Wooden pencil a comparative
Pencils Recycled From Newspapers…Best Invention Ever?Here are the facts about wood and wood pencils:
79 million pencils could be made from a single press run of the Sunday Paper.
Recycling 1 2.5 foot stack of newspapers saves a 20 foot pine tree.
Many pencil manufacturers use wood taken from the rainforest.
Deforestation is a major cause of many negative environmental changes.
They are a cost effective alternative compared to other recycled pencil options.
They recycle newspapers, a hugely inefficient and wasteful practice.
Ecopencil is giving us a highly effective alternative to traditional wood pencils, right here and now.
Wood pencils are proven to be harmful for the environment just in how the wood to manufacture them is harvested. This is an outdated practice that there is no need for in this age. Displacing indigenous animals, soil erosion, urban sprawl, climate change…
…and the list goes on. Supporting integrity driven businesses such as these is the only way we can begin to repair the generations of damage we have caused on our environment.
Help make that change today by contacting Ecopencil. Ask us about our products. Ask them the facts. Involve yourself.
Small Businesses: Making money from waste , From trash to treasue
Construction Material Machinery, Brick and mortar business, Paver (flooring), Roof,Flooring machinery
Small enterprises, environment friendly, using(recycling) waste tp produce utility products like paper pencils, paper, paper pens, polymer pencils, bricks, roofing tiles,
Recycling paper , office sheets, newspaper, notebook, cotton waste, from 10 Kgs. a day to 10 Tonnes.
From your Trash can to Tissue paper , notebook, files
More from Centre for Application of renewable Energy (14)
Micro RNA genes and their likely influence in rice (Oryza sativa L.) dynamic ...Open Access Research Paper
Micro RNAs (miRNAs) are small non-coding RNAs molecules having approximately 18-25 nucleotides, they are present in both plants and animals genomes. MiRNAs have diverse spatial expression patterns and regulate various developmental metabolisms, stress responses and other physiological processes. The dynamic gene expression playing major roles in phenotypic differences in organisms are believed to be controlled by miRNAs. Mutations in regions of regulatory factors, such as miRNA genes or transcription factors (TF) necessitated by dynamic environmental factors or pathogen infections, have tremendous effects on structure and expression of genes. The resultant novel gene products presents potential explanations for constant evolving desirable traits that have long been bred using conventional means, biotechnology or genetic engineering. Rice grain quality, yield, disease tolerance, climate-resilience and palatability properties are not exceptional to miRN Asmutations effects. There are new insights courtesy of high-throughput sequencing and improved proteomic techniques that organisms’ complexity and adaptations are highly contributed by miRNAs containing regulatory networks. This article aims to expound on how rice miRNAs could be driving evolution of traits and highlight the latest miRNA research progress. Moreover, the review accentuates miRNAs grey areas to be addressed and gives recommendations for further studies.
"Understanding the Carbon Cycle: Processes, Human Impacts, and Strategies for...MMariSelvam4
The carbon cycle is a critical component of Earth's environmental system, governing the movement and transformation of carbon through various reservoirs, including the atmosphere, oceans, soil, and living organisms. This complex cycle involves several key processes such as photosynthesis, respiration, decomposition, and carbon sequestration, each contributing to the regulation of carbon levels on the planet.
Human activities, particularly fossil fuel combustion and deforestation, have significantly altered the natural carbon cycle, leading to increased atmospheric carbon dioxide concentrations and driving climate change. Understanding the intricacies of the carbon cycle is essential for assessing the impacts of these changes and developing effective mitigation strategies.
By studying the carbon cycle, scientists can identify carbon sources and sinks, measure carbon fluxes, and predict future trends. This knowledge is crucial for crafting policies aimed at reducing carbon emissions, enhancing carbon storage, and promoting sustainable practices. The carbon cycle's interplay with climate systems, ecosystems, and human activities underscores its importance in maintaining a stable and healthy planet.
In-depth exploration of the carbon cycle reveals the delicate balance required to sustain life and the urgent need to address anthropogenic influences. Through research, education, and policy, we can work towards restoring equilibrium in the carbon cycle and ensuring a sustainable future for generations to come.
Diabetes is a rapidly and serious health problem in Pakistan. This chronic condition is associated with serious long-term complications, including higher risk of heart disease and stroke. Aggressive treatment of hypertension and hyperlipideamia can result in a substantial reduction in cardiovascular events in patients with diabetes 1. Consequently pharmacist-led diabetes cardiovascular risk (DCVR) clinics have been established in both primary and secondary care sites in NHS Lothian during the past five years. An audit of the pharmaceutical care delivery at the clinics was conducted in order to evaluate practice and to standardize the pharmacists’ documentation of outcomes. Pharmaceutical care issues (PCI) and patient details were collected both prospectively and retrospectively from three DCVR clinics. The PCI`s were categorized according to a triangularised system consisting of multiple categories. These were ‘checks’, ‘changes’ (‘change in drug therapy process’ and ‘change in drug therapy’), ‘drug therapy problems’ and ‘quality assurance descriptors’ (‘timer perspective’ and ‘degree of change’). A verified medication assessment tool (MAT) for patients with chronic cardiovascular disease was applied to the patients from one of the clinics. The tool was used to quantify PCI`s and pharmacist actions that were centered on implementing or enforcing clinical guideline standards. A database was developed to be used as an assessment tool and to standardize the documentation of achievement of outcomes. Feedback on the audit of the pharmaceutical care delivery and the database was received from the DCVR clinic pharmacist at a focus group meeting.
Characterization and the Kinetics of drying at the drying oven and with micro...Open Access Research Paper
The objective of this work is to contribute to valorization de Nephelium lappaceum by the characterization of kinetics of drying of seeds of Nephelium lappaceum. The seeds were dehydrated until a constant mass respectively in a drying oven and a microwawe oven. The temperatures and the powers of drying are respectively: 50, 60 and 70°C and 140, 280 and 420 W. The results show that the curves of drying of seeds of Nephelium lappaceum do not present a phase of constant kinetics. The coefficients of diffusion vary between 2.09.10-8 to 2.98. 10-8m-2/s in the interval of 50°C at 70°C and between 4.83×10-07 at 9.04×10-07 m-8/s for the powers going of 140 W with 420 W the relation between Arrhenius and a value of energy of activation of 16.49 kJ. mol-1 expressed the effect of the temperature on effective diffusivity.
Natural farming @ Dr. Siddhartha S. Jena.pptxsidjena70
A brief about organic farming/ Natural farming/ Zero budget natural farming/ Subash Palekar Natural farming which keeps us and environment safe and healthy. Next gen Agricultural practices of chemical free farming.
Artificial Reefs by Kuddle Life Foundation - May 2024punit537210
Situated in Pondicherry, India, Kuddle Life Foundation is a charitable, non-profit and non-governmental organization (NGO) dedicated to improving the living standards of coastal communities and simultaneously placing a strong emphasis on the protection of marine ecosystems.
One of the key areas we work in is Artificial Reefs. This presentation captures our journey so far and our learnings. We hope you get as excited about marine conservation and artificial reefs as we are.
Please visit our website: https://kuddlelife.org
Our Instagram channel:
@kuddlelifefoundation
Our Linkedin Page:
https://www.linkedin.com/company/kuddlelifefoundation/
and write to us if you have any questions:
info@kuddlelife.org
WRI’s brand new “Food Service Playbook for Promoting Sustainable Food Choices” gives food service operators the very latest strategies for creating dining environments that empower consumers to choose sustainable, plant-rich dishes. This research builds off our first guide for food service, now with industry experience and insights from nearly 350 academic trials.
growbilliontrees.com-Trees for Granddaughter (1).pdf
Renewable energy facts
1. ENERGY FACTS
NON RENEWABLE ENERGY
RENEWABLE
ENERGY………..……THE WAY FORWARD
A BRIEF LOOK AT THE ENERGY CAPACITY
A presentation by CARE Website : www.care-india.com email : care@care-india.com
2. ENERGY FACTS RENEWABLE ENERGY
A presentation by CARE Website : www.care-india.com email : care@care-india.com
3. ENERGY FACTS NON -RENEWABLE ENERGY
A presentation by CARE Website : www.care-india.com email : care@care-india.com
4. ENERGY FACTS
Ten countries produce 2/3 of the world’s oil and hold the
f k S d A b b h
••Countries with World’’s Most ONailt Rureasle Grvaess Reeserves e
same percentage of known reserves. Saudi Arabia tops both
lists.e Ten countries produce 2/3 of the world's natural gas
and hold about the same percentage of known reserves.e
Countries with World’s
M tOilR
Countries with World’s
Most Natural Gas Reserves
Most Oil Reserves
Country Percentage of Reserves
Saudi Arabia 20.56%
C d 13 8%
Country Percentage of Reserves
Russia 27.8%
Canada 13.8% I 15 4%
Iran 10.2%
Iraq 8.9%
Kuwait 8.0%
Iran 15.4%
Qatar 14.5%
Saudi Arabia 3.8%
United Arab Emirates 3.4%
United Arab Emirates 7.6%
Venezuela 6.2%
Russia 4.6%
Libya 3 0%
USA 3.2%
Algeria 3.1%
Nigeria 2.9%
Venezuela 2 4%
3.0%
Nigeria 2.8%
2.4%
Iraq 1.9%
A presentation by CARE Website : www.care-india.com email : care@care-india.com
5. ENERGY FACTS
•Countries with World’s Most Coal Reserves e •Countries with World’s Highest Oil Production d
Ten countries produce 2/3 of the world’s oil and hold the
same percentage f of k known reserves. S d Saudi A b Arabia tops b h
both
lists.e Ten countries produce 2/3 of the world's natural gas
and hold about the same percentage of known reserves.e
Countries with World’s
Most Coal Reserves
Countries with World’s
Highest Oil Production
Country Percentage of Reserves
USA 28.6%
Russia 18 5%
Country Production (in 1000s of
barrels a day)
World Percentage
Saudi Arabia 11,100 14.1% 18.5%
China 13.5%
Australia 9%
India 6.7%
Russia 9,870 12.5%
USA 8,322 10.6%
Iran 4,150 5.3%
Mexico 3,784 4.8%
South Africa 5.7%
Ukraine 4%
Kazakhstan 3.7%
Serbia 1.6%
China 3,710 4.7%
Canada 3,092 3.9%
Norway 2,978 3.8%
Venezuela 2,802 3.6%
K it 2 669 3 4%
Poland 0.9%
Kuwait 2,669 3.4%
A presentation by CARE Website : www.care-india.com email : care@care-india.com
6. ENERGY FACTS
•Projected Increase in World Energy Consumption between 2005 and 2030 g
Ten countries produce 2/3 of the world’s oil and hold the
same percentage f of k known reserves. S d Saudi A b Arabia tops b h
both
lists.e Ten countries produce 2/3 of the world's natural gas
and hold about the same percentage of known reserves.e
Projected Increase in World Energy
Consumption between 2005 and 2030
Y
Quadrillion Btu (
British Energy Type
Percentage of World’s
Year
Thermal Units)
2005 462
2010 513
2015 563
Electricity Supply
Coal 39%
Gas 19%
Nuclear 17%
2020 608
2025 652
2030 695
Oil 16%
Hydro 7%
Others 2%
A presentation by CARE Website : www.care-india.com email : care@care-india.com
7. ENERGY FACTS Alternate Sources of Energy
ALTERNATE SOURCES OF ENERGY :
POTENTIAL VS INSTALLED CAPACITY
A presentation by CARE Website : www.care-india.com email : care@care-india.com
8. ENERGY FACTS SOLAR ENERGY
India receives solar energy equivalent to over 5000 trillion
kWh/year which is far more than total energy
consumption in the country.
The sunshine that hits the Earth in a single hour could meet the world’’s food
and energy demands for an entire year. If only we could make use of it that is.
Solar power is not just about turning sunlight into electricity – we also need a
way of capturing and storing it, of moving it around to where it’’s needed. Of
providing power during the night. In short, we need a way of bottling sunshine
so that we can have as much of it as we want, wherever and whenever we like.
Solve this, and we will welcome the solar revolution.
A presentation by CARE Website : www.care-india.com email : care@care-india.com
9. ENERGY FACTS SOLAR ENERGY
India’s Solar Power Capacity
Tops 2,600 MW…….2013-14
Global 37,007 megawatts (MW) of solar
PV power installed in 2013
A presentation by CARE Website : www.care-india.com email : care@care-india.com
10. ENERGY FACTS THE INDIAN WIND ENERGY PROGRAMME
The Indian wind energy programme is one of the largest
in the world, having an installed wind capacity of over
21000 MW. …..31/3/2014
India ranks fourth in the world with a total wind power
capacity of 21000 MW, most of which have been
established in commercial projects.
A presentation by CARE Website : www.care-india.com email : care@care-india.com
11. ENERGY FACTS THE WIND ENERGY PROGRAMME
The Indian wind energy programme is one of the largest
in the world, having an installed wind capacity of over
21000 MW. …..31/3/2014
India ranks fourth in the world with a total wind power
capacity of 21000 MW, most of which have been
established in commercial projects.
A presentation by CARE Website : www.care-india.com email : care@care-india.com
12. ENERGY FACTS THE WIND ENERGY PROGRAMME
Year Capacity (MW) Growth (MW) Growth (%)
1995 4,800 - -
1996 6,100 1,300 27.1
The T19h97e Indian wind en7 4e8r2gy energy programme is 1is38 2one one of the largest
larges2t2 7
in the world, having an installed wind capacity of over
21000 MW. …..31/3/2014
India ranks fourth in the world with a total wind power
1997 7,482 1,382 22.7
1998 9,670 2,188 29.3
1999 13,699 4,029 64.3
2000 18,040 4,341 31.7
I2n00d1 ia fourth2 i4n,31 8the a6,2 t7o9 tal power3 4.9
capacity of 21000 MW, most of which have been
established in commercial projects.
2002 31,184 6,866 28.3
2003 39,333 8,149 26.2
2004 47,661 8,329 21.2
2005 59,062 11,401 24
2006 74,174 15,112 25.6
2007 93,958 19,784 26.7
2008 121,246 27,289 29.1
2009 157,909 36,664 30.3
2010 194,558 36,649 23.3
2011 237,022 42,465 21.9
2012 282,683 45,661 19.3
2013 318,510 35,828 12.7
A presentation by CARE Website : www.care-india.com email : care@care-india.com
13. ENERGY FACTS
BIOGAS
Global installed production capacity is now more than 800 billion
cubic feet per year year, representing nearly 14 5 14.5 gigawatts (GW)
of installed distributed and grid-scale renewable generation
capacity. With at least 11 billion cubic feet per year of
production capacity expected to come online worldwide by
the end of 2012,
A presentation by CARE Website : www.care-india.com email : care@care-india.com
14. ENERGY FACTS
BIOGAS
Global installed production capacity is now more than 800 billion
cubic feet per year year, representing nearly 14 5 14.5 gigawatts (GW)
of installed distributed and grid-scale renewable generation
capacity. With at least 11 billion cubic feet per year of
production capacity expected to come online worldwide by
the end of 2012,
Summary of global biomass to electricity market 2012
Installed G th t O ti
Estimated
l t i it
Capacity 2012
(GW)
Growth rate
2011 to 2012 (%)
Operating
time (hr)
electricity
generation in
2012 (TWh)
Solid biomass 50 3.5 3,500-7,000 175-350
Biogas 14 10 3,500-7,000 47-95
Municipal solid 10 5 3 500 7 000 36 72
waste 3,500-7,000 36-Liquid biofuels 2 20 3,500-7,000 6-12
T t Total l bi biomass 76 5 3 500 3,500-7 000 7,000 265 265-529
A presentation by CARE Website : www.care-india.com email : care@care-india.com
15. ENERGY FACTS HYDRO ELECTRICITY
The movement of water as it flows downstream creates kinetic
energy that can be converted into electricity. 2700 TWH is
generated every year. Hydropower supplies at least 50% of
electricity production in 66 countries and at least 90% in 24
countries.
Out of the total power generation installed capacity in India of 1,76,990 MW (June,
2011), hydro power contributes about 21.5% i.e. 38,106 MW. A capacity addition of
78,700 MW is envisaged from different conventional sources during 2007-2012
which includes 15,627MW from large hydro projects.
In addition to this this, a capacity addition of 1400 MW was envisaged from small hydro
Animal dung, firewood, and agricultural residue are all
traditional fuels, which are renewable. When the
collection of firewood exceeds the capacity of the forest to
up to 25 MW station capacity. The total hydroelectric power potential in the country
is assessed at about 150,000 MW, equivalent to 84,000 MW at 60% load factor. The
potential of small hydro power projects is estimatedpat aboyut 15,000 MW. -
re-grow or renew, problems set in. Therefore, excessive
use of firewood is not a very environment- friendly
exercise and alternative fuels must be provided
A presentation by CARE Website : www.care-india.com email : care@care-india.com
16. ENERGY FACTS HYDRO ELECTRICITY
GLOBAL HYDROPOWER
INSTALLED CAPACITY1.31TW
Hydropower is produced in at least 150 countries but is concentrated in just a few countries
and regions. The Asia-Pacific region generated roughly 32 percent of global hydropower in
2010. Africa produces the least hydropower, accounting for 3 percent of the world total, but
is considered the region with the greatest potential for increased production
Ten of the largest hydroelectric producers as at 2009
Country Annual hydroelectric
production TWh)
Installed
capacity GW)
Capacity
factor
% of total
((capacity
China 652.05 196.79 0.37 22.25
Canada 369.5 88.974 0.59 61.12
Brazil 363.8 69.080 0.56 85.56
United States 250.6 79.511 0.42 5.74
Russia 167.0 45.000 0.42 17.64
Norway 140.5 27.528 0.49 98.25
India 115.6 33.600 0.43 15.80
Venezuela 85 96 14 622 0 67 69 20
85.96 14.622 0.67 69.20
Japan 69.2 27.229 0.37 7.21
Sweden 65.5 16.209 0.46 44.34
A presentation by CARE Website : www.care-india.com email : care@care-india.com
17. ENERGY FACTS GEO-THERMAL
May 2012, the Geothermal Energy Association (GEA) estimate
there was approximately 11,224-MW of installed geothermal
power capacity online globally. It also notes that in 2010
geothermal energy generated twice the amount of electricity as
solar energy did worldwide since geothermal plants have very
high utilization rates.
A presentation by CARE Website : www.care-india.com email : care@care-india.com
18. ENERGY FACTS
THANK YOU…..
A presentation by CARE Website : www.care-india.com email : care@care-india.com