Download to read offline
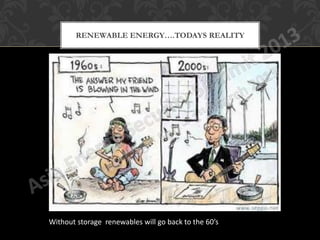
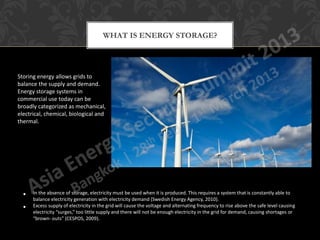
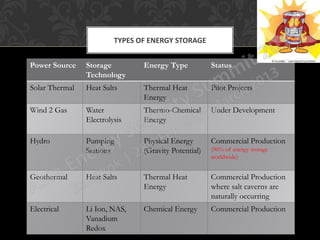
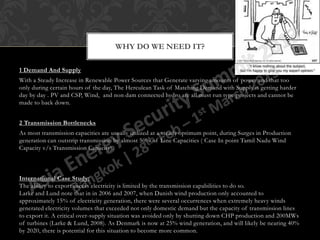
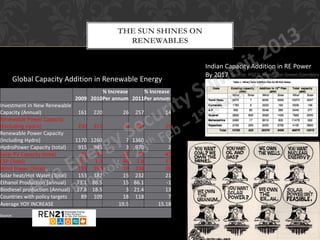
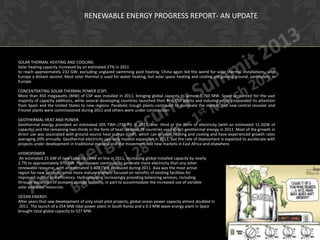


The presentation discusses the critical role of energy storage in balancing supply and demand for renewable energy sources, particularly as they become more prevalent. It highlights various types of energy storage technologies and the growing need for robust systems to manage electricity generation fluctuations. The document also provides statistics on global renewable energy investments and capacity growth, emphasizing the necessity for a 'wise grid' that can store and deploy energy effectively.


