Reliability Engineering
Fred Schenkelberg
fms@fmsreliability.com
MEASURING AVAILABILITY
Day 3 Session 1
Objectives
• Structuring a hierarchy of goals and measures
• Determining constraints and bottlenecks
• Developing five measures of availability
• Obtaining measures for critical equipment
• Embarking on structured approach to improve
availability.
• Formulating a condition monitoring program
Availability & Business
• Translating business
objectives into
availability
• Cost
• Yield
• Throughput
• ROI
• …
Hierarchy of Goals
• Business goals to line,
system, or process
• Decision & budget level
• Physical alignment
• Process alignment
Actionable level
• Apportionment
• RBD and apportionment
• Available
• Reliability
• Maintainability
Sample goal statements
• Line x in plant y operates
with 90% availability over
each shift
• Function
• Environment
• Probability
• Duration
• Compressor x on
equipment y provides z
pressure with 95%
reliability over 5 years of
continuous operation.
• Replacement of
compressor x occurs 90%
of the time in less than 2
hours with existing
equipment and
diagnostics.
Performance Reporting Flow
Discussion & Questions
Process flow modeling
• Map the process
including
• Physical item
movement
• Information movement
• Transitions, decisions
• Durations and gates
Constraints
A limiting factor
• Capacity
• Throughput
• Budgetary
Bottlenecks
: a delay caused when one
part of a process or
activity is slower than the
others and so hinders
overall progress
• Opportunity
• Optimization
Examples
• Bottling plant
• Filler equipment
– 600 per hour fill rate
– Lowest rate of all
equipment
• Buffer (inventory holding
area)
– Limited by size or floor
space
Discussion & Questions
Availability
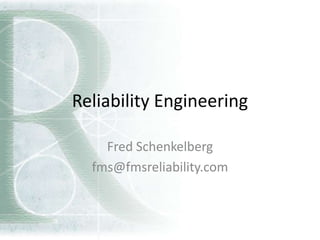
• Ratio of the expected
value of uptime to the
aggregate of the
expected values of up
and down time.
A =
E[Uptime]
E[Uptime]+ E[Downtime]
Inherent Availability, Ai
• The probability of
satisfactory operation at
given point in time
under stated conditions
in an ideal support
environment.
• Downtime only counts
corrective maintenance
and does not include
– Logistics time
– Administrative time
– Preventative
maintenance
• Items under control of
equipment designer.
Achieved Availability, Aa
• Probability of
satisfactory operation at
given point in time
under stated conditions
in ideal support
environments
• Downtime only includes
active preventative and
corrective maintenance
time (wrench time).
• Does not include
– Logistics time
– Administrative time
Operational Availability, Ao
• Probability of
satisfactory operation at
given point in time
under stated conditions
with actual support
environment.
• Downtime includes
everything.
Reliability/
Supportability/ Maintainability/
Design “Cause”
Operational “Effect”
Operation
Logistics Maintenance
Time to
Support (TTS)
Time to
Maintain (TTM)
Time to
Failure (TTF)
System Downtime
Time
Discussion & Questions
Critical Equipment
• What to optimize?
• Bottleneck equipment
• Quality element
• ‘Where the magic
occurs’
Risk Minimization
• Long repair times
• Safety issues
– Explosion
– Releases
• Poor Quality impact
What to Measure
• Direct performance
• Performance indicators
• Quality stability
• Leading indicators
– Current
– Pressure
Measurement Techniques
• Product measurements
• Process parameters
• Process Control
• Inspections and Studies
Discussion & Questions
Availability Improvement Planning
• Assessment
• Process mapping
• Data collection
• Characterize current
state (and reason for
current state)
Level of detail
• Enough data to make
informed decisions
• Is the process stable?
• What causes
differences?
• What is cost of
downtime?
Focus on Value
• Select improvement
projects and tasks that
have highest ROI
– Low hanging fruit
– Major return potential
– Portfolio approach
• Estimate value and risk
before selecting tasks
Program Approaches
• Major redesign
• Incremental
improvements
• Process control
(stability)
• Backup plan
Discussion & Questions
Condition Monitoring
• Regular observations or
measures of indictors of
impending failure.
– Oil level
– Current draw
– vibration
Image from article by Ricky Smith on The Maintenance Phoenix site
Experiments, Models and Measures
• Start measuring today
• Engineering judgment
and experience to
starting monitoring
• Design experiments to
determine effective
predictors
Considerations
• Ability to detect fault
indicators
• Lead time requirements
– Spare parts
– Specialized equipment
• Scheduling optimization
Discussion & Questions
Summary
• Structuring a hierarchy of
goals and measures
• Determining constraints and
bottlenecks
• Developing five measures of
availability
• Obtaining measures for
critical equipment
• Embarking on structured
approach to improve
availability.
• Formulating a condition
monitoring program
Measuring Availability

Reliability Maintenance Engineering 3 - 1 Measuring Availability

  • 1.
  • 2.
  • 3.
    Objectives • Structuring ahierarchy of goals and measures • Determining constraints and bottlenecks • Developing five measures of availability • Obtaining measures for critical equipment • Embarking on structured approach to improve availability. • Formulating a condition monitoring program
  • 5.
    Availability & Business •Translating business objectives into availability • Cost • Yield • Throughput • ROI • …
  • 6.
    Hierarchy of Goals •Business goals to line, system, or process • Decision & budget level • Physical alignment • Process alignment
  • 7.
    Actionable level • Apportionment •RBD and apportionment • Available • Reliability • Maintainability
  • 8.
    Sample goal statements •Line x in plant y operates with 90% availability over each shift • Function • Environment • Probability • Duration • Compressor x on equipment y provides z pressure with 95% reliability over 5 years of continuous operation. • Replacement of compressor x occurs 90% of the time in less than 2 hours with existing equipment and diagnostics.
  • 9.
  • 10.
  • 12.
    Process flow modeling •Map the process including • Physical item movement • Information movement • Transitions, decisions • Durations and gates
  • 13.
    Constraints A limiting factor •Capacity • Throughput • Budgetary
  • 14.
    Bottlenecks : a delaycaused when one part of a process or activity is slower than the others and so hinders overall progress • Opportunity • Optimization
  • 15.
    Examples • Bottling plant •Filler equipment – 600 per hour fill rate – Lowest rate of all equipment • Buffer (inventory holding area) – Limited by size or floor space
  • 16.
  • 18.
    Availability • Ratio ofthe expected value of uptime to the aggregate of the expected values of up and down time. A = E[Uptime] E[Uptime]+ E[Downtime]
  • 19.
    Inherent Availability, Ai •The probability of satisfactory operation at given point in time under stated conditions in an ideal support environment. • Downtime only counts corrective maintenance and does not include – Logistics time – Administrative time – Preventative maintenance • Items under control of equipment designer.
  • 20.
    Achieved Availability, Aa •Probability of satisfactory operation at given point in time under stated conditions in ideal support environments • Downtime only includes active preventative and corrective maintenance time (wrench time). • Does not include – Logistics time – Administrative time
  • 21.
    Operational Availability, Ao •Probability of satisfactory operation at given point in time under stated conditions with actual support environment. • Downtime includes everything. Reliability/ Supportability/ Maintainability/ Design “Cause” Operational “Effect” Operation Logistics Maintenance Time to Support (TTS) Time to Maintain (TTM) Time to Failure (TTF) System Downtime
  • 22.
  • 23.
  • 25.
    Critical Equipment • Whatto optimize? • Bottleneck equipment • Quality element • ‘Where the magic occurs’
  • 26.
    Risk Minimization • Longrepair times • Safety issues – Explosion – Releases • Poor Quality impact
  • 27.
    What to Measure •Direct performance • Performance indicators • Quality stability • Leading indicators – Current – Pressure
  • 28.
    Measurement Techniques • Productmeasurements • Process parameters • Process Control • Inspections and Studies
  • 29.
  • 31.
    Availability Improvement Planning •Assessment • Process mapping • Data collection • Characterize current state (and reason for current state)
  • 32.
    Level of detail •Enough data to make informed decisions • Is the process stable? • What causes differences? • What is cost of downtime?
  • 33.
    Focus on Value •Select improvement projects and tasks that have highest ROI – Low hanging fruit – Major return potential – Portfolio approach • Estimate value and risk before selecting tasks
  • 34.
    Program Approaches • Majorredesign • Incremental improvements • Process control (stability) • Backup plan
  • 35.
  • 37.
    Condition Monitoring • Regularobservations or measures of indictors of impending failure. – Oil level – Current draw – vibration
  • 38.
    Image from articleby Ricky Smith on The Maintenance Phoenix site
  • 39.
    Experiments, Models andMeasures • Start measuring today • Engineering judgment and experience to starting monitoring • Design experiments to determine effective predictors
  • 40.
    Considerations • Ability todetect fault indicators • Lead time requirements – Spare parts – Specialized equipment • Scheduling optimization
  • 41.
  • 42.
    Summary • Structuring ahierarchy of goals and measures • Determining constraints and bottlenecks • Developing five measures of availability • Obtaining measures for critical equipment • Embarking on structured approach to improve availability. • Formulating a condition monitoring program Measuring Availability

Editor's Notes

  • #5 Structuring a hierarchy of goals and measures
  • #11 Balance between investment and value
  • #12 Determining constraints and bottlenecks
  • #17 Balance between investment and value
  • #18 Developing five measures of availability
  • #24 Balance between investment and value
  • #25 Obtaining measures for critical equipment
  • #30 Balance between investment and value
  • #31 Embarking on structured approach to improve availability.
  • #36 Balance between investment and value
  • #37 Formulating a condition monitoring program
  • #39 http://www.maintenancephoenix.com/2013/04/23/achieve-breakthrough-performance-today-optimize-production-capacity/
  • #42 Balance between investment and value