Chapter 9 - Introduction to Relative Strength
SECTION 10 - COMPARATIVE MARKET ANALYSIS
Presented By :
This Content is Copyright Reserved Rights Copyright 2025@PTAIndia
Agenda
 Introduction to Relative Strength
 Relative Strength History
 Assessing Relative Strength
 Relative Strength Considerations
 Ranking with Relative Strength
 Difference between Institutional and Private
Investors
This Content is Copyright Reserved Rights Copyright 2025@PTAIndia
Relative Strength
Presented By :
This Content is Copyright Reserved Rights Copyright 2025@PTAIndia
Relative Strength
Key Facts:
1. Definition: Relative Strength Analysis (RSA) compares the performance of one asset (stock, ETF,
index) to another (benchmark or another asset) to identify stronger performers.
2. Purpose: Helps traders and investors find outperforming assets in a given market.
3. Formula: Relative Strength (RS)=Price of Asset A/Price of Asset B (Benchmark)
4. Interpretation:
o RS Rising: Asset A is outperforming Asset B.
o RS Falling: Asset A is underperforming Asset B.
o RS Flat: Both assets are moving similarly.
5. Common Benchmarks:
o S&P 500 (for stocks)
o Sector ETFs (for sector analysis)
o Gold/USD Index (for commodities & currencies)
Relative Strength
Key Facts:
6. Tools Used:
o Relative Strength Line (on charts)
o RSI (Relative Strength Index) – NOT the same as RSA, but often confused.
o Ratio Charts (e.g., AAPL/SPY)
o Moving Averages on RS Line (for trends)
Interpretation of RS Trends
RS Movement Market Implication
Upward Trend Stronger than the benchmark → bullish signal
Downward Trend Weaker than the benchmark → bearish signal
Sideways Moving in line with the benchmark
Relative Strength
Key Facts on the History of Relative Strength (RS) Analysis
1. Origins in Dow Theory (Early 1900s)
o Charles Dow, the founder of the Dow Jones Industrial Average, introduced the idea that market
trends and strength could be compared across different indices and sectors.
2. Concept Formalized in the 1930s-1940s
o Robert D. Edwards & John Magee discussed relative strength in their classic book Technical
Analysis of Stock Trends (1948), emphasizing price comparisons.
3. Developed Further by Momentum Investors (1960s-1970s)
o Investors like George Chestnutt and James P. O’Shaughnessy used relative strength to create
momentum-based investing strategies.
Relative Strength
Key Facts on the History of Relative Strength (RS) Analysis
4. Widespread Use in the 1980s by Institutional Investors
o Investment firms like William O’Neil’s CAN SLIM approach (from How to Make Money in Stocks)
incorporated relative strength as a key stock-picking tool.
5. Modern Quantitative & Algorithmic Enhancements (1990s-Present)
o With the rise of computing power, relative strength is now widely used in quantitative trading, factor
investing, and ETFs.
o Institutions and traders use relative strength models to rank assets and optimize portfolios.
6. Not to be Confused with RSI (Relative Strength Index)
o The Relative Strength Index (RSI), developed by J. Welles Wilder in 1978, is a momentum oscillator
measuring overbought/oversold conditions, whereas relative strength analysis compares two assets.
Relative Strength Ratio
Presented By :
This Content is Copyright Reserved Rights Copyright 2025@PTAIndia
Relative Strength Ratio
Key Facts:
1. Definition: The Relative Strength Ratio (RSR) compares the price performance of one asset to
another (benchmark or another asset).
2. Formula:
Relative Strength Ratio=Price of Asset A/Price of Asset B
3. Purpose: Used to identify outperforming and underperforming assets to make trading and
investment decisions.
4. Common Benchmarks:
o S&P 500 (SPY) → for individual stocks
o Sector ETFs → to compare sector performance
o Gold, USD Index, Bonds → for macro comparisons
Relative Strength Ratio
Key Facts:
5. Usage in Trading:
o Identify strong vs. weak assets
o Find trends and market leadership
o Sector rotation strategies
o ETF and index performance analysis
6. Technical Enhancements:
o Apply moving averages on the RS ratio to smooth trends
o Use trendlines to confirm breakouts
o Compare with RSI (Relative Strength Index) for momentum confirmation
Relative Strength Ratio
Interpretation of the Relative Strength Ratio (RSR)
RS Ratio Movement Implication
RSR Rising Asset A is outperforming Asset B (bullish)
RSR Falling Asset A is underperforming Asset B (bearish)
RSR Sideways Both assets are performing similarly
Use Cases in Trading & Investing
✅ Stock Selection – Identify stocks outperforming the market
✅ Sector Rotation – Find the strongest/weakest sectors
✅ Market Breadth Analysis – Compare indices and ETFs
✅ Forex & Commodities – Compare currency pairs or commodities
Relative Strength Line
Presented By :
This Content is Copyright Reserved Rights Copyright 2025@PTAIndia
Relative Strength Line
What is the RS Line?
• The Relative Strength Line (also called the RS Ratio Line) plots the ratio of a stock (or asset)
versus a benchmark (e.g., S&P 500, sector ETF).
• It is used in technical analysis to measure whether a stock is outperforming, underperforming,
or moving in line with the market.
How to Interpret the RS Line
RS Line Direction Market Implication
RS Line Rising The stock is outperforming the benchmark (bullish).
RS Line Falling The stock is underperforming the benchmark (bearish).
RS Line Moving Sideways The stock is in line with the benchmark (neutral).
RS Line Making New Highs Strong uptrend; often seen before price breakouts.
RS Line Making New Lows Weakness in stock; may indicate a downtrend.
Relative Strength Line
Practical Uses in Trading
✅ Confirming Trends: If a stock price rises but the RS line is flat or falling, the
stock may not be a true leader.
✅ Early Warning Signal: If the RS line weakens before the price, it could indicate
a potential trend reversal.
✅ Breakout Strength: A stock making new highs with an RS line at new highs is a
strong signal.
✅ Sector & Market Rotation: Helps in identifying strong vs. weak sectors for
better asset allocation.
Relative Strength Charts
Presented By :
This Content is Copyright Reserved Rights Copyright 2025@PTAIndia
Relative Strength Charts
What is a Relative Strength Chart?
A Relative Strength (RS) Chart visually compares the performance of an asset against a benchmark
(e.g., S&P 500, sector ETFs, other stocks). It helps identify outperforming or underperforming assets.
Types of Relative Strength Charts
1. RS Line Chart
o Plots the Relative Strength Ratio (Asset Price ÷ Benchmark Price).
o Used in platforms like TradingView, ThinkorSwim, and MarketSmith.
2. Ratio Comparison Chart
o Displays price ratios (e.g., AAPL/SPY) on a separate price chart.
o Helps compare assets without looking at raw price movements.
Relative Strength Line
Relative Strength
Relative Strength Charts
Types of Relative Strength Charts
3. Point & Figure (P&F) Relative Strength Chart
o Used in technical analysis to filter out noise.
o Highlights clear trend changes in RS without time bias.
4. Scatter Plot RS Charts
o Compares multiple stocks/assets in different quadrants (e.g., relative strength vs. volatility).
How to Read a Relative Strength Chart
RS Chart Behavior Market Implication
RS Line Rising The stock/asset is outperforming the benchmark (bullish).
RS Line Falling The stock/asset is underperforming the benchmark (bearish).
RS Line Flat The stock is moving in line with the benchmark (neutral).
RS Line Hitting New Highs Very bullish, potential breakout leader.
RS Line Hitting New Lows Very bearish, sign of weakness.
Relative Strength Charts
How to Use RS Charts for Trading & Investing
✅ Confirm Price Trends: If a stock's price is rising but the RS line is flat or
falling, it's not truly leading the market.
✅ Identify Strongest Sectors: Compare sector ETFs (e.g., XLF, XLK) to the
S&P 500 to see sector rotation.
✅ Stock Selection: Prioritize stocks with an RS line making new highs
(strongest performers).
✅ Early Warning Signals: If the RS line starts dropping before the price, a
potential reversal is coming.
✅ Pair Trading: Compare two assets directly (e.g., Growth vs. Value, Gold vs.
S&P 500).
Relative Strength
Percentage Relative Strength (PRS)
Presented By :
This Content is Copyright Reserved Rights Copyright 2025@PTAIndia
Percentage Relative Strength (PRS)
1. Definition: Percentage Relative Strength (PRS) measures the percentage change in an asset's price
relative to a benchmark over a specific period.
2. Formula: PRS= % Change of Asset / % Change of Benchmark
3. Purpose: Helps traders and investors compare the performance of an asset to the overall market or
another asset.
4. Interpretation:
o PRS > 100 → Asset is outperforming the benchmark.
o PRS < 100 → Asset is underperforming the benchmark.
o PRS = 100 → Asset and benchmark are moving identically.
5. Common Benchmarks:
o S&P 500 (SPY) for stock comparison.
o Sector ETFs for industry strength analysis.
o Gold, USD Index, Bonds for macroeconomic comparisons.
Percentage Relative Strength (PRS)
Use Cases in Trading & Investing
✅ Stock Selection – Identify the strongest-performing stocks compared to the market.
✅ Sector Rotation – Compare sector ETFs to find leading industries.
✅ Market Breadth Analysis – Identify broad market strength/weakness.
✅ Short-Term Trading – Spot short-term outperformers for momentum trades.
✅ ETF & Index Investing – Compare ETFs or indices for relative performance trends.
Interpretation of Percentage Relative Strength (PRS)
PRS Value Implication
PRS > 120 Strong outperformance (bullish signal)
PRS 100-120 Moderate outperformance
PRS 80-100 Slight underperformance
PRS < 80 Significant underperformance (bearish signal)
Percentage Relative Strength (PRS)
Comparison: Percentage Relative Strength vs. Relative Strength Ratio (RSR)
Feature Percentage Relative Strength (PRS) Relative Strength Ratio (RSR)
Definition Measures percentage outperformance Compares price ratio of two assets
Formula
% Change of Asset / % Change of
Benchmark
Asset Price / Benchmark Price
Fixed Range? Yes (scaled to 100) No fixed range
Usage Short-term performance comparison Long-term trend analysis
Interpretation
PRS > 100 = Outperformance, < 100 =
Underperformance
Rising = Outperformance, Falling =
Underperformance
Ranking with Relative Strength (RS)
Presented By :
This Content is Copyright Reserved Rights Copyright 2025@PTAIndia
Ranking with Relative Strength (RS)
Key Facts:
1. Definition: Ranking with Relative Strength (RS) involves ordering stocks, sectors, or assets
based on their RS performance compared to a benchmark.
2. Purpose: Helps traders/investors identify market leaders and filter out weak assets for better
decision-making.
3. Calculation Methods:
o Relative Strength Ratio (RSR): RS=Price of Asset A/ Price of Benchmark
o Percentage Relative Strength (PRS): PRS = % Change in Assets/ % Change in Benchmark
o Relative Strength Rank (0-99 Scale):
99 = Best-performing asset
1 = Worst-performing asset
Ranking with Relative Strength (RS)
Key Facts:
4. Common Benchmarks:
o S&P 500 (SPY) for individual stocks.
o Sector ETFs for industry comparisons.
o Bond Indexes, Gold, or USD Index for macro trends.
5. Used in Trading Strategies:
o Momentum Investing – Buy top-ranked stocks.
o Sector Rotation – Shift funds to high-RS sectors.
o Portfolio Allocation – Increase weighting in high-RS assets.
Ranking with Relative Strength (RS)
Comparison: Relative Strength Ranking vs. Other RS Metrics
Feature Relative Strength Ranking
Relative Strength Ratio
(RSR)
Percentage Relative Strength
(PRS)
Purpose
Ranks stocks/sectors from best to
worst
Compares two asset
prices
Measures % outperformance
Scale 1-99 (higher is better) No fixed range 100 = Benchmark performance
Best Used For Identifying top-performing assets Trend confirmation Short-term performance tracking
Common in CAN SLIM, momentum investing Technical analysis Market breadth analysis
Interpretation of Relative Strength Ranking
✅ Best Practice: Focus on stocks ranked 80+ for strong momentum investing.
RS Rank Value Implication
90-99 Top-performing stocks (strong buy candidates)
70-89 Moderately strong stocks (watchlist for potential buys)
50-69 Neutral performance (in line with the market)
30-49 Underperforming stocks (weak)
1-29 Poor performers (avoid or short)
Ranking with Relative Strength (RS)
How to Use RS Ranking in Trading & Investing
✅ Stock Selection – Invest in stocks with the highest RS rankings (80+).
✅ Sector Rotation – Move into the strongest-ranked sectors for better returns.
✅ Risk Management – Avoid or short stocks with weak RS rankings (below 30).
✅ Portfolio Optimization – Allocate capital to the highest RS-ranked assets.
✅ Trend Confirmation – Combine with moving averages, RSI, and volume for confirmation.
Institutional vs. Private Investors
Presented By :
This Content is Copyright Reserved Rights Copyright 2025@PTAIndia
Institutional vs. Private Investors
3. Investment Behavior & Strategies
Aspect Institutional Investors Private Investors
Stock Market Trading Uses algorithmic trading, block orders Trades through retail brokers
Mutual Funds & ETFs Often create and manage funds Invest in publicly available funds
Hedge Funds
Employ sophisticated strategies like short-
selling, arbitrage
Rarely accessible to retail investors
Real Estate & Private Equity Direct ownership and development Usually limited to REITs or small properties
Bonds & Fixed Income
Direct purchases from issuers with better
yields
Invest through ETFs or retail bonds
4. Key Takeaways
 Institutional investors dominate market movements and get better access to investment opportunities.
 Private investors have more flexibility and can take personalized risks but have limited resources.
 Institutions use data-driven, algorithmic strategies, while retail investors often rely on personal
research.
Institutional vs. Private Investors
Feature Institutional Investors Private (Retail) Investors
Capital Size Large-scale (millions to billions) Small to moderate (personal savings)
Market Influence High – Can move markets with large trades Low – Individual trades have minimal impact
Investment Approach Data-driven, research-backed strategies Often based on personal research/emotions
Access to Markets
Exclusive access to private placements, IPOs, and
special instruments
Limited to public markets and retail investment options
Regulatory Oversight Strictly regulated (SEC, central banks, etc.) Less regulation but subject to tax laws
Execution Speed High-frequency, algorithmic trading Manual or brokerage-dependent execution
Investment Horizon Long-term and short-term (depending on strategy)
Usually long-term, but some engage in short-term
trading
Fees & Costs Lower fees due to scale and negotiation power Higher fees (brokerage, fund management)
Risk Management Advanced risk models, hedging strategies Limited hedging, may rely on stop-loss orders
Leverage & Derivatives Extensive use of leverage, options, swaps Limited access, mostly margin accounts
Investment Knowledge Expert teams with analysts, quants, and strategists Varies – from beginners to experienced traders
Chapter 10 – Relative Strength & Its Uses
SECTION 10 - COMPARATIVE MARKET ANALYSIS
Presented By :
This Content is Copyright Reserved Rights Copyright 2025@PTAIndia

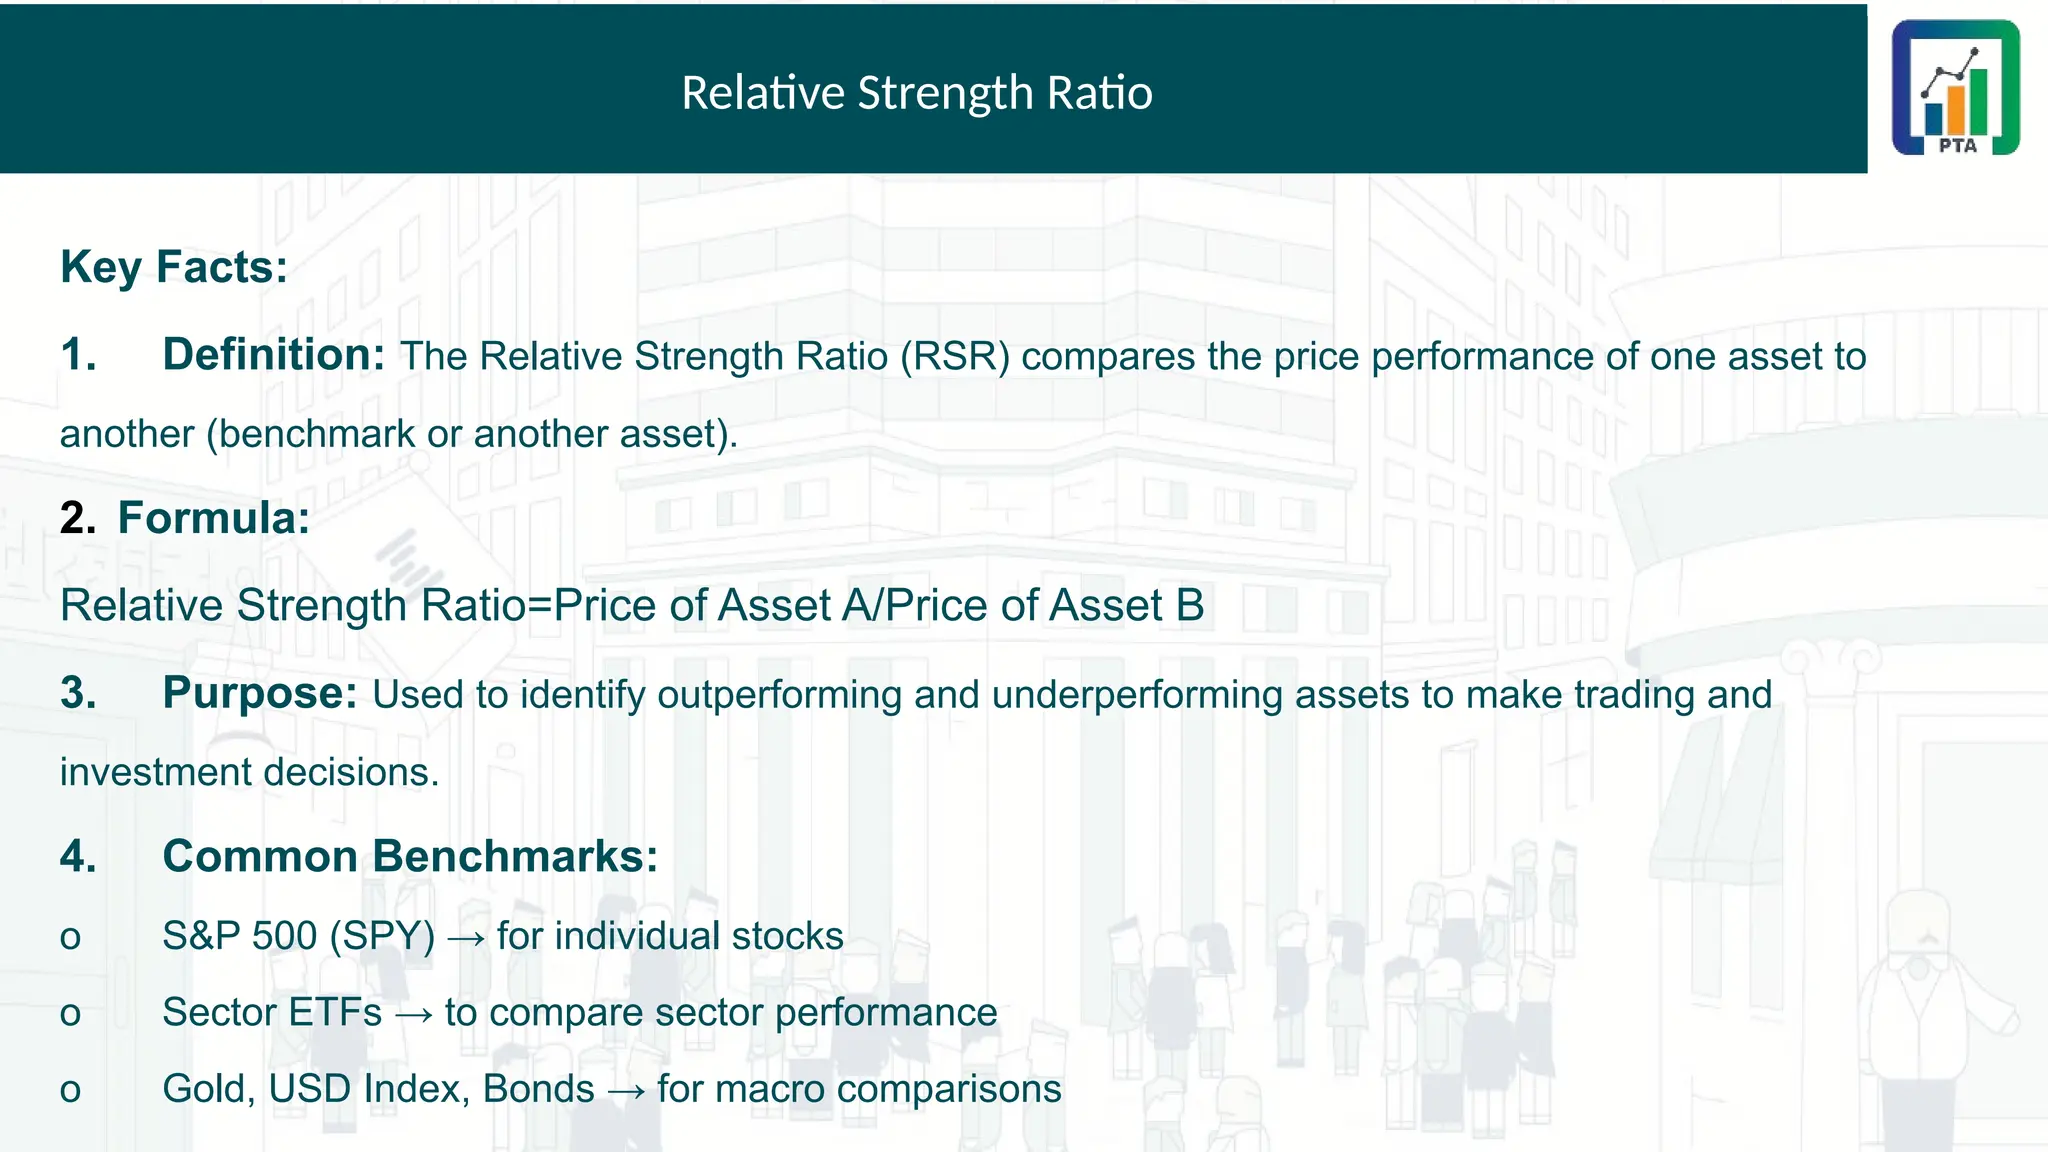
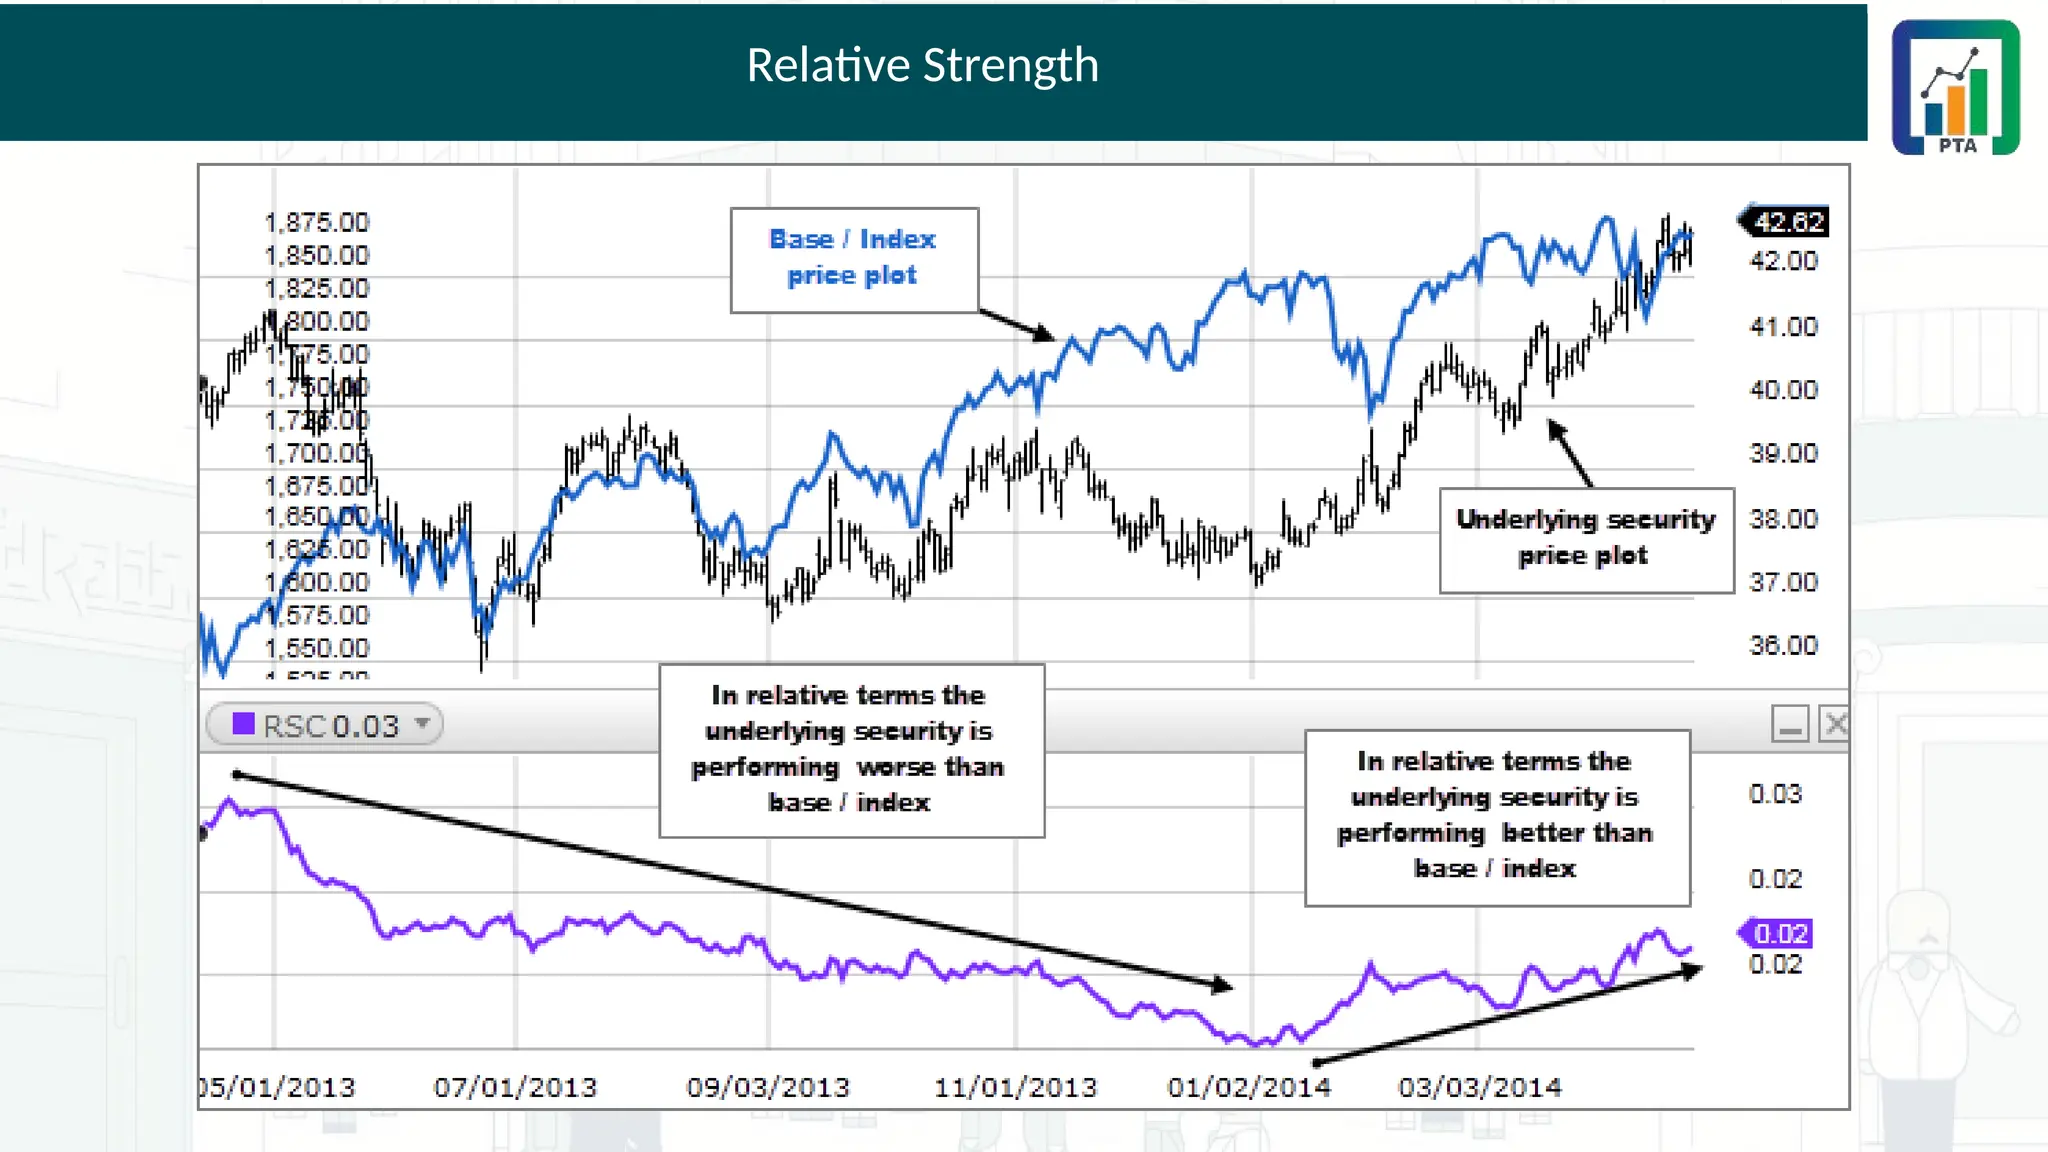
Section 10 - Chapter 9 - Introduction to Relative Strength

  • 1.
    Chapter 9 -Introduction to Relative Strength SECTION 10 - COMPARATIVE MARKET ANALYSIS Presented By : This Content is Copyright Reserved Rights Copyright 2025@PTAIndia
  • 2.
    Agenda  Introduction toRelative Strength  Relative Strength History  Assessing Relative Strength  Relative Strength Considerations  Ranking with Relative Strength  Difference between Institutional and Private Investors This Content is Copyright Reserved Rights Copyright 2025@PTAIndia
  • 3.
    Relative Strength Presented By: This Content is Copyright Reserved Rights Copyright 2025@PTAIndia
  • 4.
    Relative Strength Key Facts: 1.Definition: Relative Strength Analysis (RSA) compares the performance of one asset (stock, ETF, index) to another (benchmark or another asset) to identify stronger performers. 2. Purpose: Helps traders and investors find outperforming assets in a given market. 3. Formula: Relative Strength (RS)=Price of Asset A/Price of Asset B (Benchmark) 4. Interpretation: o RS Rising: Asset A is outperforming Asset B. o RS Falling: Asset A is underperforming Asset B. o RS Flat: Both assets are moving similarly. 5. Common Benchmarks: o S&P 500 (for stocks) o Sector ETFs (for sector analysis) o Gold/USD Index (for commodities & currencies)
  • 5.
    Relative Strength Key Facts: 6.Tools Used: o Relative Strength Line (on charts) o RSI (Relative Strength Index) – NOT the same as RSA, but often confused. o Ratio Charts (e.g., AAPL/SPY) o Moving Averages on RS Line (for trends) Interpretation of RS Trends RS Movement Market Implication Upward Trend Stronger than the benchmark → bullish signal Downward Trend Weaker than the benchmark → bearish signal Sideways Moving in line with the benchmark
  • 6.
    Relative Strength Key Factson the History of Relative Strength (RS) Analysis 1. Origins in Dow Theory (Early 1900s) o Charles Dow, the founder of the Dow Jones Industrial Average, introduced the idea that market trends and strength could be compared across different indices and sectors. 2. Concept Formalized in the 1930s-1940s o Robert D. Edwards & John Magee discussed relative strength in their classic book Technical Analysis of Stock Trends (1948), emphasizing price comparisons. 3. Developed Further by Momentum Investors (1960s-1970s) o Investors like George Chestnutt and James P. O’Shaughnessy used relative strength to create momentum-based investing strategies.
  • 7.
    Relative Strength Key Factson the History of Relative Strength (RS) Analysis 4. Widespread Use in the 1980s by Institutional Investors o Investment firms like William O’Neil’s CAN SLIM approach (from How to Make Money in Stocks) incorporated relative strength as a key stock-picking tool. 5. Modern Quantitative & Algorithmic Enhancements (1990s-Present) o With the rise of computing power, relative strength is now widely used in quantitative trading, factor investing, and ETFs. o Institutions and traders use relative strength models to rank assets and optimize portfolios. 6. Not to be Confused with RSI (Relative Strength Index) o The Relative Strength Index (RSI), developed by J. Welles Wilder in 1978, is a momentum oscillator measuring overbought/oversold conditions, whereas relative strength analysis compares two assets.
  • 8.
    Relative Strength Ratio PresentedBy : This Content is Copyright Reserved Rights Copyright 2025@PTAIndia
  • 9.
    Relative Strength Ratio KeyFacts: 1. Definition: The Relative Strength Ratio (RSR) compares the price performance of one asset to another (benchmark or another asset). 2. Formula: Relative Strength Ratio=Price of Asset A/Price of Asset B 3. Purpose: Used to identify outperforming and underperforming assets to make trading and investment decisions. 4. Common Benchmarks: o S&P 500 (SPY) → for individual stocks o Sector ETFs → to compare sector performance o Gold, USD Index, Bonds → for macro comparisons
  • 10.
    Relative Strength Ratio KeyFacts: 5. Usage in Trading: o Identify strong vs. weak assets o Find trends and market leadership o Sector rotation strategies o ETF and index performance analysis 6. Technical Enhancements: o Apply moving averages on the RS ratio to smooth trends o Use trendlines to confirm breakouts o Compare with RSI (Relative Strength Index) for momentum confirmation
  • 11.
    Relative Strength Ratio Interpretationof the Relative Strength Ratio (RSR) RS Ratio Movement Implication RSR Rising Asset A is outperforming Asset B (bullish) RSR Falling Asset A is underperforming Asset B (bearish) RSR Sideways Both assets are performing similarly Use Cases in Trading & Investing ✅ Stock Selection – Identify stocks outperforming the market ✅ Sector Rotation – Find the strongest/weakest sectors ✅ Market Breadth Analysis – Compare indices and ETFs ✅ Forex & Commodities – Compare currency pairs or commodities
  • 12.
    Relative Strength Line PresentedBy : This Content is Copyright Reserved Rights Copyright 2025@PTAIndia
  • 13.
    Relative Strength Line Whatis the RS Line? • The Relative Strength Line (also called the RS Ratio Line) plots the ratio of a stock (or asset) versus a benchmark (e.g., S&P 500, sector ETF). • It is used in technical analysis to measure whether a stock is outperforming, underperforming, or moving in line with the market. How to Interpret the RS Line RS Line Direction Market Implication RS Line Rising The stock is outperforming the benchmark (bullish). RS Line Falling The stock is underperforming the benchmark (bearish). RS Line Moving Sideways The stock is in line with the benchmark (neutral). RS Line Making New Highs Strong uptrend; often seen before price breakouts. RS Line Making New Lows Weakness in stock; may indicate a downtrend.
  • 14.
    Relative Strength Line PracticalUses in Trading ✅ Confirming Trends: If a stock price rises but the RS line is flat or falling, the stock may not be a true leader. ✅ Early Warning Signal: If the RS line weakens before the price, it could indicate a potential trend reversal. ✅ Breakout Strength: A stock making new highs with an RS line at new highs is a strong signal. ✅ Sector & Market Rotation: Helps in identifying strong vs. weak sectors for better asset allocation.
  • 15.
    Relative Strength Charts PresentedBy : This Content is Copyright Reserved Rights Copyright 2025@PTAIndia
  • 16.
    Relative Strength Charts Whatis a Relative Strength Chart? A Relative Strength (RS) Chart visually compares the performance of an asset against a benchmark (e.g., S&P 500, sector ETFs, other stocks). It helps identify outperforming or underperforming assets. Types of Relative Strength Charts 1. RS Line Chart o Plots the Relative Strength Ratio (Asset Price ÷ Benchmark Price). o Used in platforms like TradingView, ThinkorSwim, and MarketSmith. 2. Ratio Comparison Chart o Displays price ratios (e.g., AAPL/SPY) on a separate price chart. o Helps compare assets without looking at raw price movements.
  • 17.
  • 18.
  • 19.
  • 20.
    Relative Strength Charts Typesof Relative Strength Charts 3. Point & Figure (P&F) Relative Strength Chart o Used in technical analysis to filter out noise. o Highlights clear trend changes in RS without time bias. 4. Scatter Plot RS Charts o Compares multiple stocks/assets in different quadrants (e.g., relative strength vs. volatility). How to Read a Relative Strength Chart RS Chart Behavior Market Implication RS Line Rising The stock/asset is outperforming the benchmark (bullish). RS Line Falling The stock/asset is underperforming the benchmark (bearish). RS Line Flat The stock is moving in line with the benchmark (neutral). RS Line Hitting New Highs Very bullish, potential breakout leader. RS Line Hitting New Lows Very bearish, sign of weakness.
  • 21.
    Relative Strength Charts Howto Use RS Charts for Trading & Investing ✅ Confirm Price Trends: If a stock's price is rising but the RS line is flat or falling, it's not truly leading the market. ✅ Identify Strongest Sectors: Compare sector ETFs (e.g., XLF, XLK) to the S&P 500 to see sector rotation. ✅ Stock Selection: Prioritize stocks with an RS line making new highs (strongest performers). ✅ Early Warning Signals: If the RS line starts dropping before the price, a potential reversal is coming. ✅ Pair Trading: Compare two assets directly (e.g., Growth vs. Value, Gold vs. S&P 500).
  • 22.
  • 23.
    Percentage Relative Strength(PRS) Presented By : This Content is Copyright Reserved Rights Copyright 2025@PTAIndia
  • 24.
    Percentage Relative Strength(PRS) 1. Definition: Percentage Relative Strength (PRS) measures the percentage change in an asset's price relative to a benchmark over a specific period. 2. Formula: PRS= % Change of Asset / % Change of Benchmark 3. Purpose: Helps traders and investors compare the performance of an asset to the overall market or another asset. 4. Interpretation: o PRS > 100 → Asset is outperforming the benchmark. o PRS < 100 → Asset is underperforming the benchmark. o PRS = 100 → Asset and benchmark are moving identically. 5. Common Benchmarks: o S&P 500 (SPY) for stock comparison. o Sector ETFs for industry strength analysis. o Gold, USD Index, Bonds for macroeconomic comparisons.
  • 25.
    Percentage Relative Strength(PRS) Use Cases in Trading & Investing ✅ Stock Selection – Identify the strongest-performing stocks compared to the market. ✅ Sector Rotation – Compare sector ETFs to find leading industries. ✅ Market Breadth Analysis – Identify broad market strength/weakness. ✅ Short-Term Trading – Spot short-term outperformers for momentum trades. ✅ ETF & Index Investing – Compare ETFs or indices for relative performance trends. Interpretation of Percentage Relative Strength (PRS) PRS Value Implication PRS > 120 Strong outperformance (bullish signal) PRS 100-120 Moderate outperformance PRS 80-100 Slight underperformance PRS < 80 Significant underperformance (bearish signal)
  • 26.
    Percentage Relative Strength(PRS) Comparison: Percentage Relative Strength vs. Relative Strength Ratio (RSR) Feature Percentage Relative Strength (PRS) Relative Strength Ratio (RSR) Definition Measures percentage outperformance Compares price ratio of two assets Formula % Change of Asset / % Change of Benchmark Asset Price / Benchmark Price Fixed Range? Yes (scaled to 100) No fixed range Usage Short-term performance comparison Long-term trend analysis Interpretation PRS > 100 = Outperformance, < 100 = Underperformance Rising = Outperformance, Falling = Underperformance
  • 27.
    Ranking with RelativeStrength (RS) Presented By : This Content is Copyright Reserved Rights Copyright 2025@PTAIndia
  • 28.
    Ranking with RelativeStrength (RS) Key Facts: 1. Definition: Ranking with Relative Strength (RS) involves ordering stocks, sectors, or assets based on their RS performance compared to a benchmark. 2. Purpose: Helps traders/investors identify market leaders and filter out weak assets for better decision-making. 3. Calculation Methods: o Relative Strength Ratio (RSR): RS=Price of Asset A/ Price of Benchmark o Percentage Relative Strength (PRS): PRS = % Change in Assets/ % Change in Benchmark o Relative Strength Rank (0-99 Scale): 99 = Best-performing asset 1 = Worst-performing asset
  • 29.
    Ranking with RelativeStrength (RS) Key Facts: 4. Common Benchmarks: o S&P 500 (SPY) for individual stocks. o Sector ETFs for industry comparisons. o Bond Indexes, Gold, or USD Index for macro trends. 5. Used in Trading Strategies: o Momentum Investing – Buy top-ranked stocks. o Sector Rotation – Shift funds to high-RS sectors. o Portfolio Allocation – Increase weighting in high-RS assets.
  • 30.
    Ranking with RelativeStrength (RS) Comparison: Relative Strength Ranking vs. Other RS Metrics Feature Relative Strength Ranking Relative Strength Ratio (RSR) Percentage Relative Strength (PRS) Purpose Ranks stocks/sectors from best to worst Compares two asset prices Measures % outperformance Scale 1-99 (higher is better) No fixed range 100 = Benchmark performance Best Used For Identifying top-performing assets Trend confirmation Short-term performance tracking Common in CAN SLIM, momentum investing Technical analysis Market breadth analysis Interpretation of Relative Strength Ranking ✅ Best Practice: Focus on stocks ranked 80+ for strong momentum investing. RS Rank Value Implication 90-99 Top-performing stocks (strong buy candidates) 70-89 Moderately strong stocks (watchlist for potential buys) 50-69 Neutral performance (in line with the market) 30-49 Underperforming stocks (weak) 1-29 Poor performers (avoid or short)
  • 31.
    Ranking with RelativeStrength (RS) How to Use RS Ranking in Trading & Investing ✅ Stock Selection – Invest in stocks with the highest RS rankings (80+). ✅ Sector Rotation – Move into the strongest-ranked sectors for better returns. ✅ Risk Management – Avoid or short stocks with weak RS rankings (below 30). ✅ Portfolio Optimization – Allocate capital to the highest RS-ranked assets. ✅ Trend Confirmation – Combine with moving averages, RSI, and volume for confirmation.
  • 32.
    Institutional vs. PrivateInvestors Presented By : This Content is Copyright Reserved Rights Copyright 2025@PTAIndia
  • 33.
    Institutional vs. PrivateInvestors 3. Investment Behavior & Strategies Aspect Institutional Investors Private Investors Stock Market Trading Uses algorithmic trading, block orders Trades through retail brokers Mutual Funds & ETFs Often create and manage funds Invest in publicly available funds Hedge Funds Employ sophisticated strategies like short- selling, arbitrage Rarely accessible to retail investors Real Estate & Private Equity Direct ownership and development Usually limited to REITs or small properties Bonds & Fixed Income Direct purchases from issuers with better yields Invest through ETFs or retail bonds 4. Key Takeaways  Institutional investors dominate market movements and get better access to investment opportunities.  Private investors have more flexibility and can take personalized risks but have limited resources.  Institutions use data-driven, algorithmic strategies, while retail investors often rely on personal research.
  • 34.
    Institutional vs. PrivateInvestors Feature Institutional Investors Private (Retail) Investors Capital Size Large-scale (millions to billions) Small to moderate (personal savings) Market Influence High – Can move markets with large trades Low – Individual trades have minimal impact Investment Approach Data-driven, research-backed strategies Often based on personal research/emotions Access to Markets Exclusive access to private placements, IPOs, and special instruments Limited to public markets and retail investment options Regulatory Oversight Strictly regulated (SEC, central banks, etc.) Less regulation but subject to tax laws Execution Speed High-frequency, algorithmic trading Manual or brokerage-dependent execution Investment Horizon Long-term and short-term (depending on strategy) Usually long-term, but some engage in short-term trading Fees & Costs Lower fees due to scale and negotiation power Higher fees (brokerage, fund management) Risk Management Advanced risk models, hedging strategies Limited hedging, may rely on stop-loss orders Leverage & Derivatives Extensive use of leverage, options, swaps Limited access, mostly margin accounts Investment Knowledge Expert teams with analysts, quants, and strategists Varies – from beginners to experienced traders
  • 35.
    Chapter 10 –Relative Strength & Its Uses SECTION 10 - COMPARATIVE MARKET ANALYSIS Presented By : This Content is Copyright Reserved Rights Copyright 2025@PTAIndia