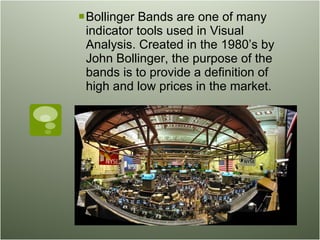
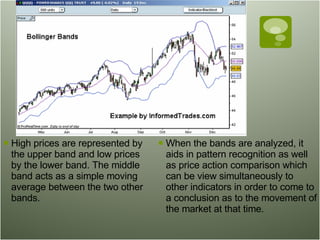
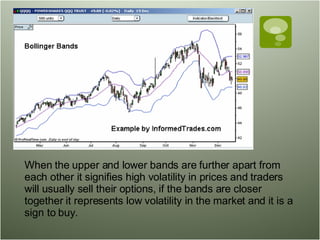
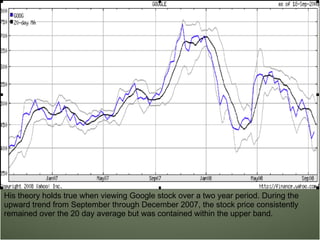
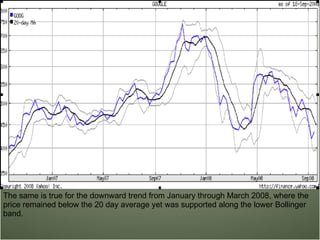
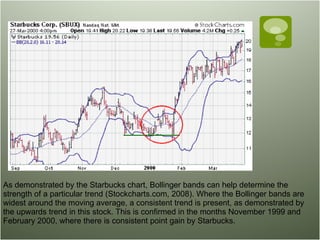
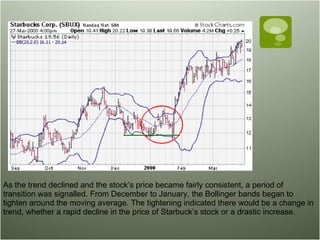
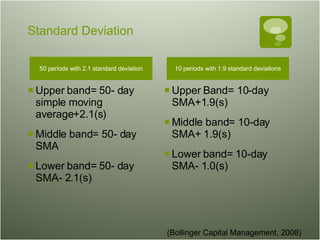
Bollinger Bands are a technical analysis indicator tool consisting of three bands plotted above and below a simple moving average. The bands are calculated as a set number of standard deviations from the moving average. When prices touch the upper or lower bands, it signals high or low volatility but does not necessarily indicate a trend change. The distance between the bands indicates the strength of the current trend, with tighter bands signaling lower volatility and wider bands indicating a strong trend. Bollinger Bands help analyze price action and pattern recognition to determine when to enter and exit positions.


![Bollinger Bands powerpoint presentation ]](https://cdn.slidesharecdn.com/ss_thumbnails/redandwhitesimpleminimalistformalthesisdefensepresentation1-260111204004-6282ee28-thumbnail.jpg?width=640&height=640&fit=bounds)


