Download to read offline
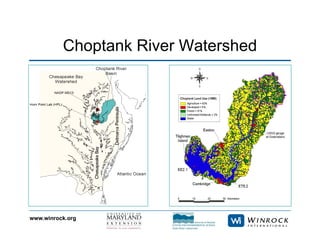
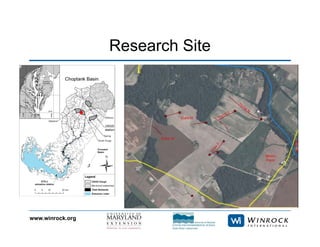
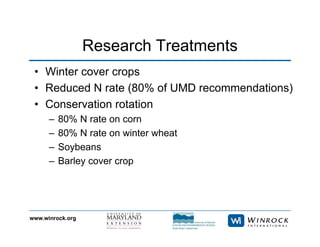


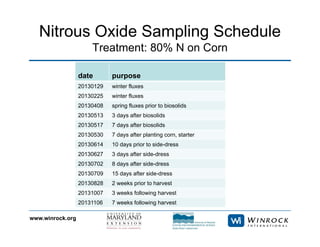

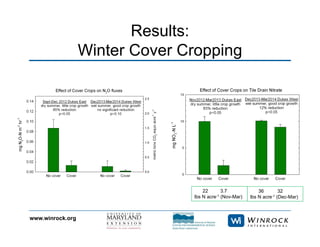
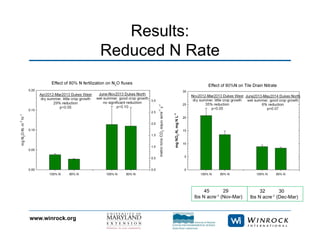
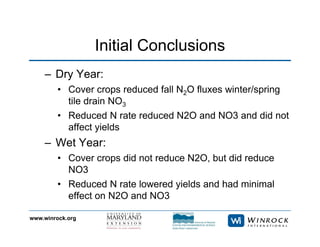

This document summarizes a study on reducing climate change and water quality impacts from grain production in Maryland's Eastern Shore. The study tested winter cover crops and reduced nitrogen fertilizer rate treatments. Key findings were that in a dry year, cover crops reduced fall nitrous oxide emissions and tile drain nitrate levels, while reduced nitrogen rate lowered emissions and nitrate without affecting yields. In a wet year, cover crops reduced nitrate but not emissions, and reduced nitrogen led to lower yields with minimal effects on emissions and nitrate. Future work involves using measurements to validate simulation models and estimate broader regional impacts to facilitate environmental market transactions.


