Download to read offline
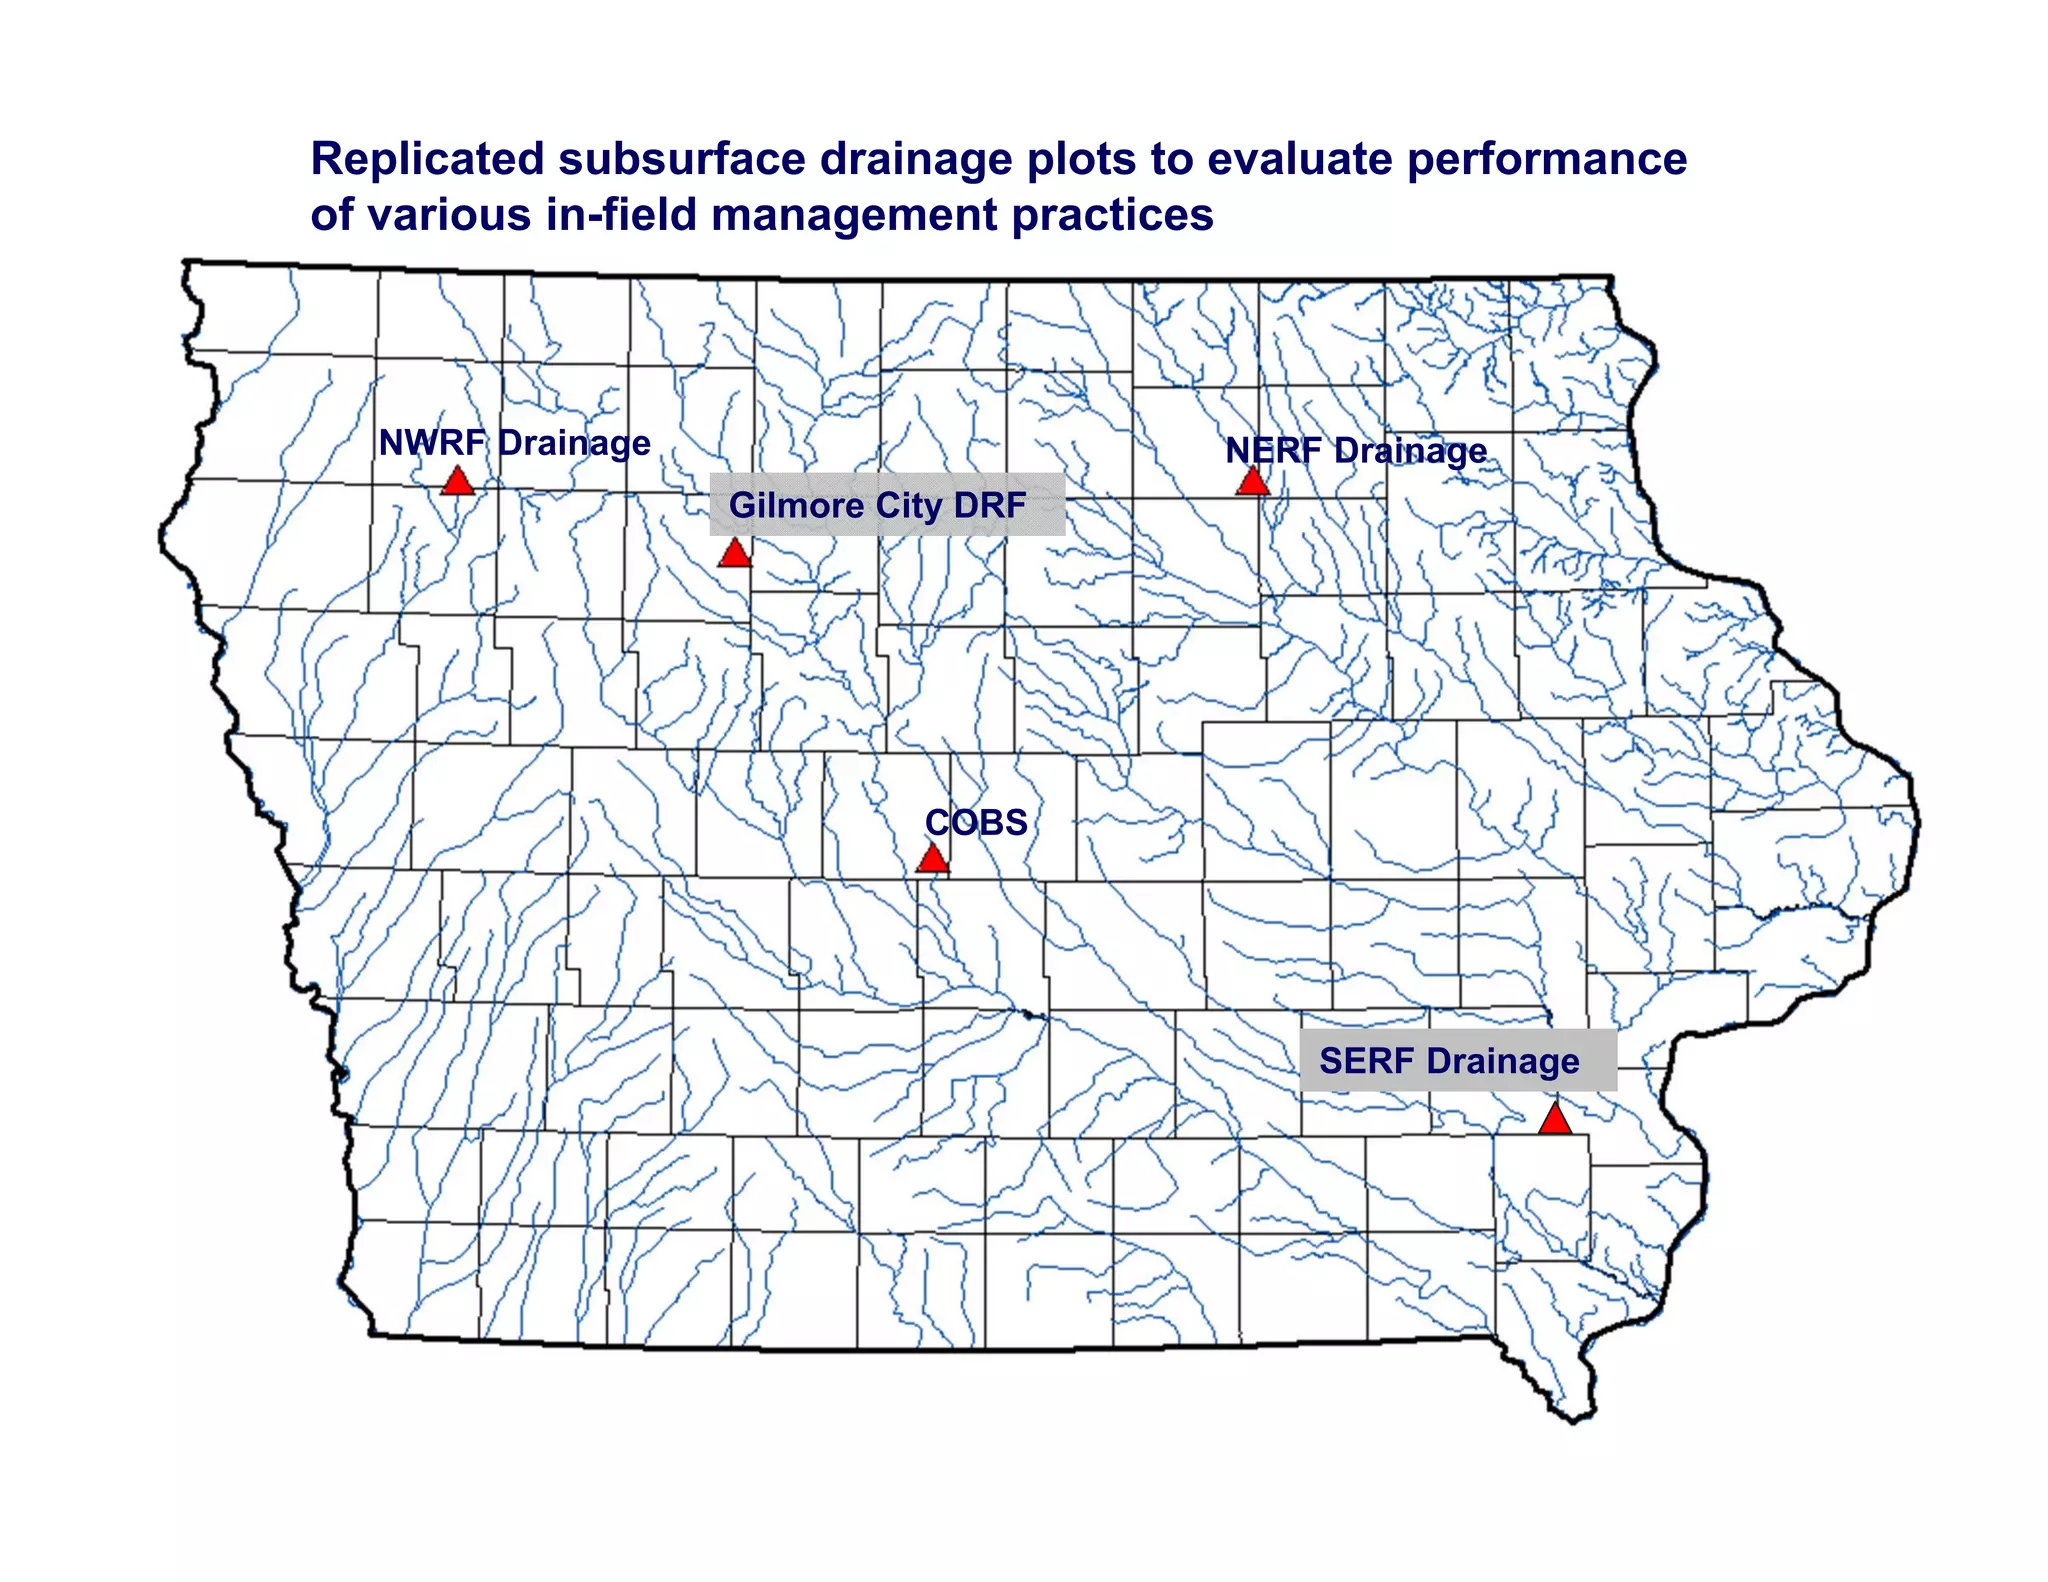
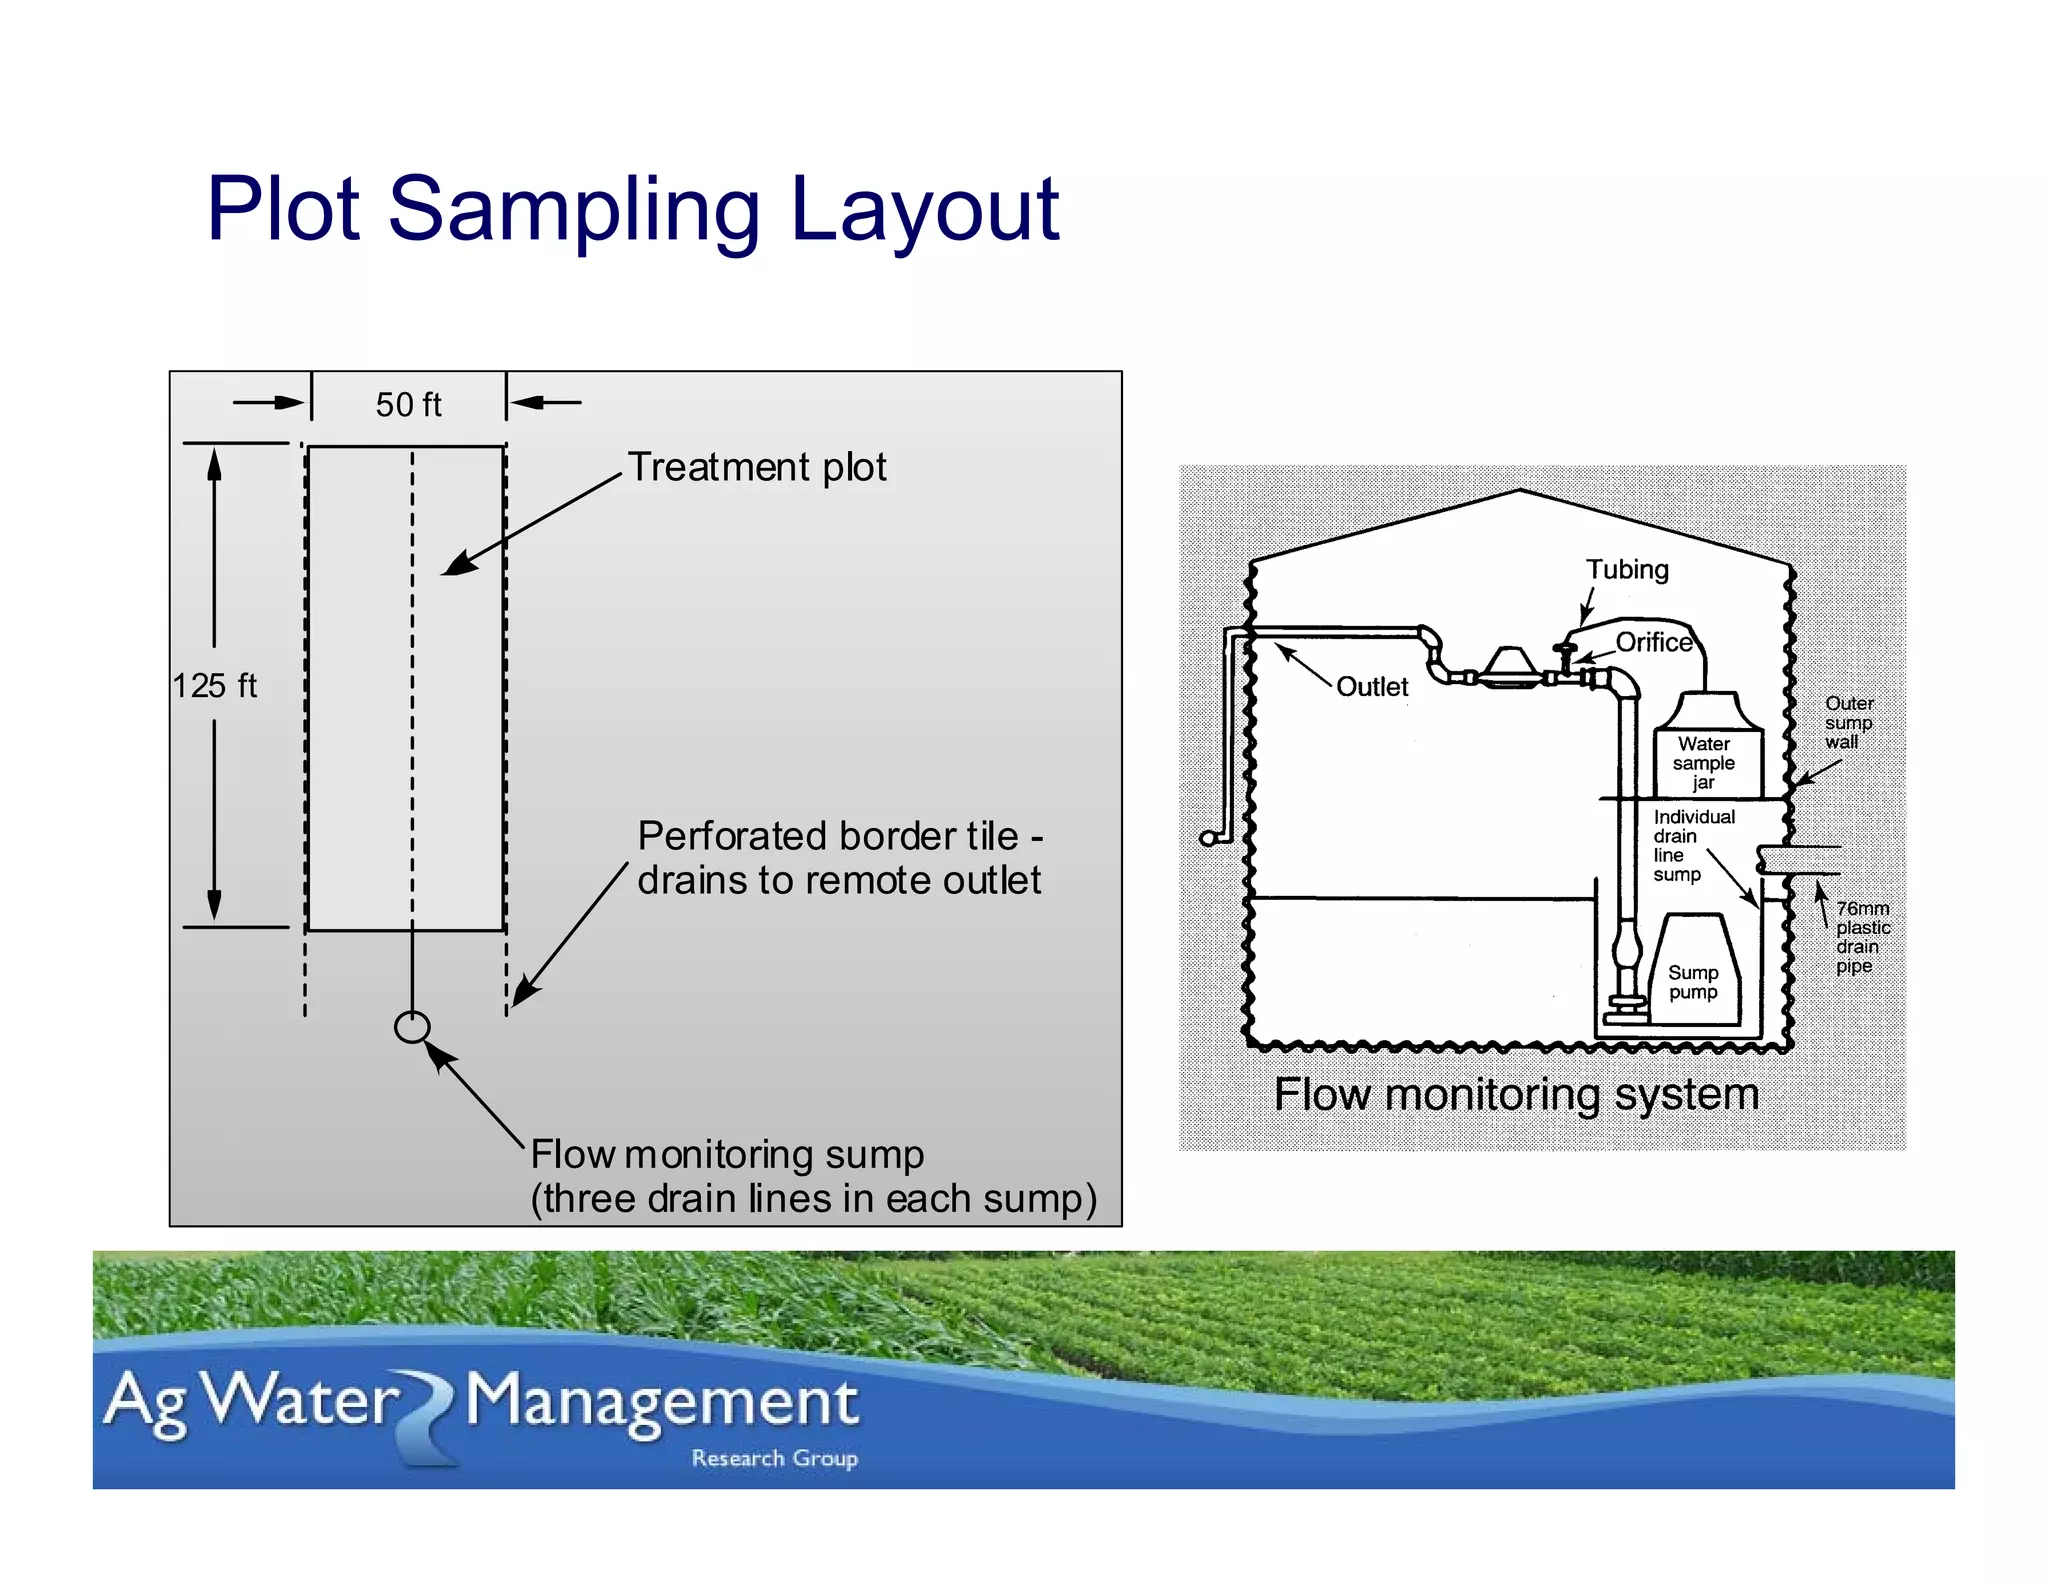
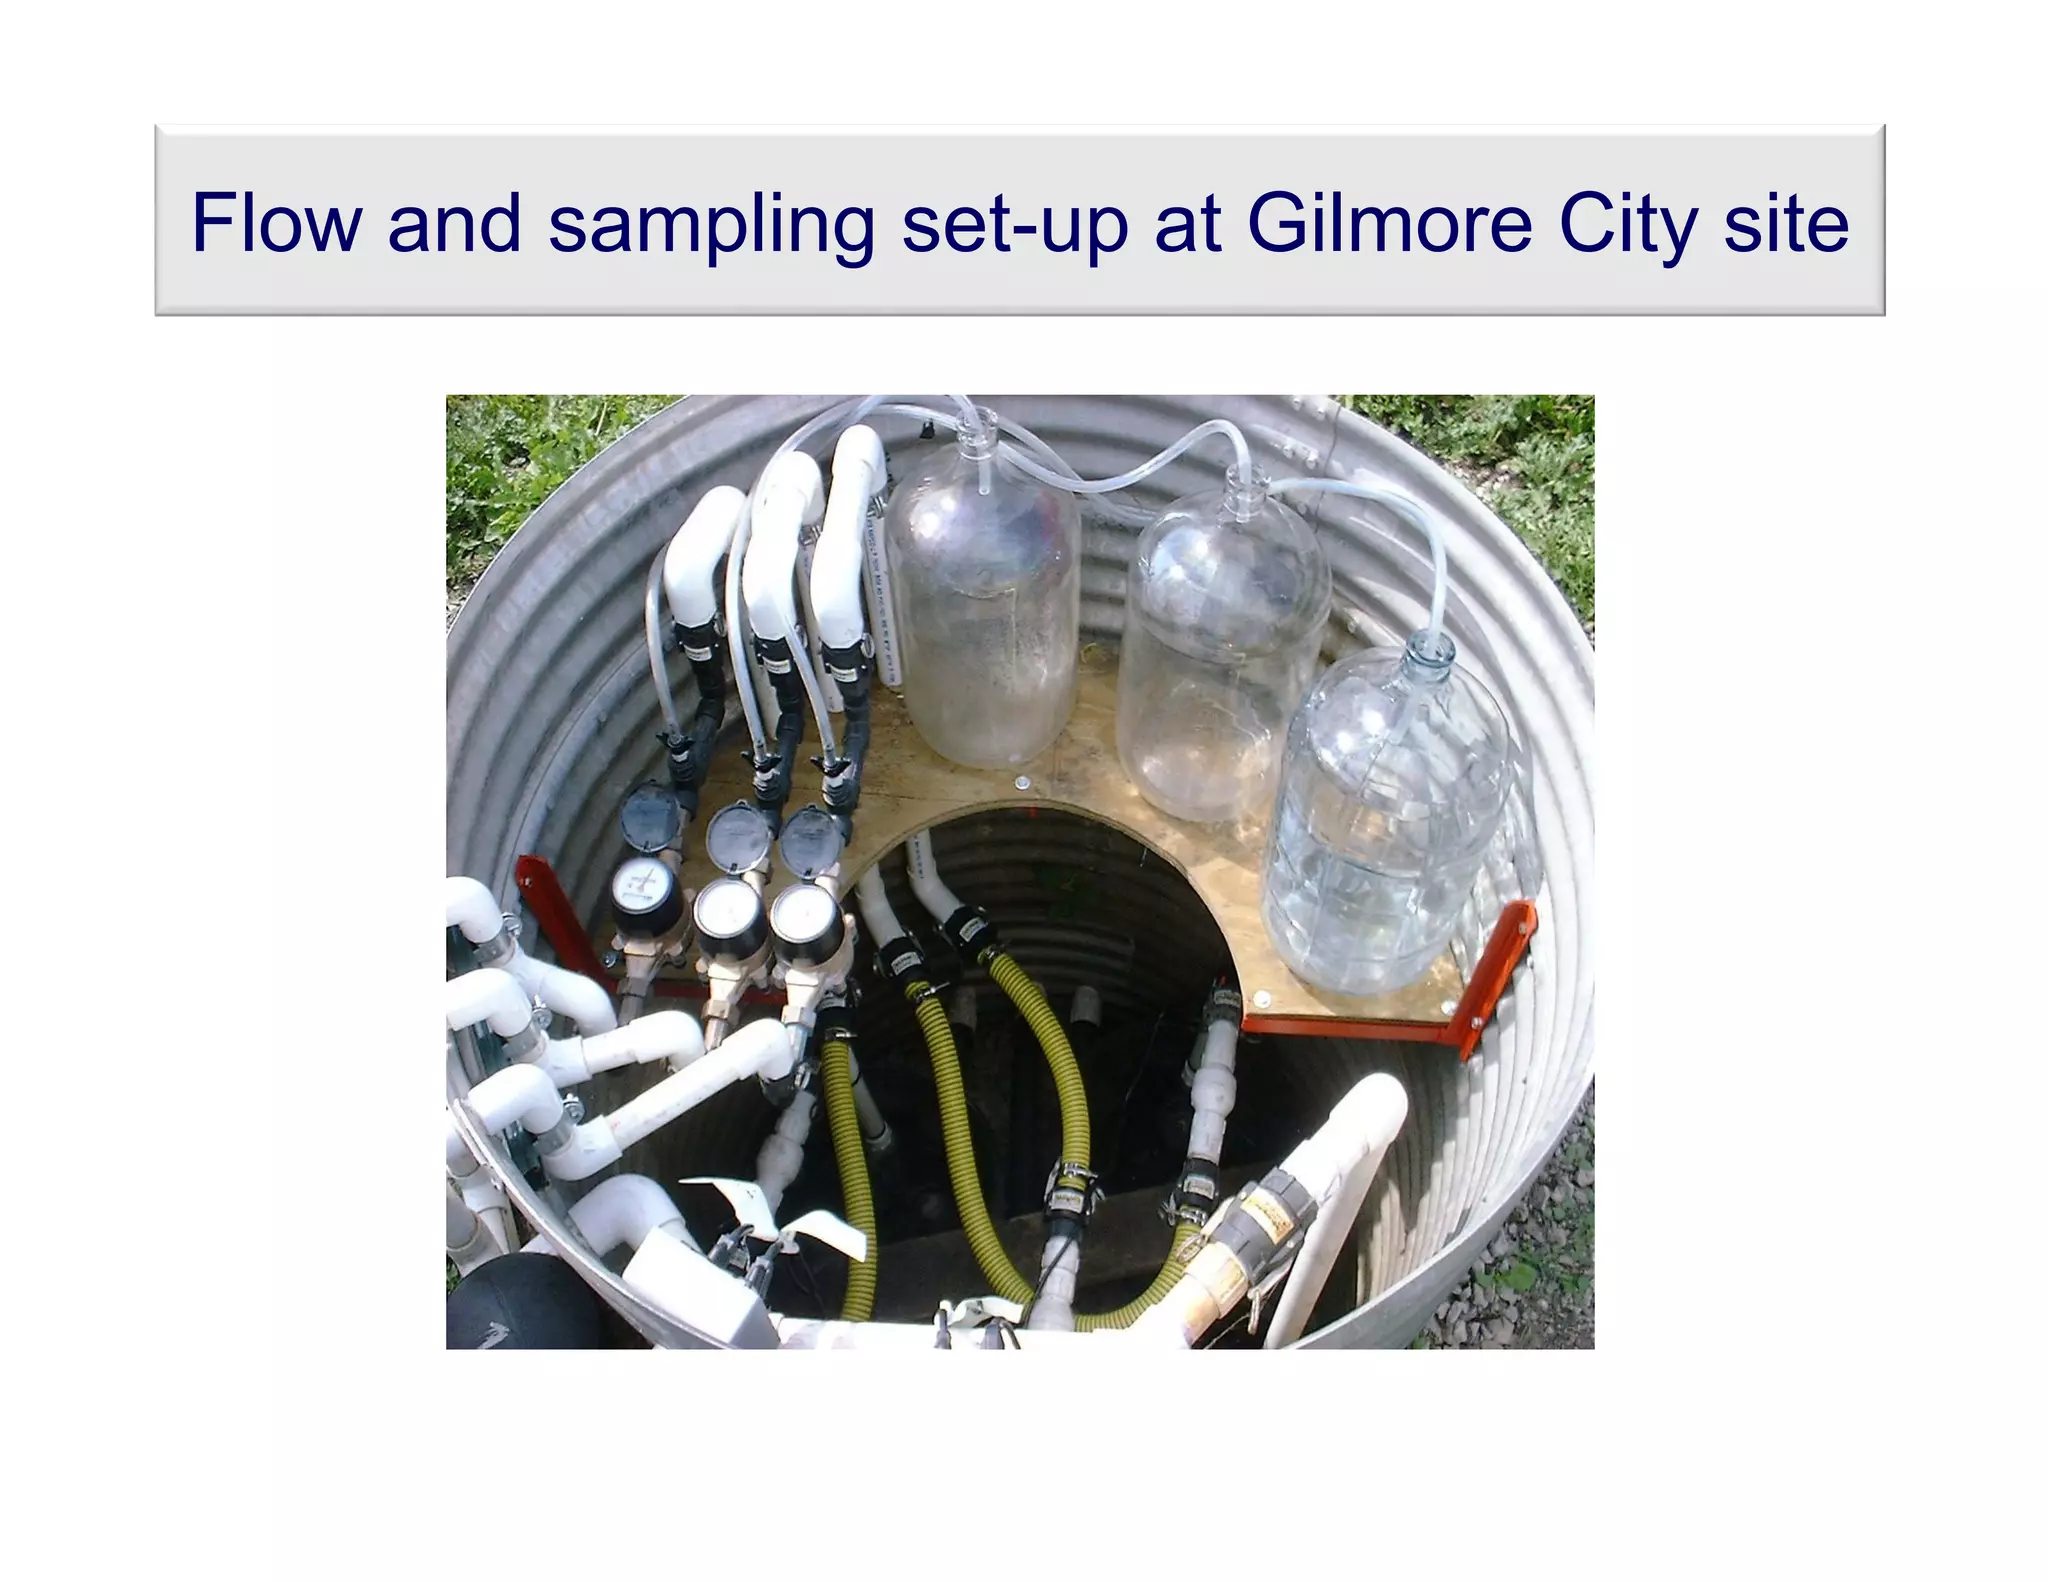
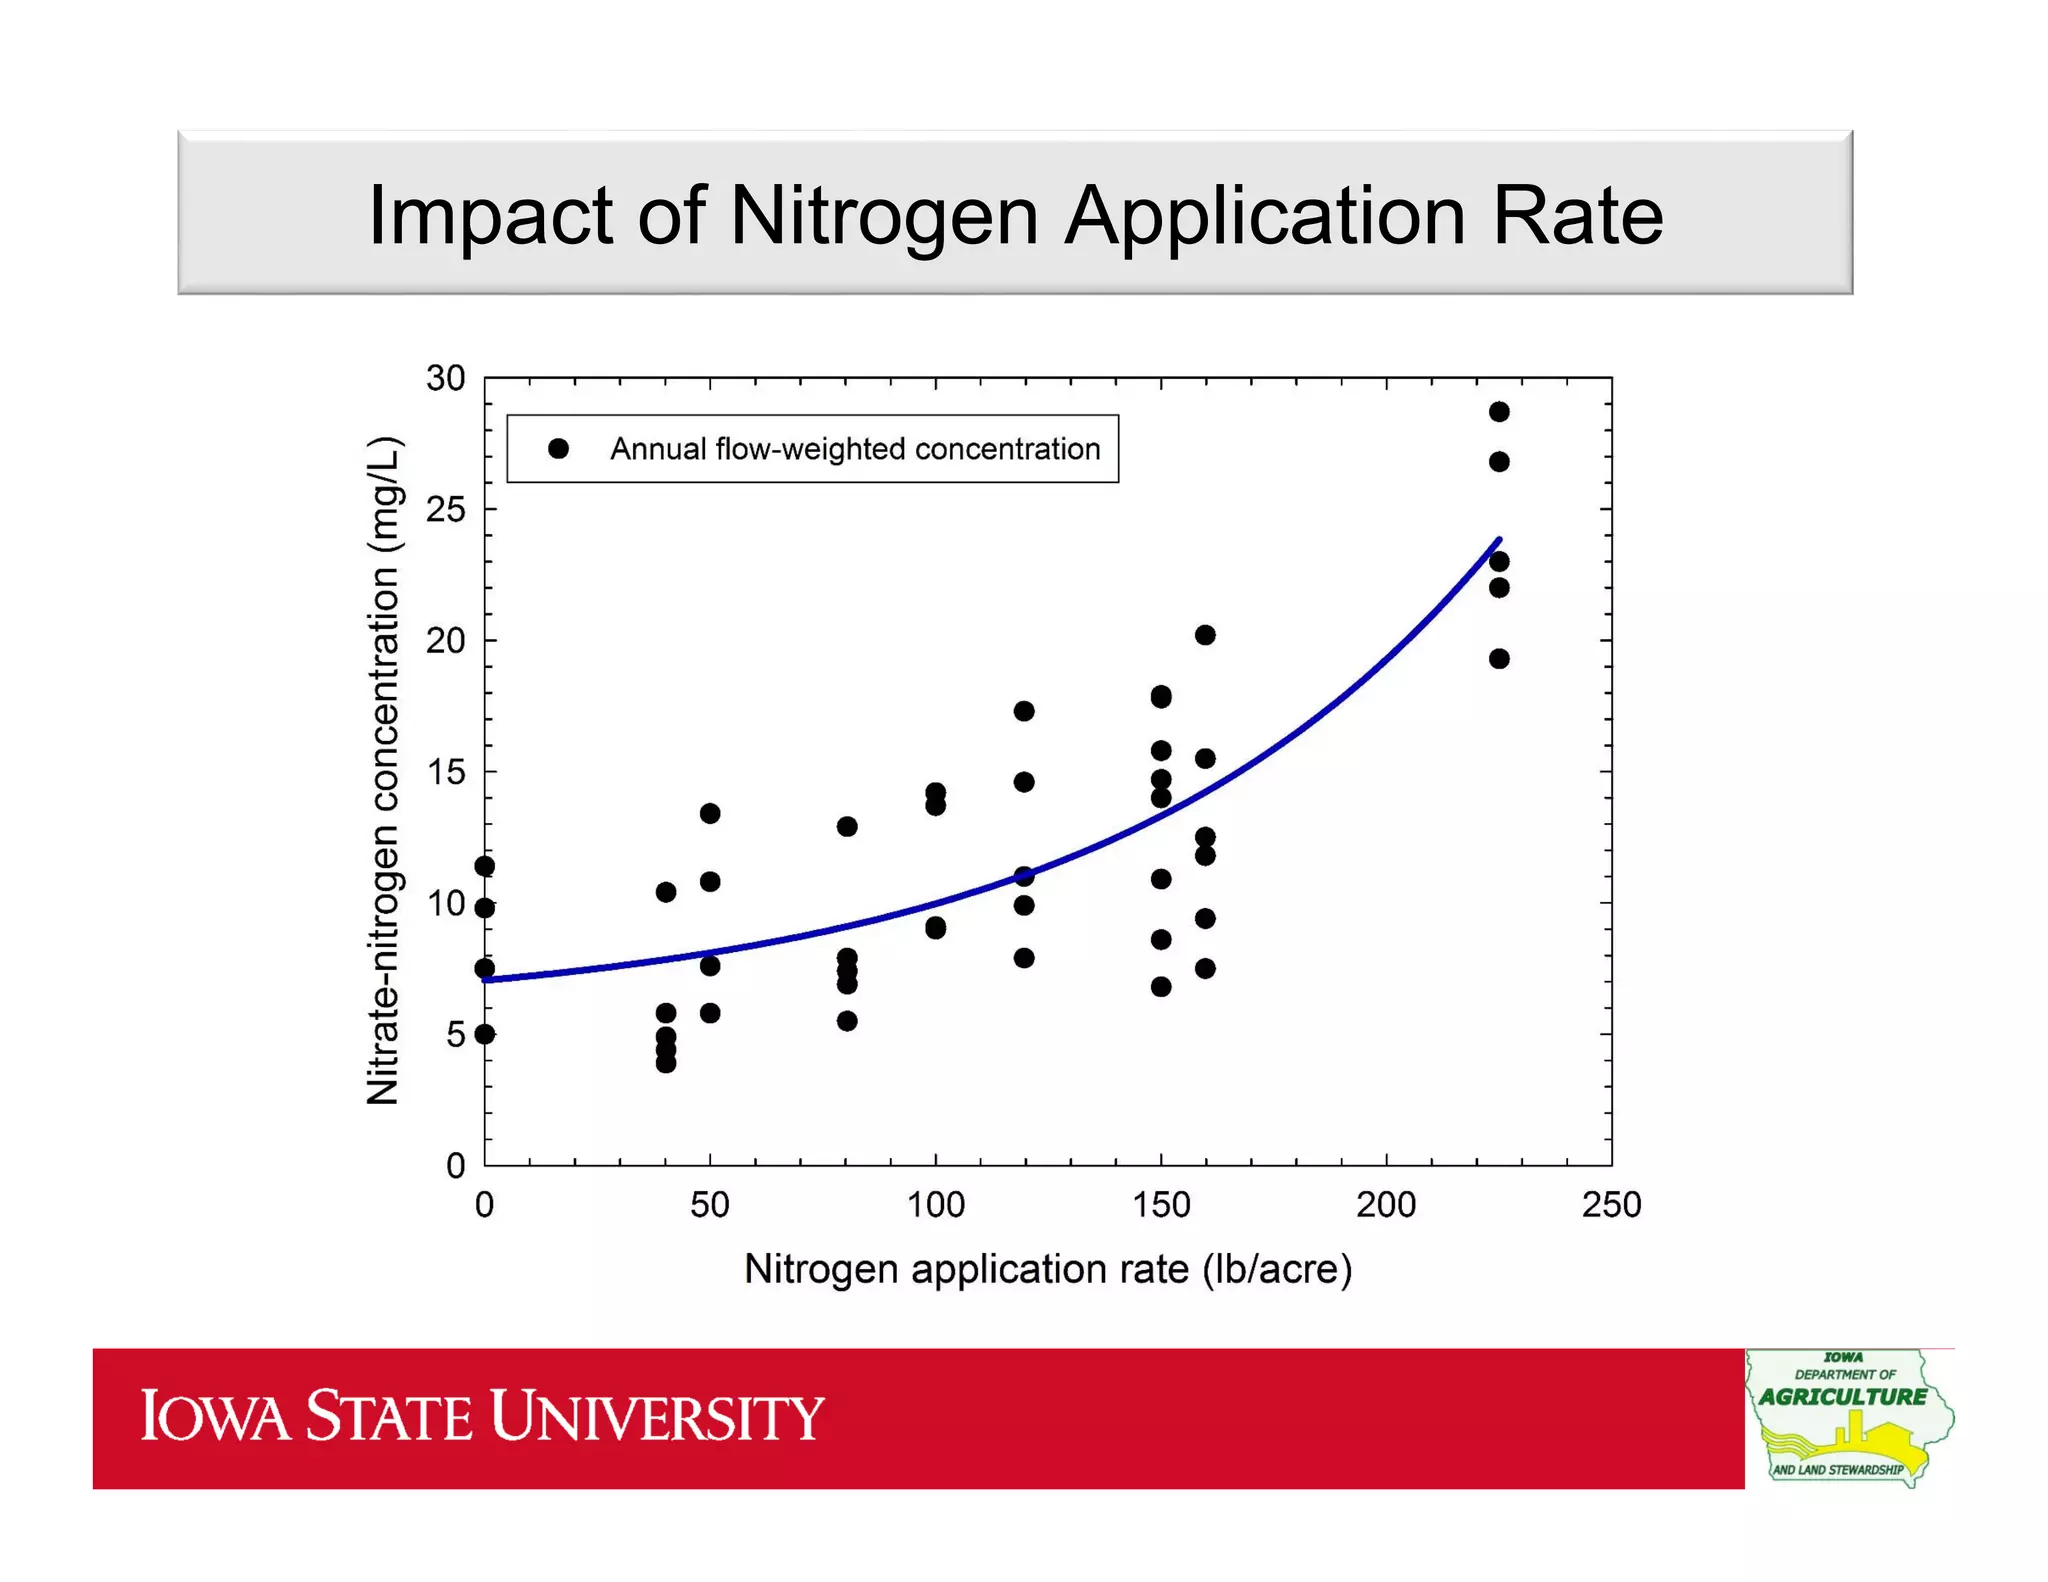
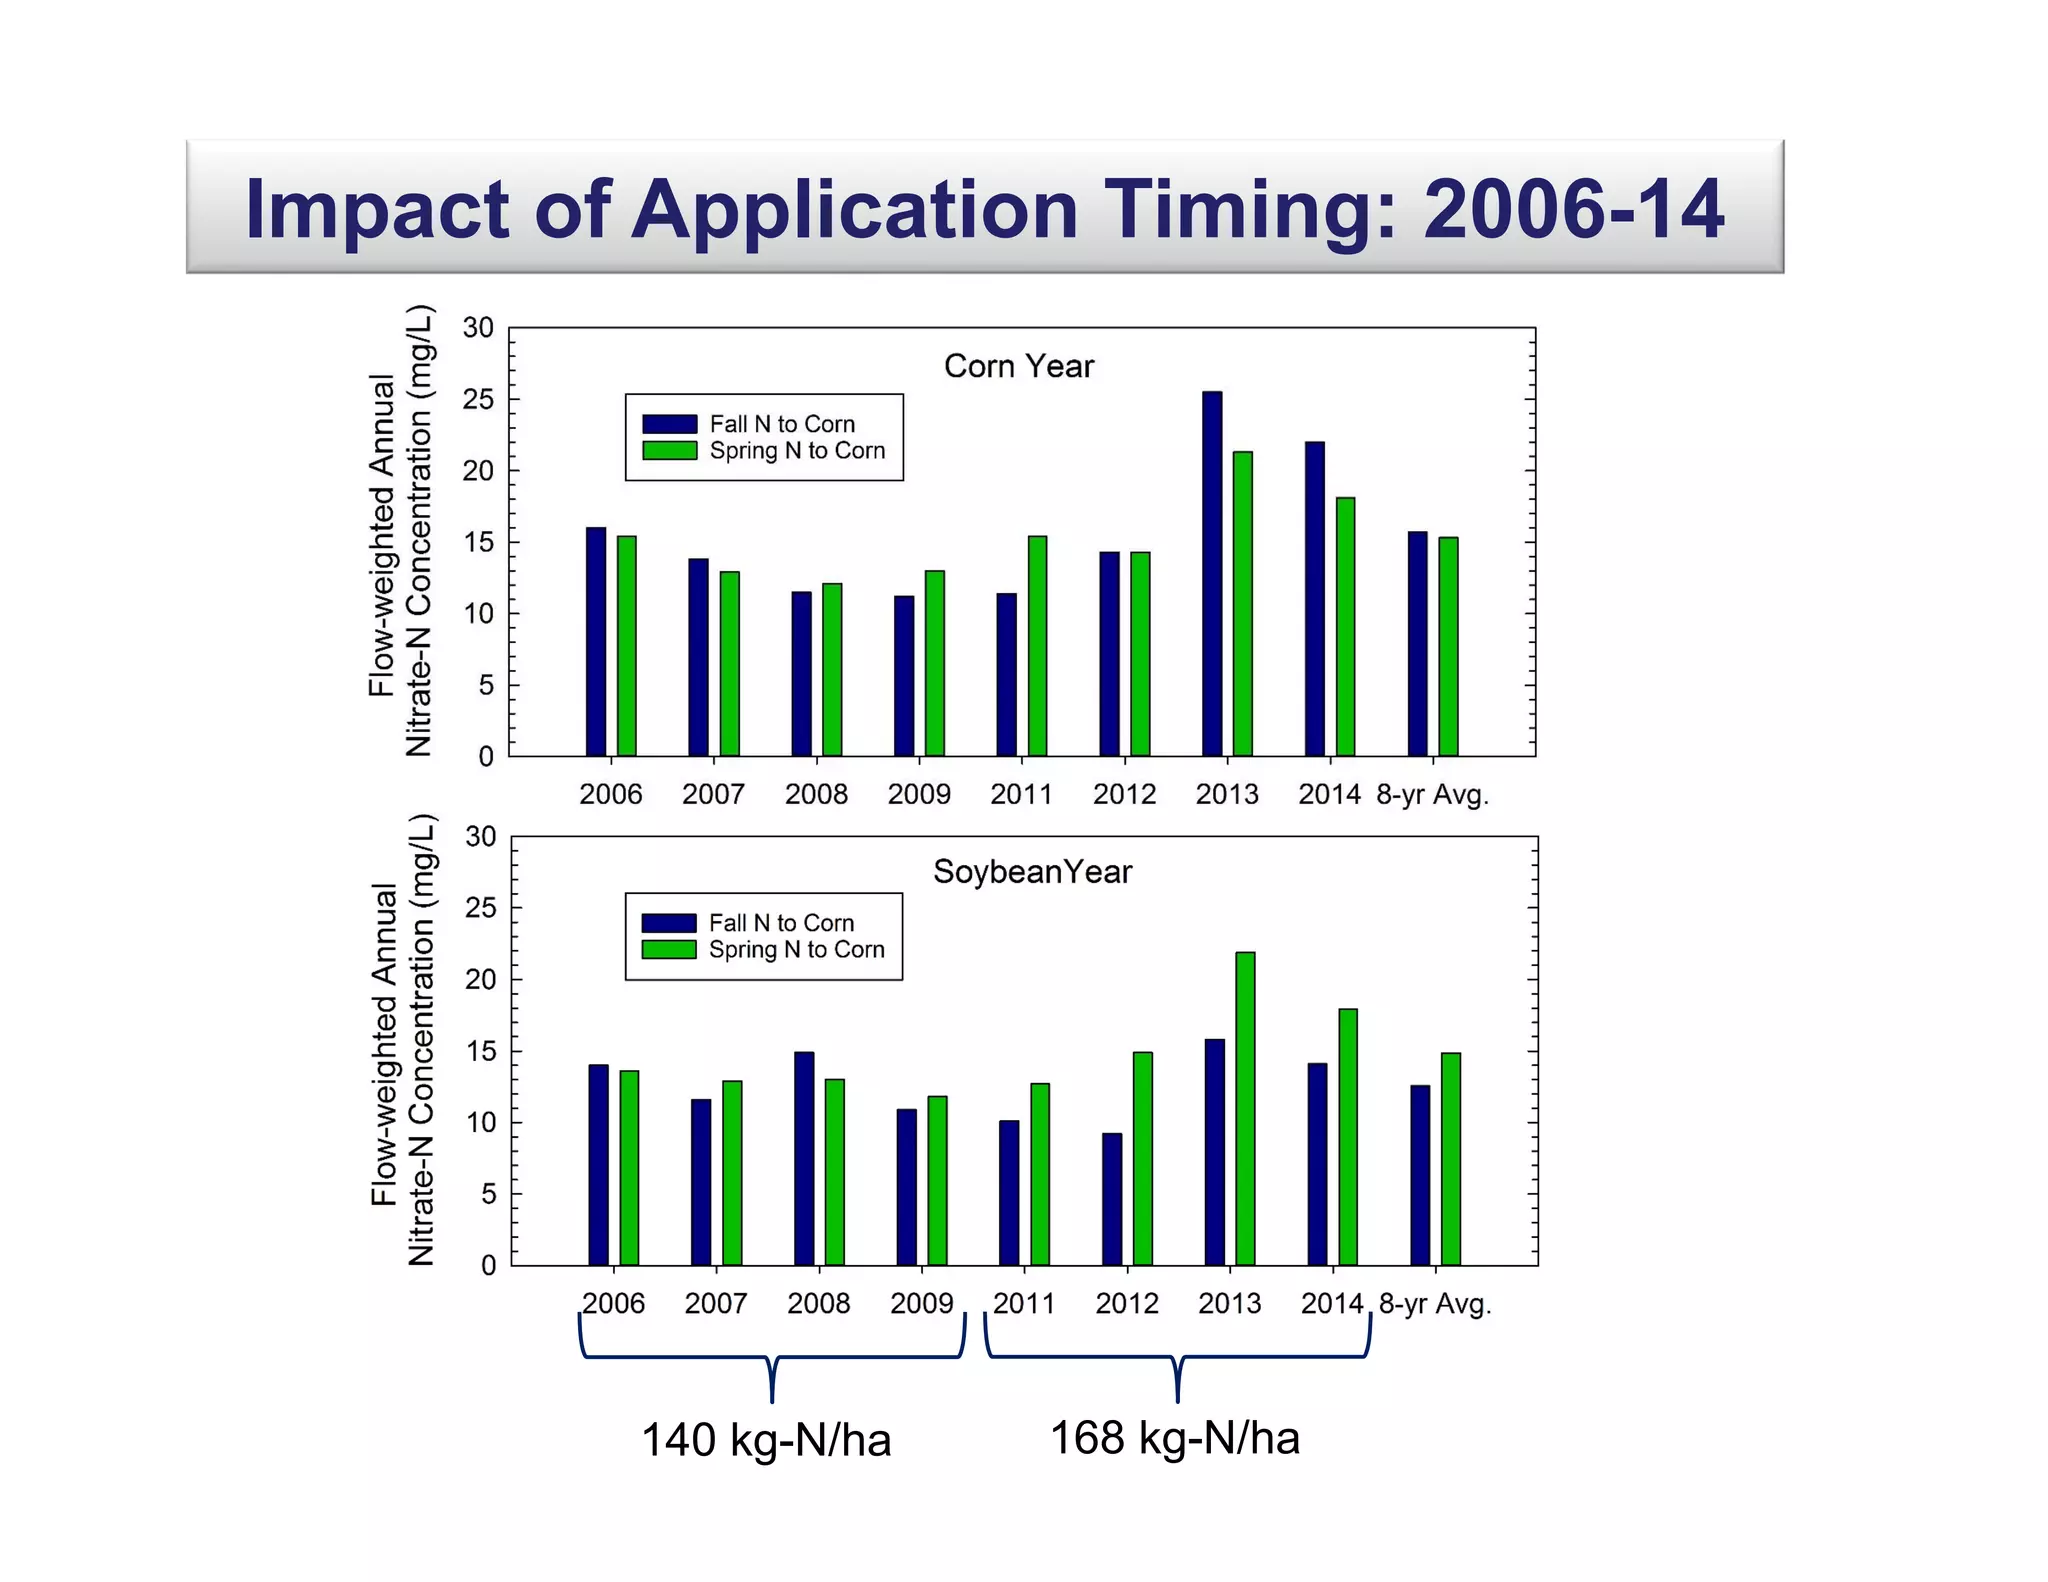
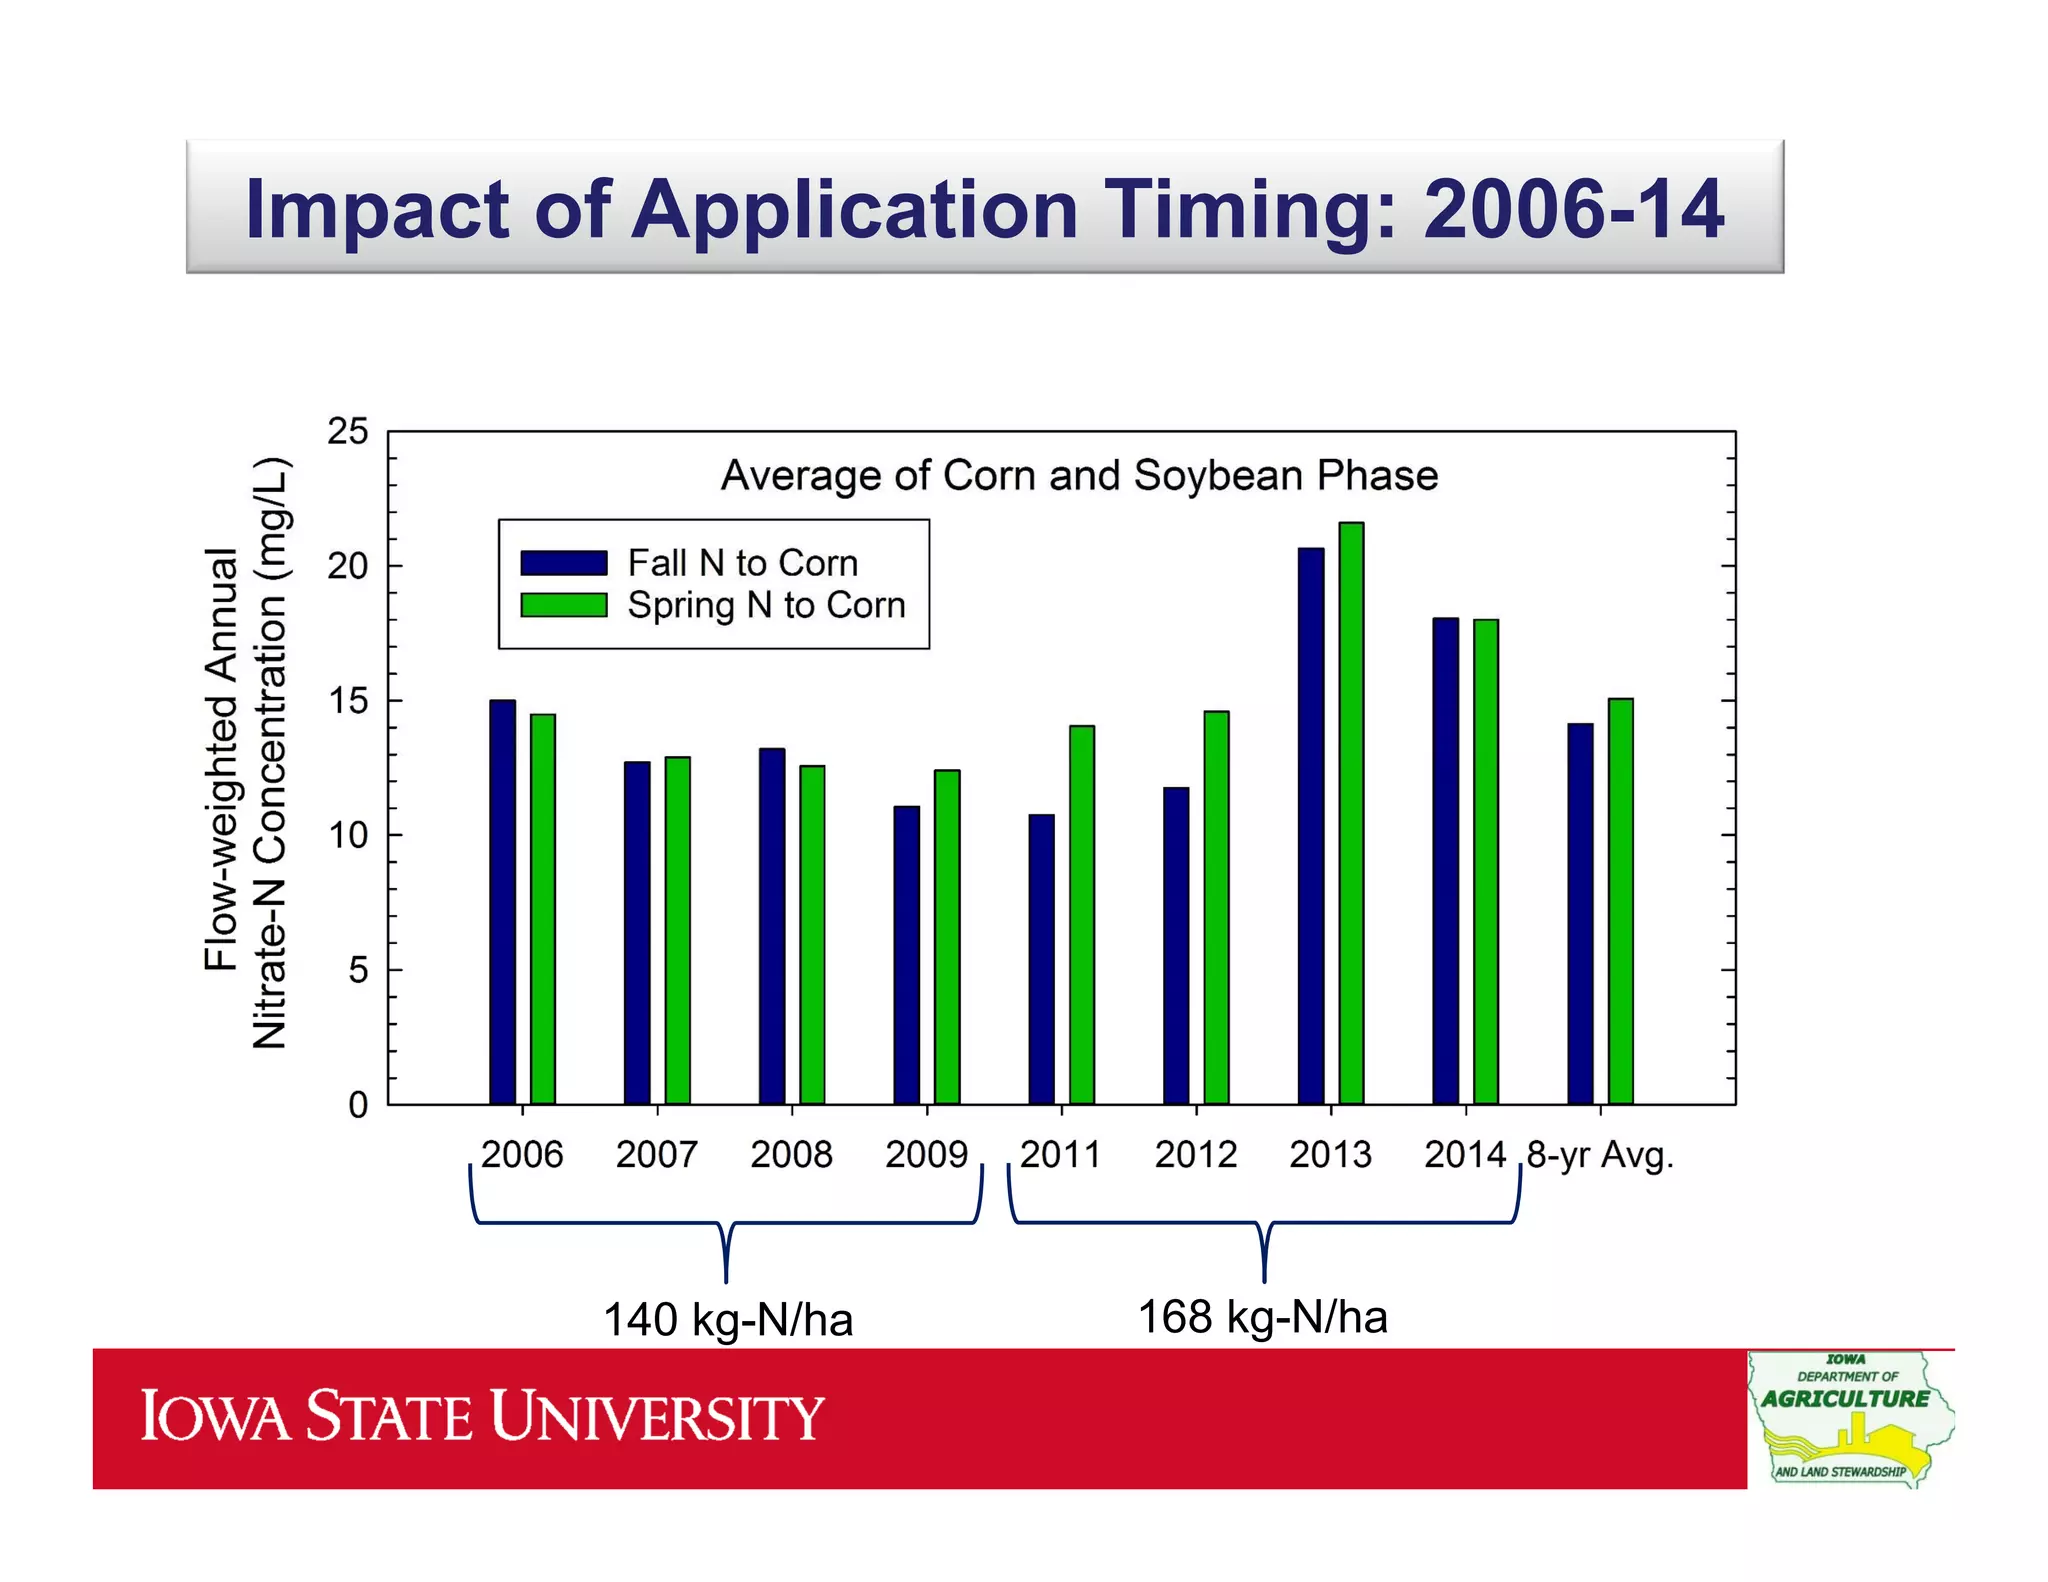
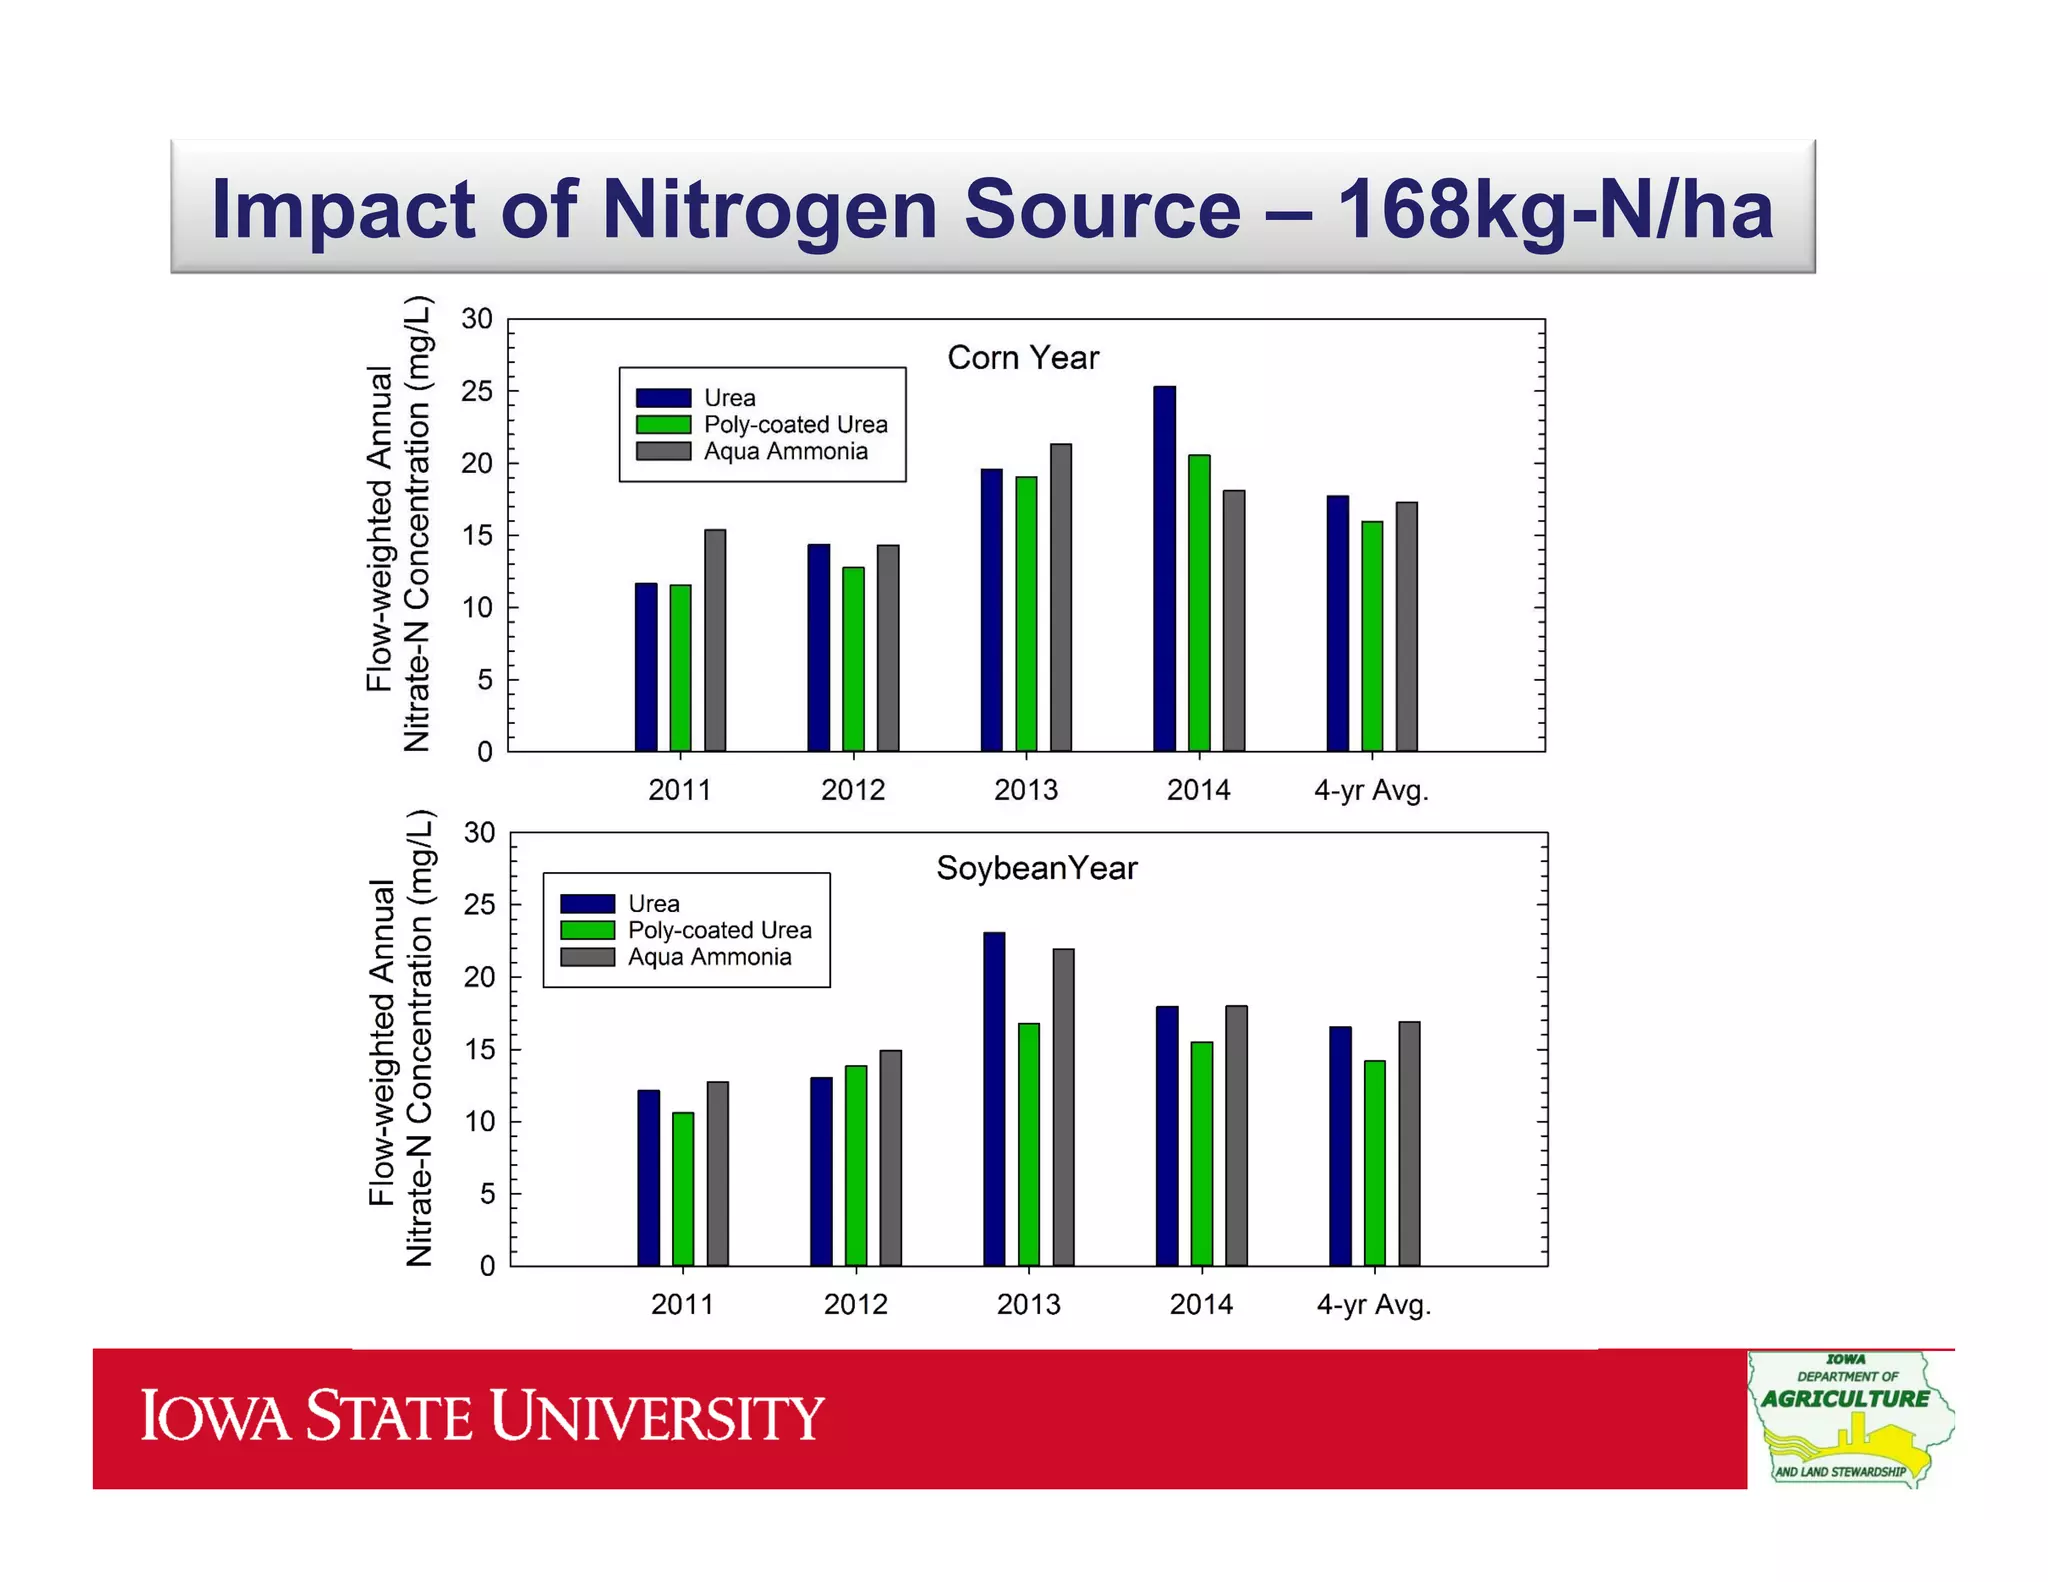
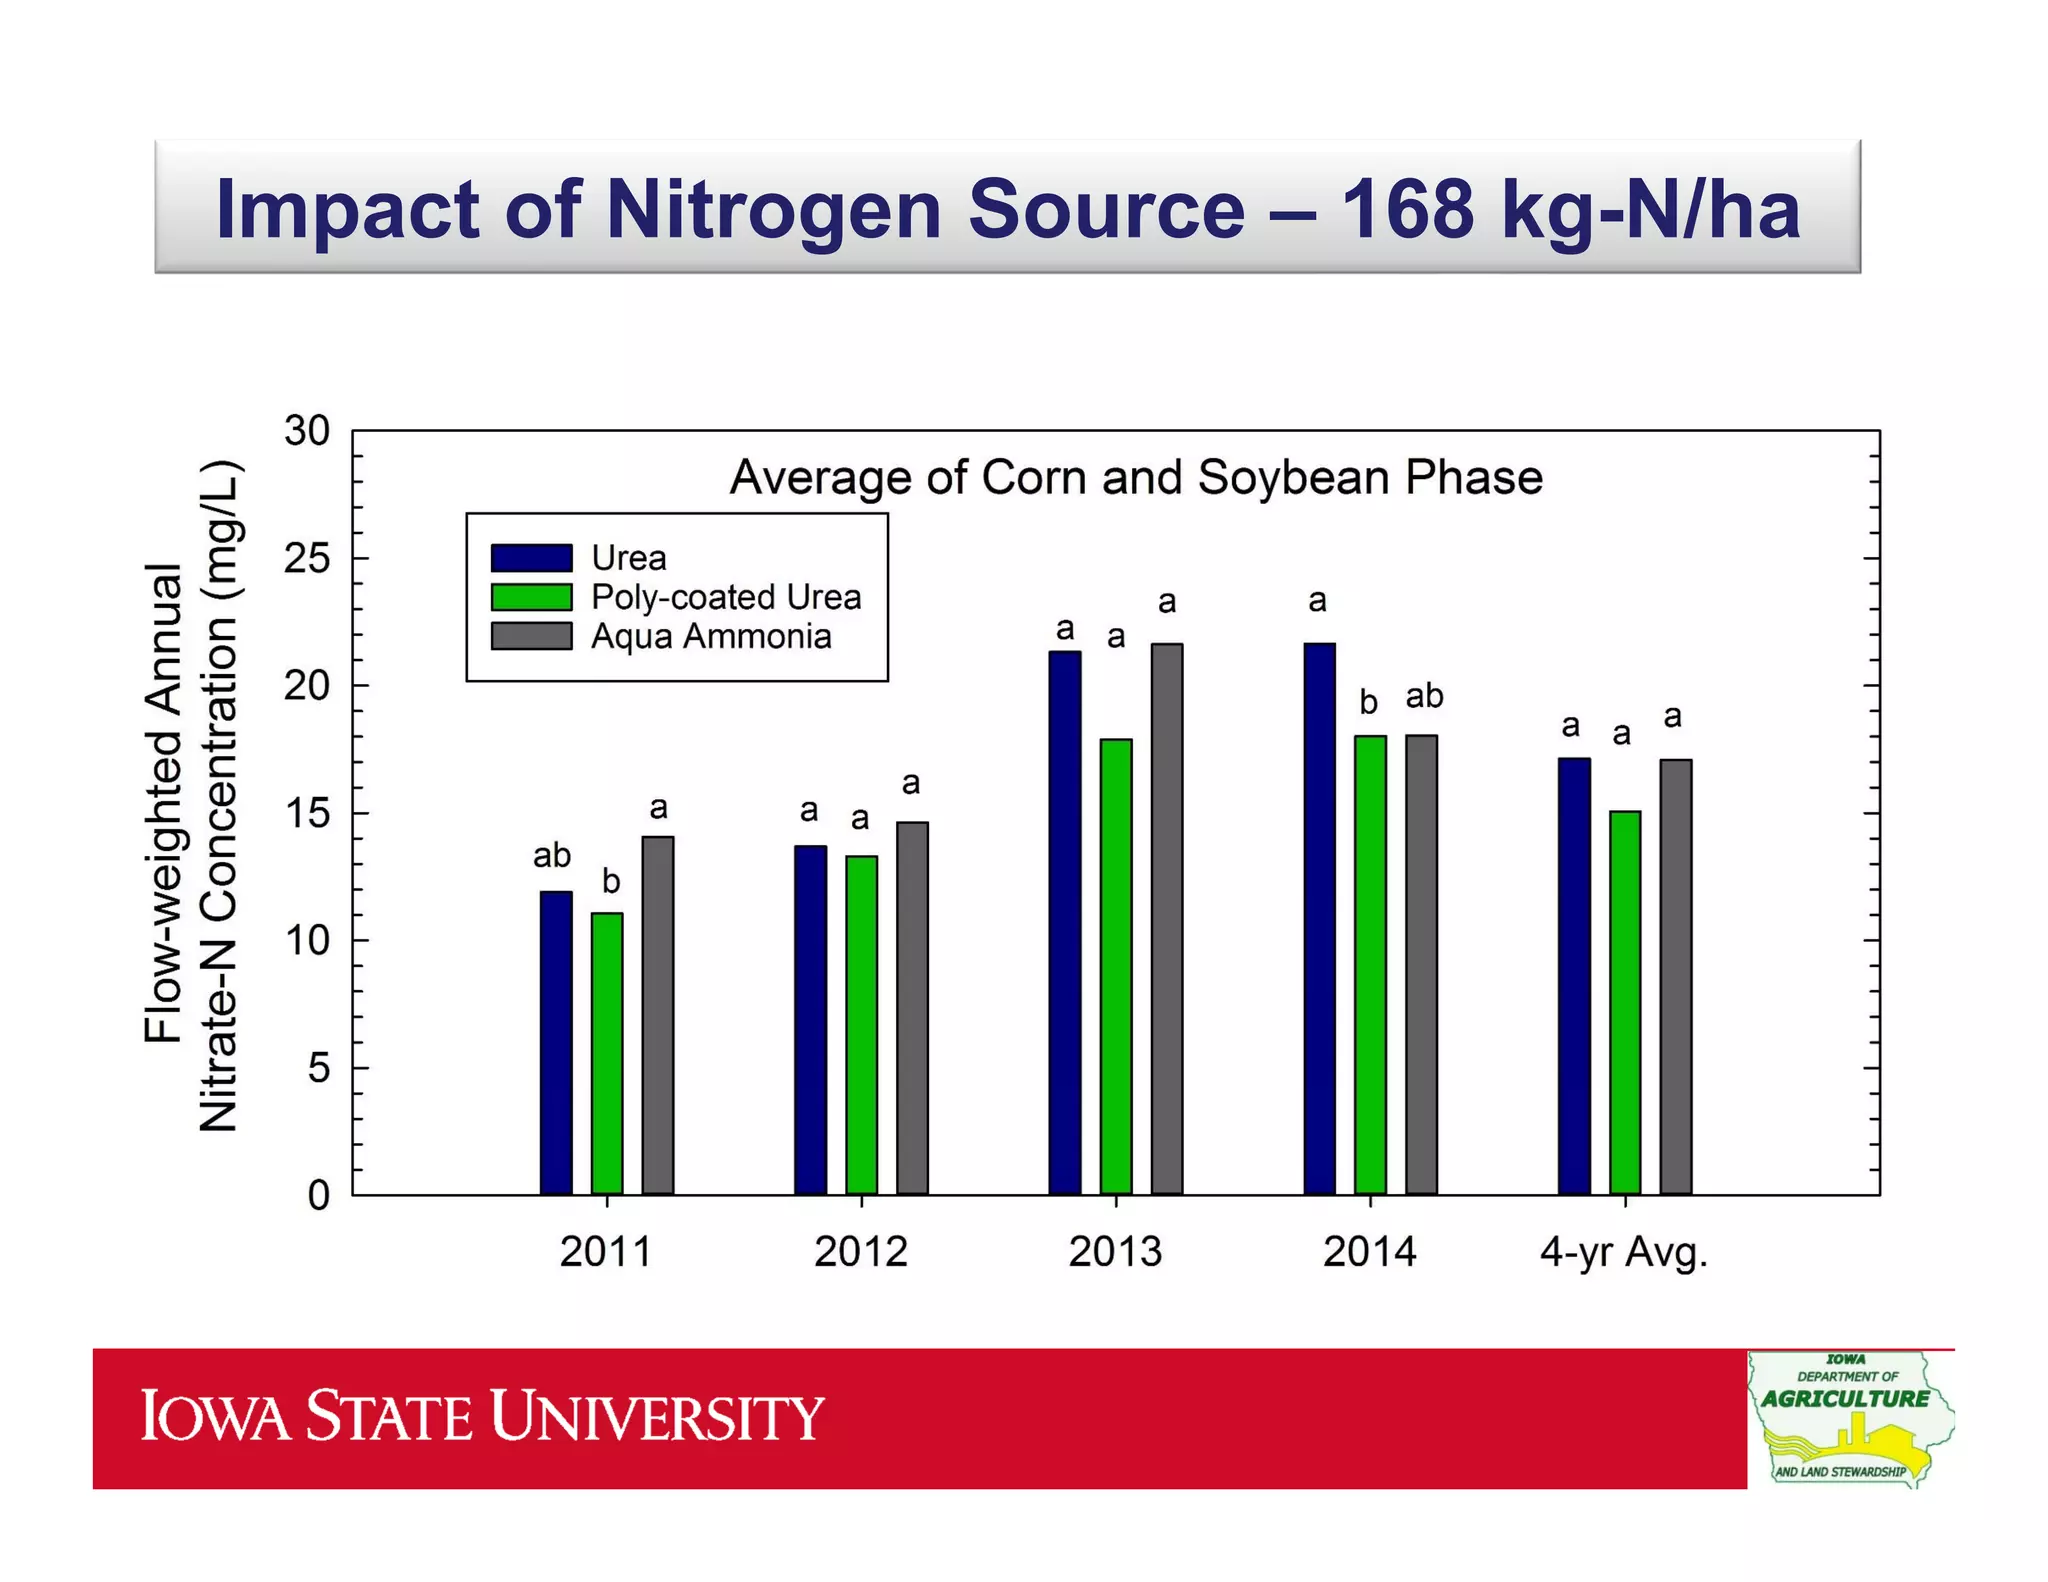
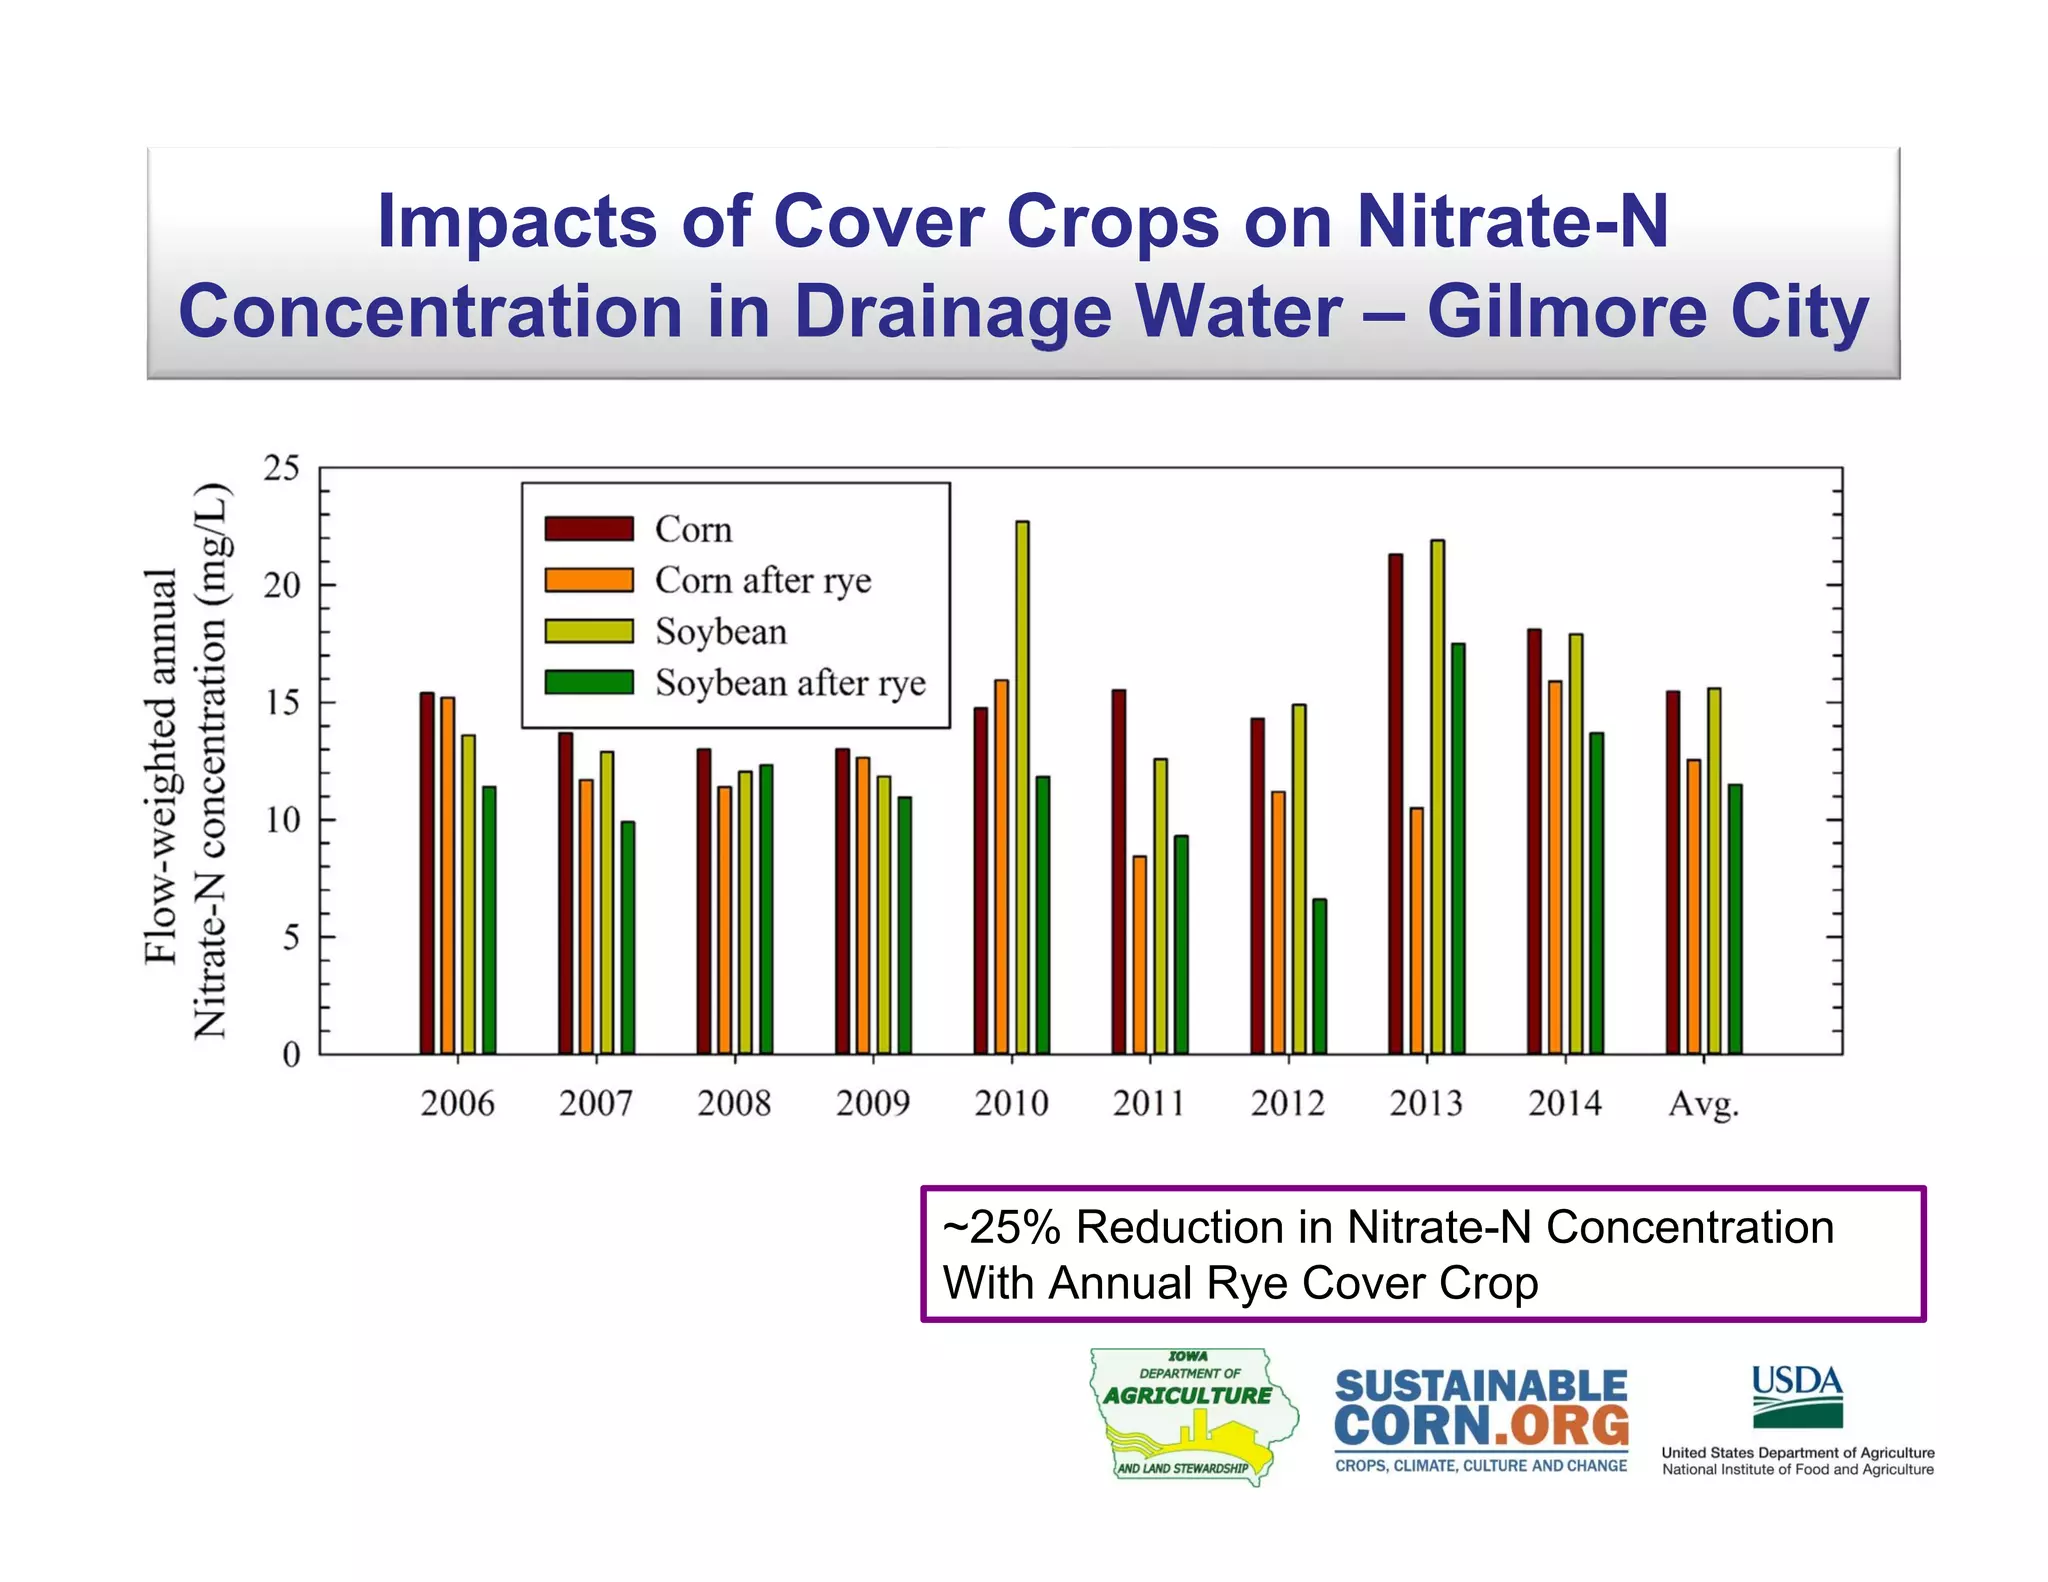
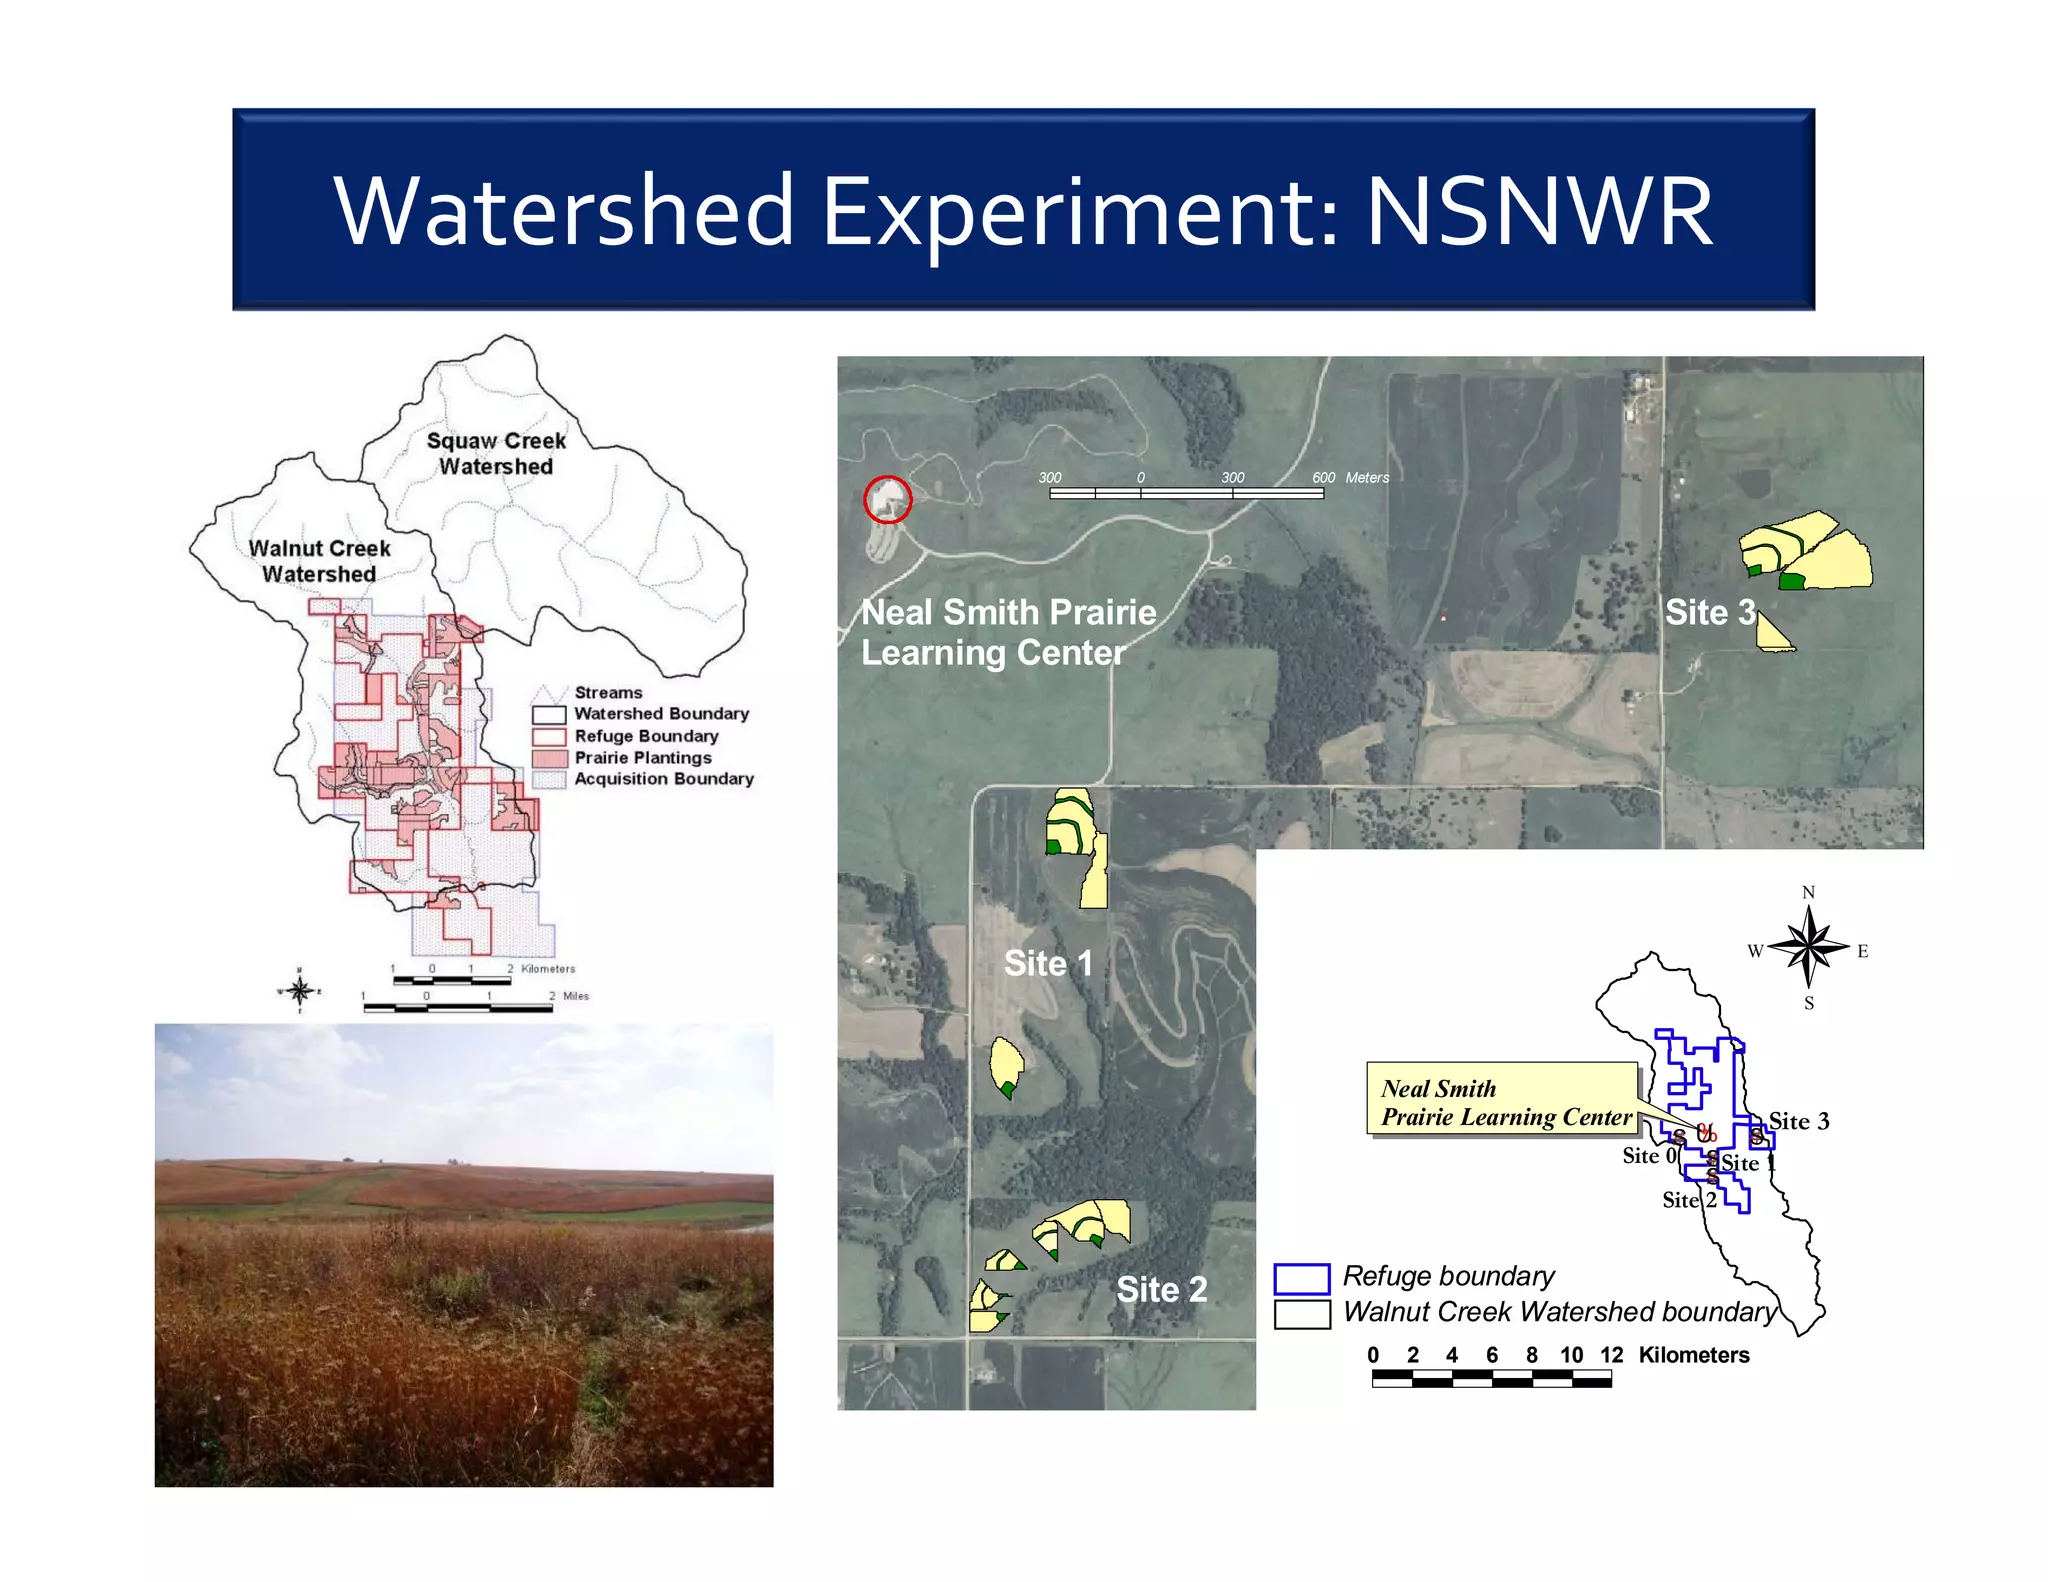
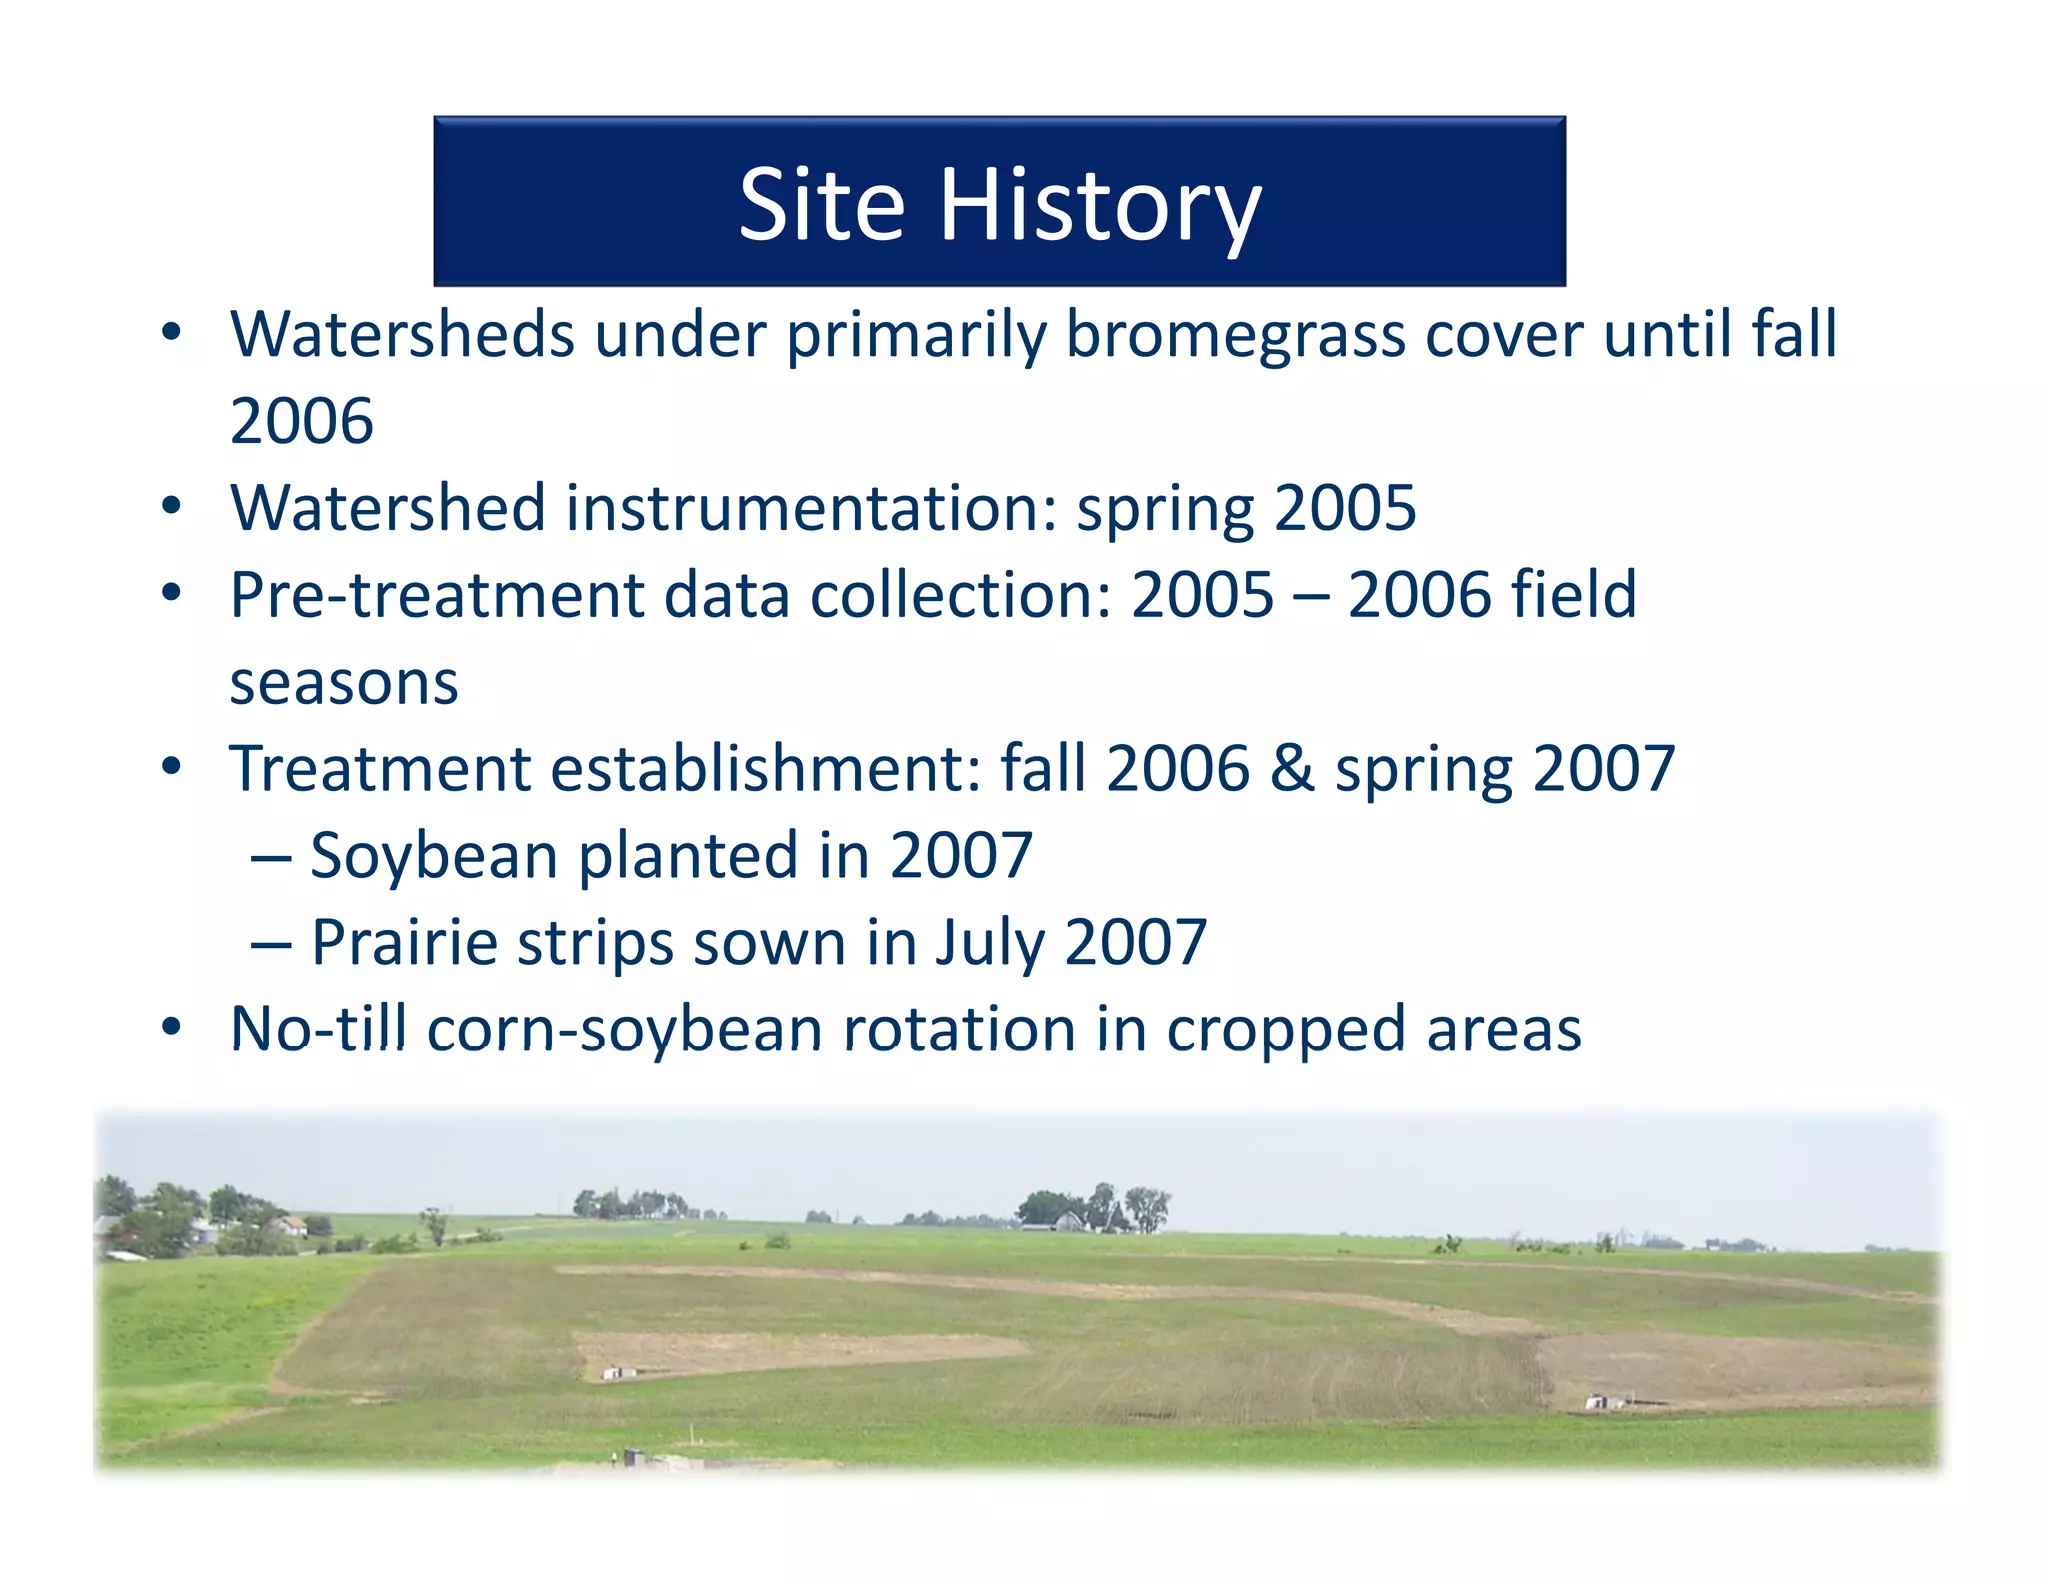
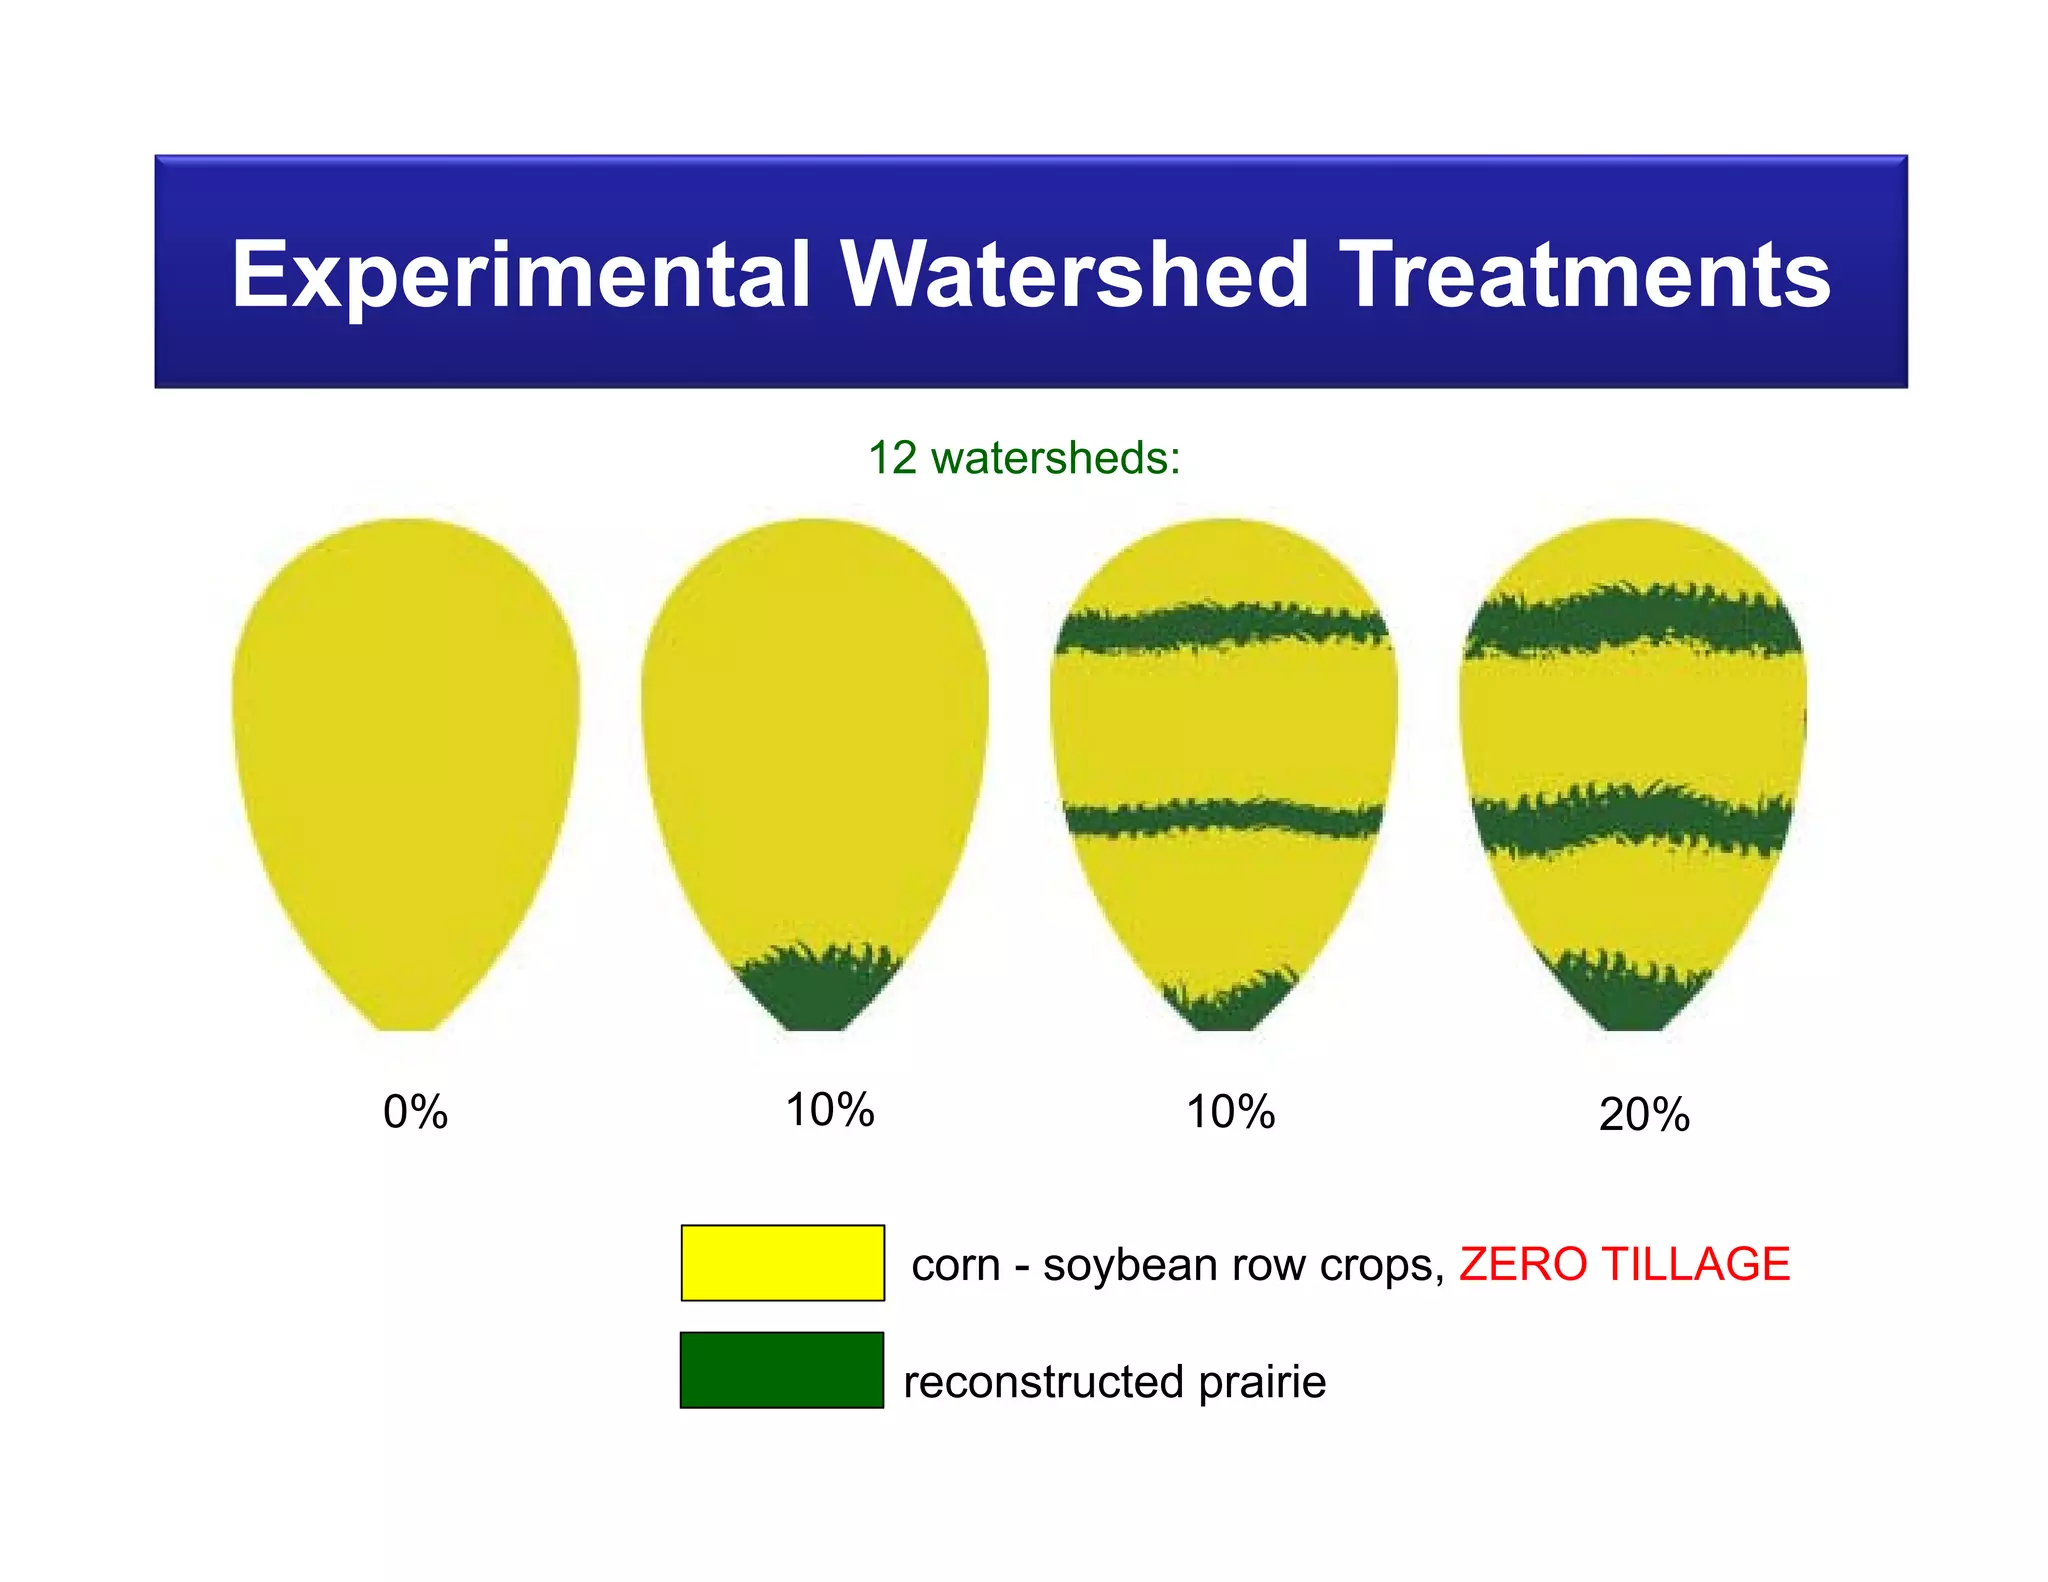
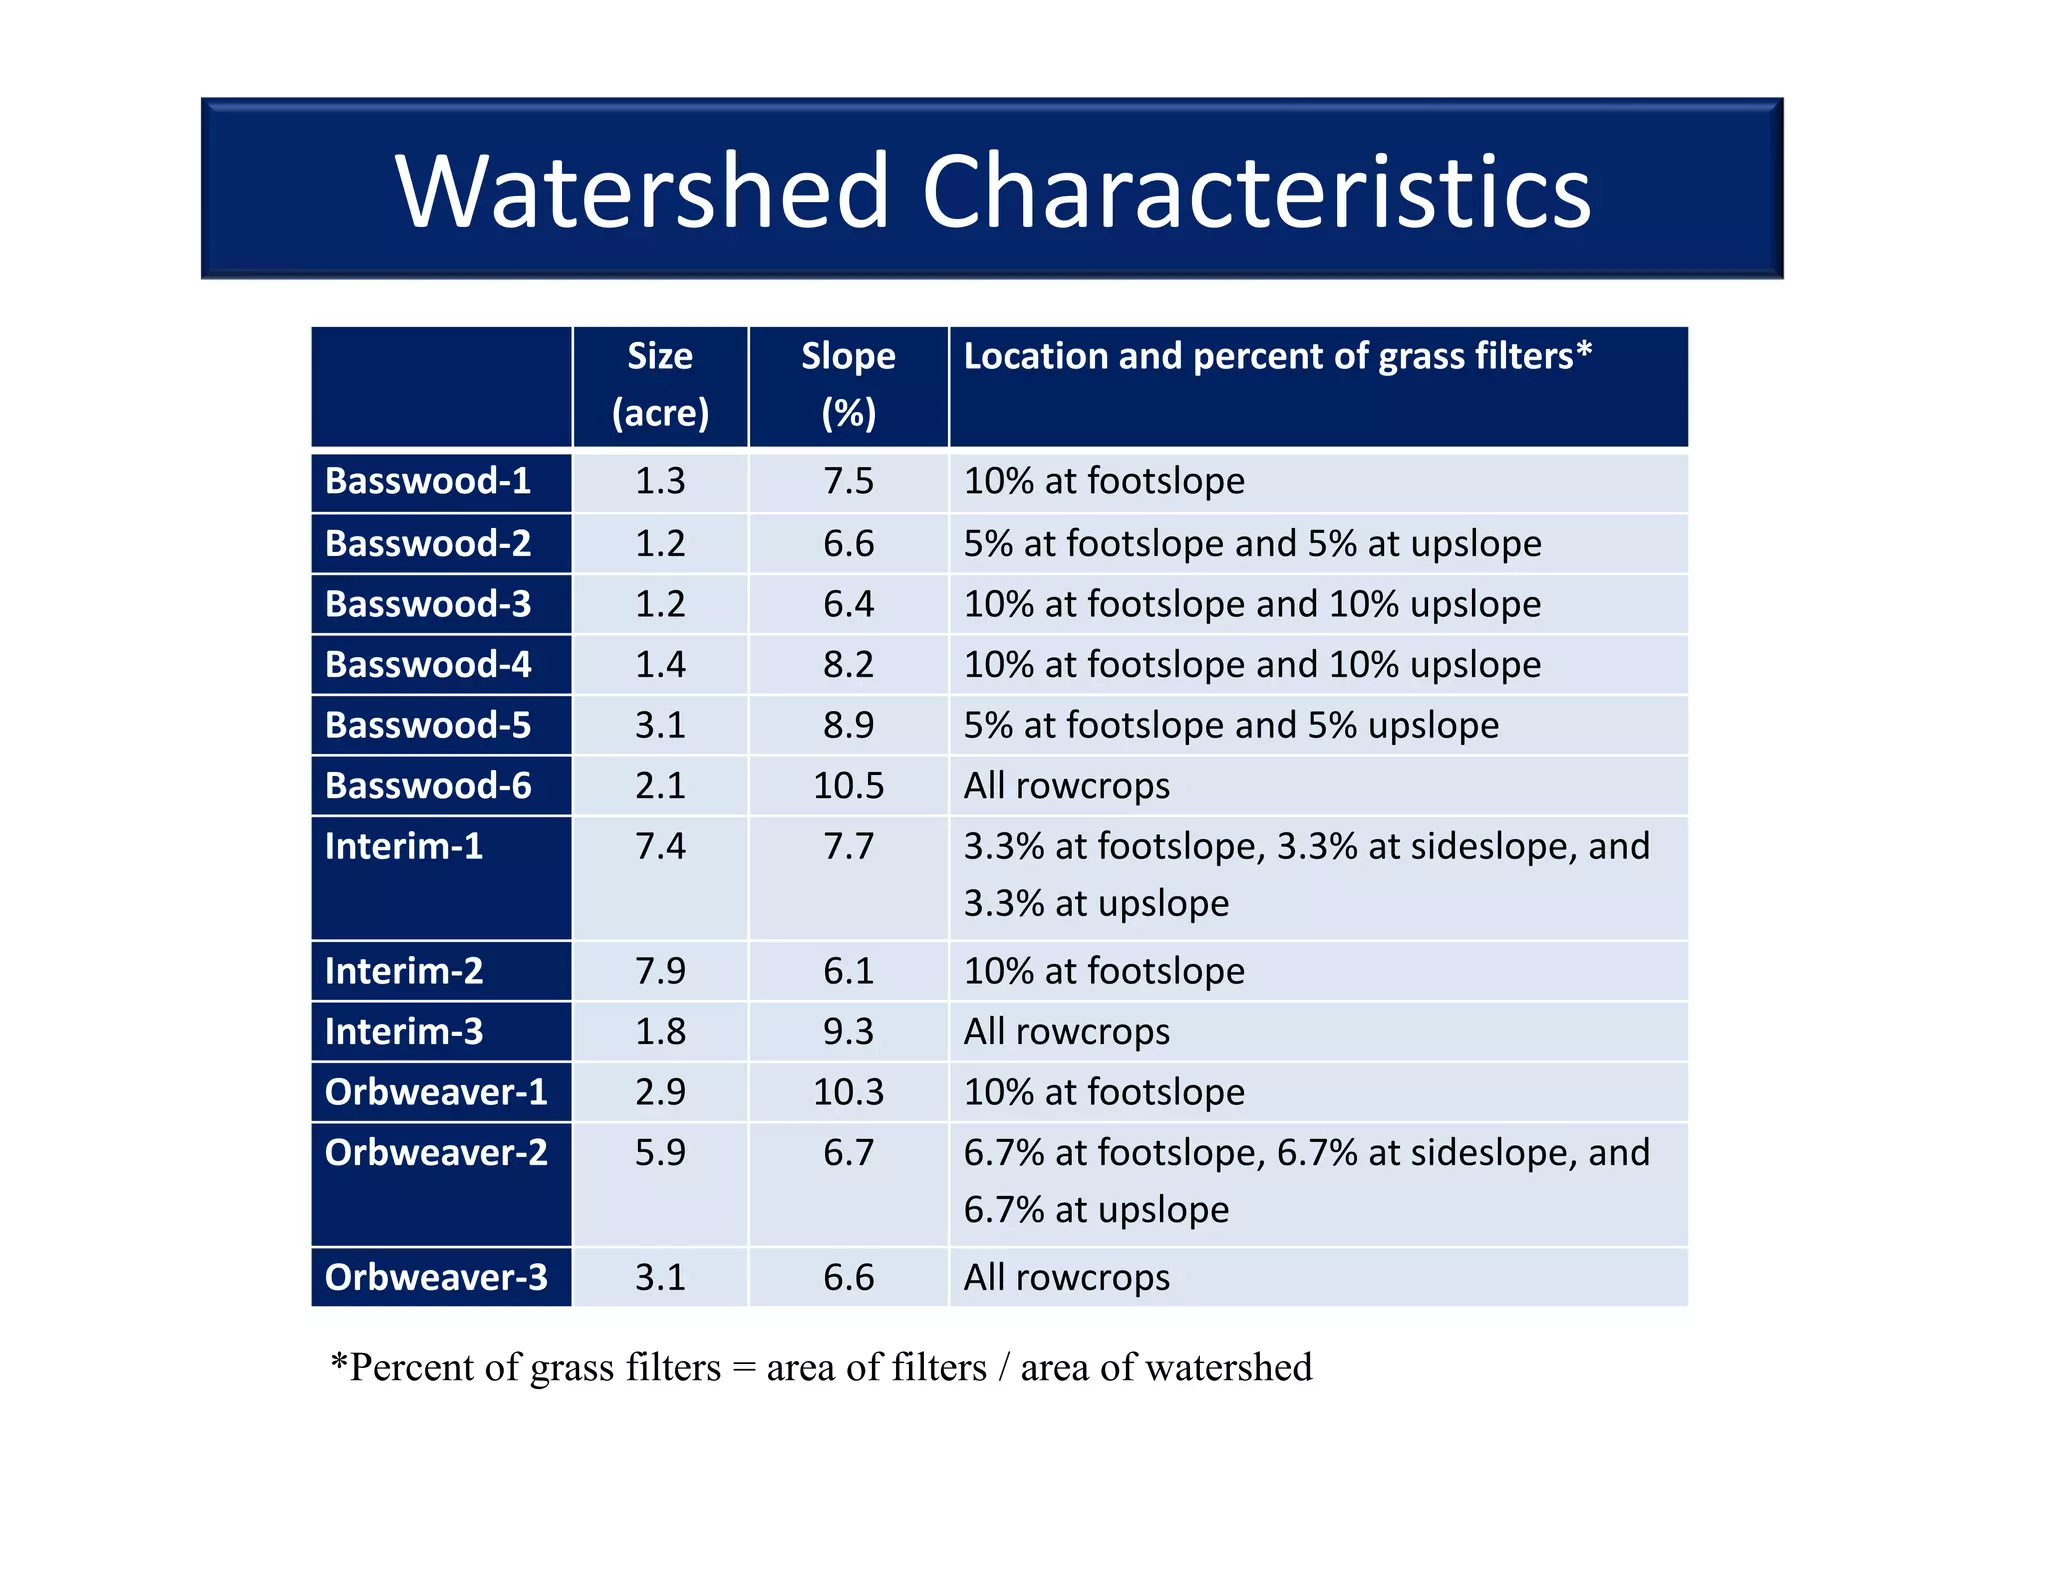
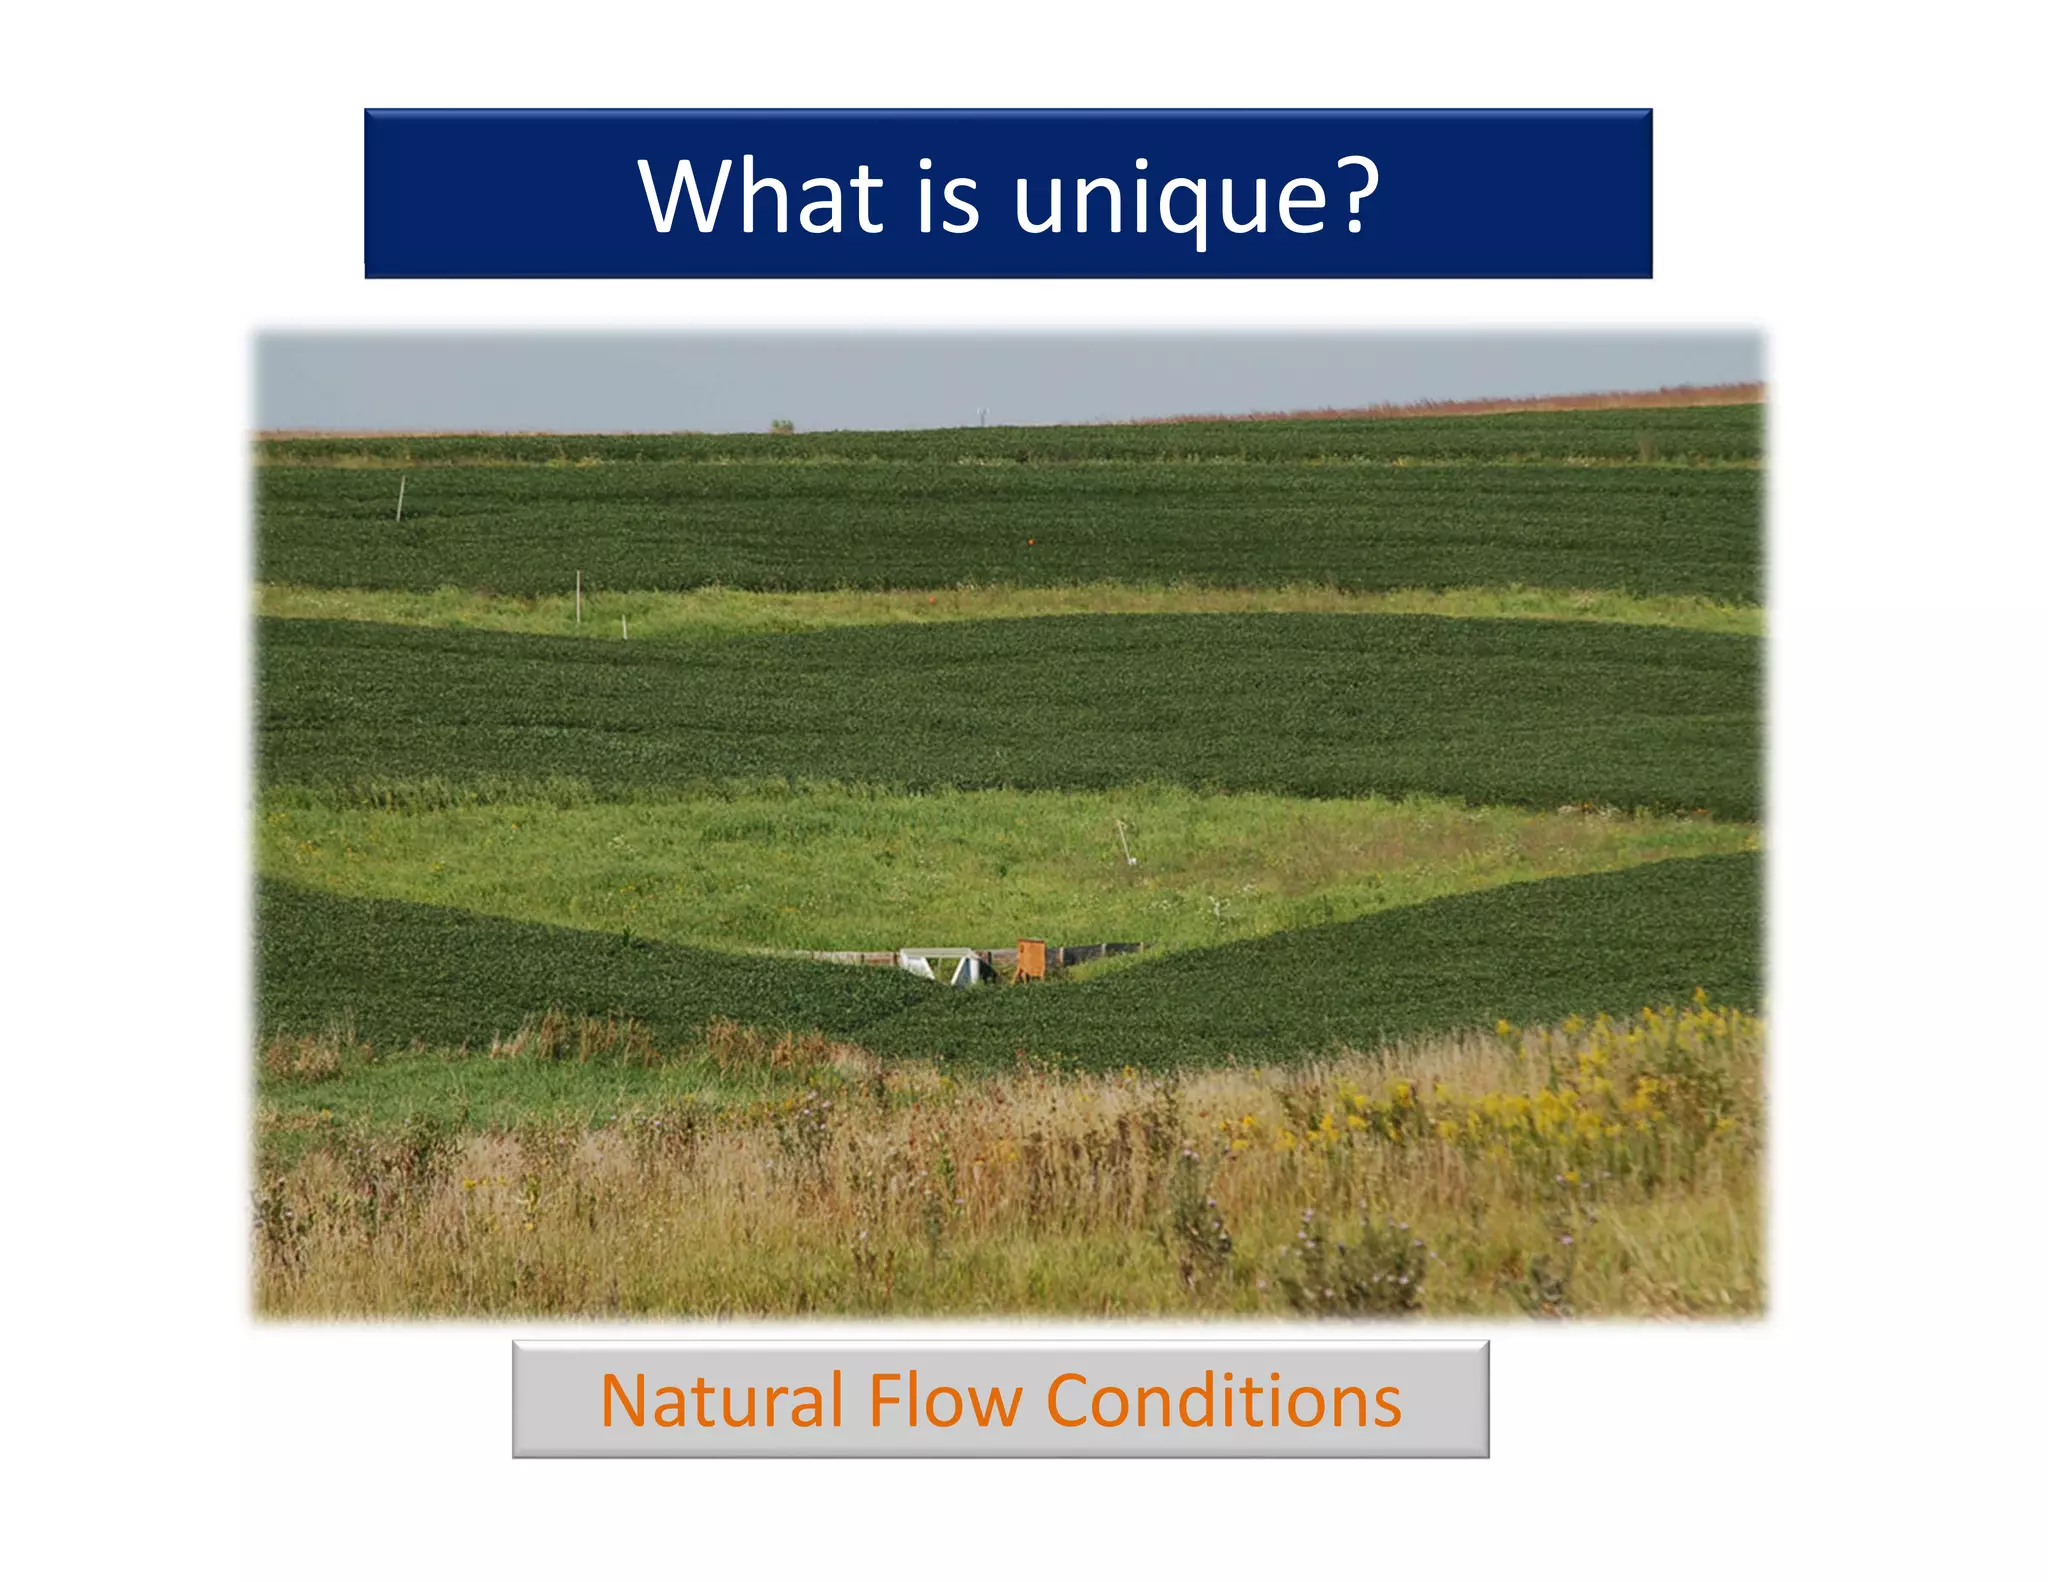
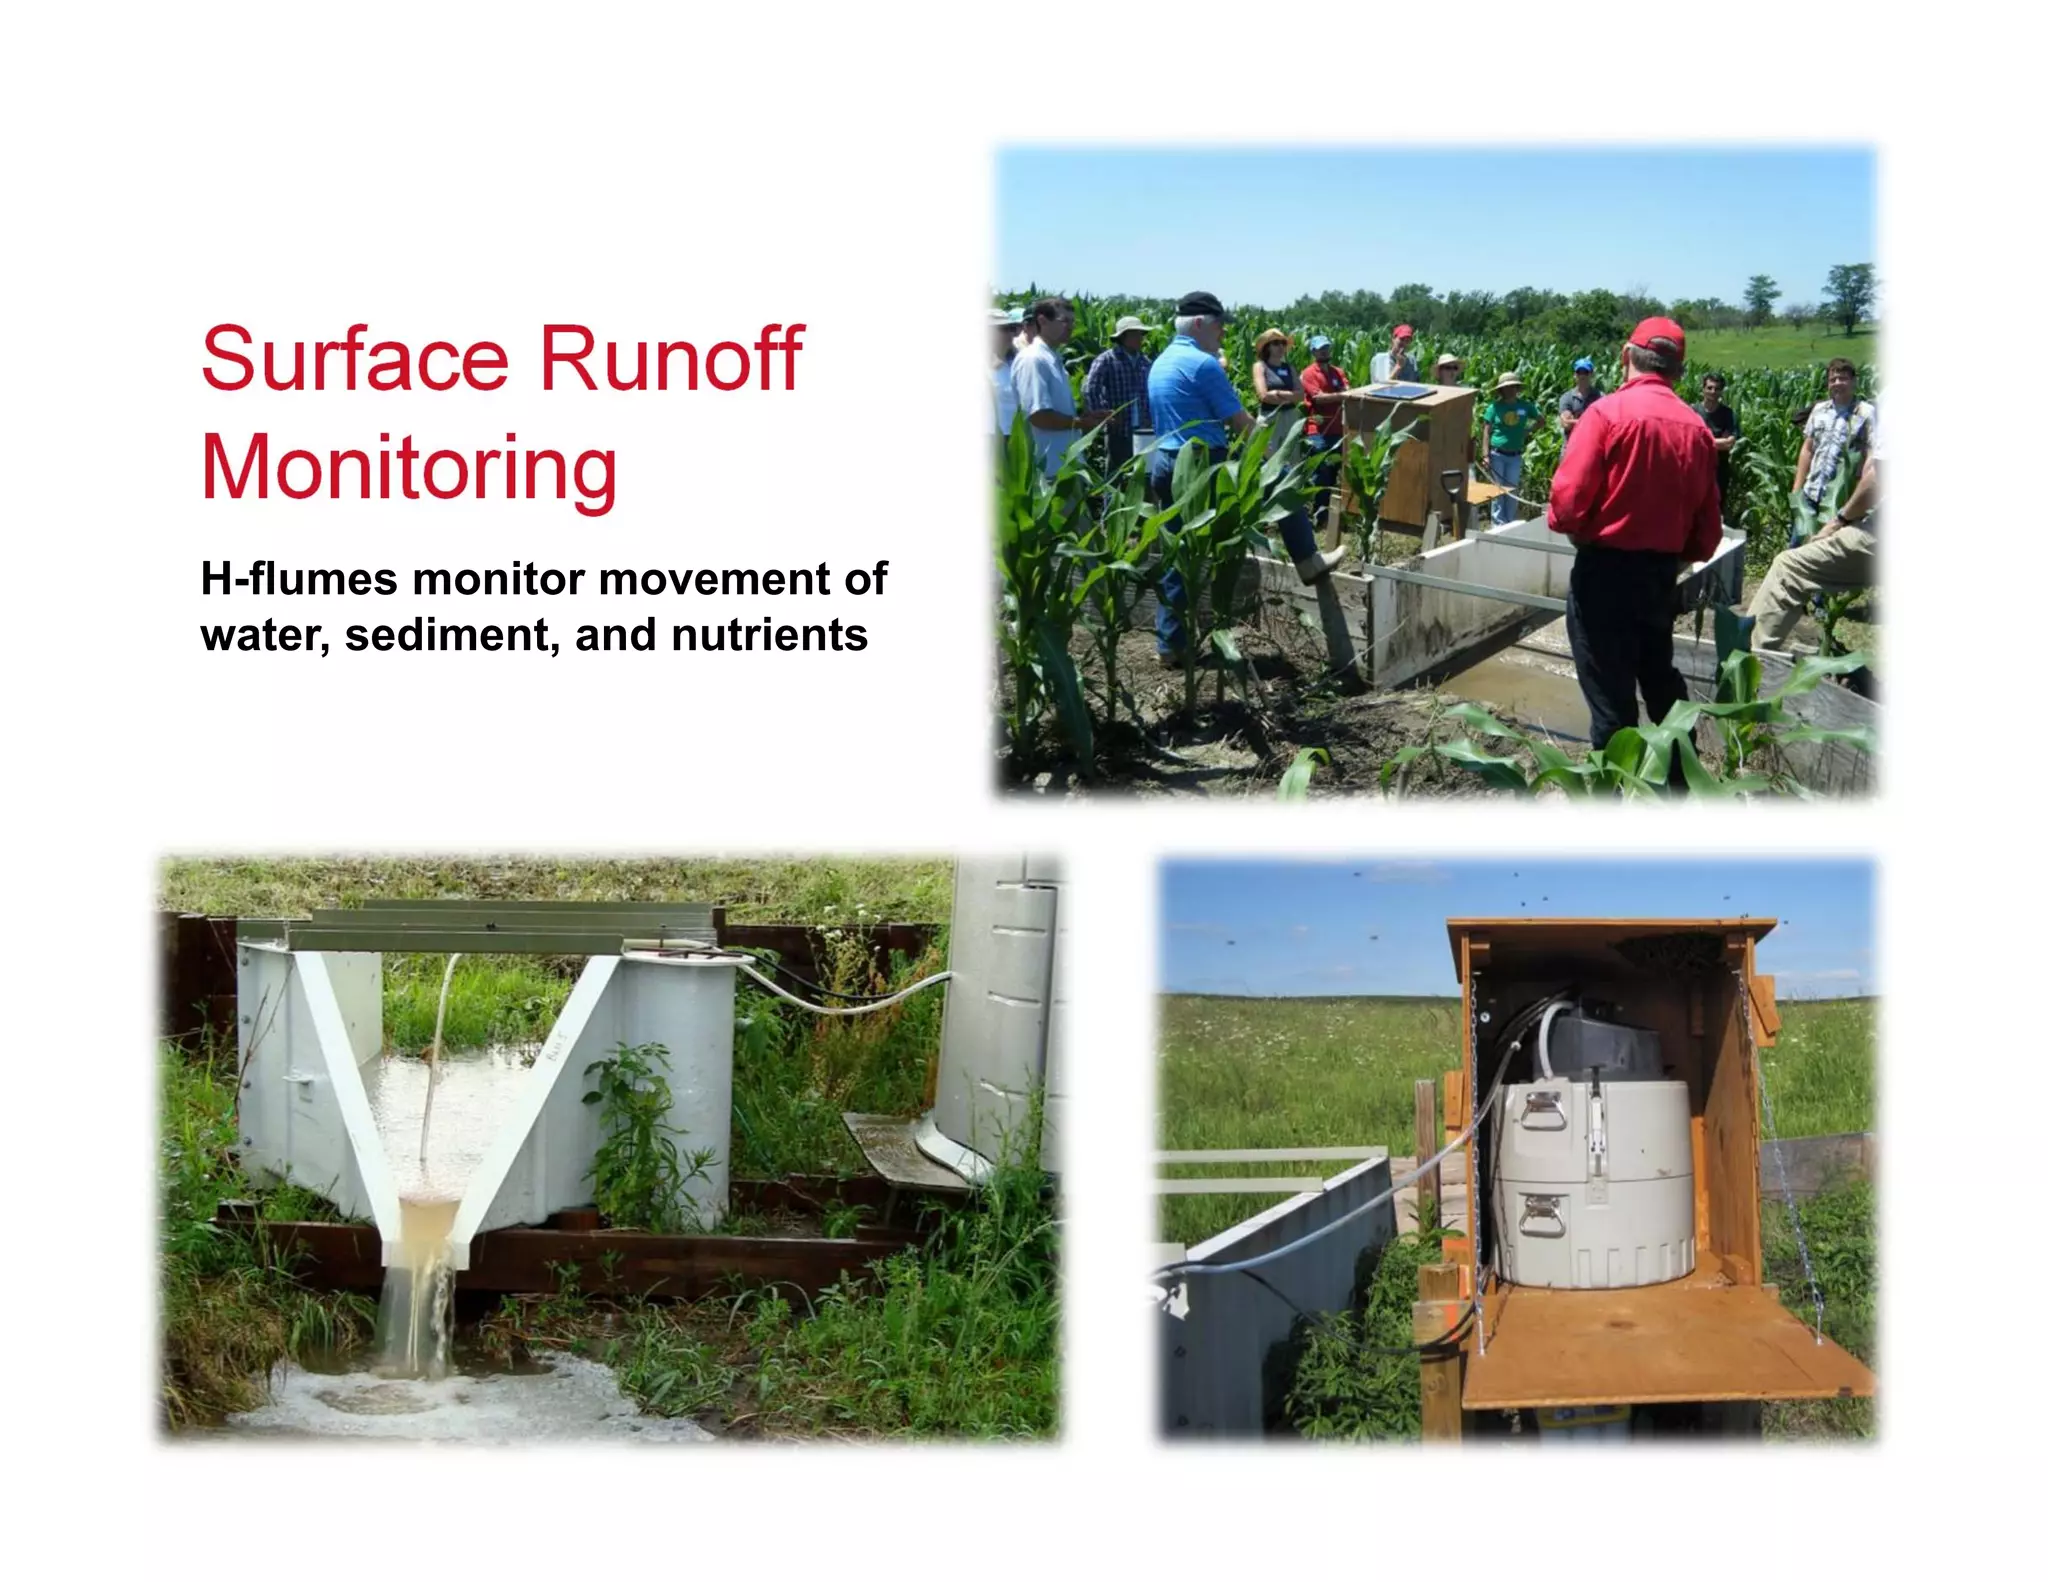
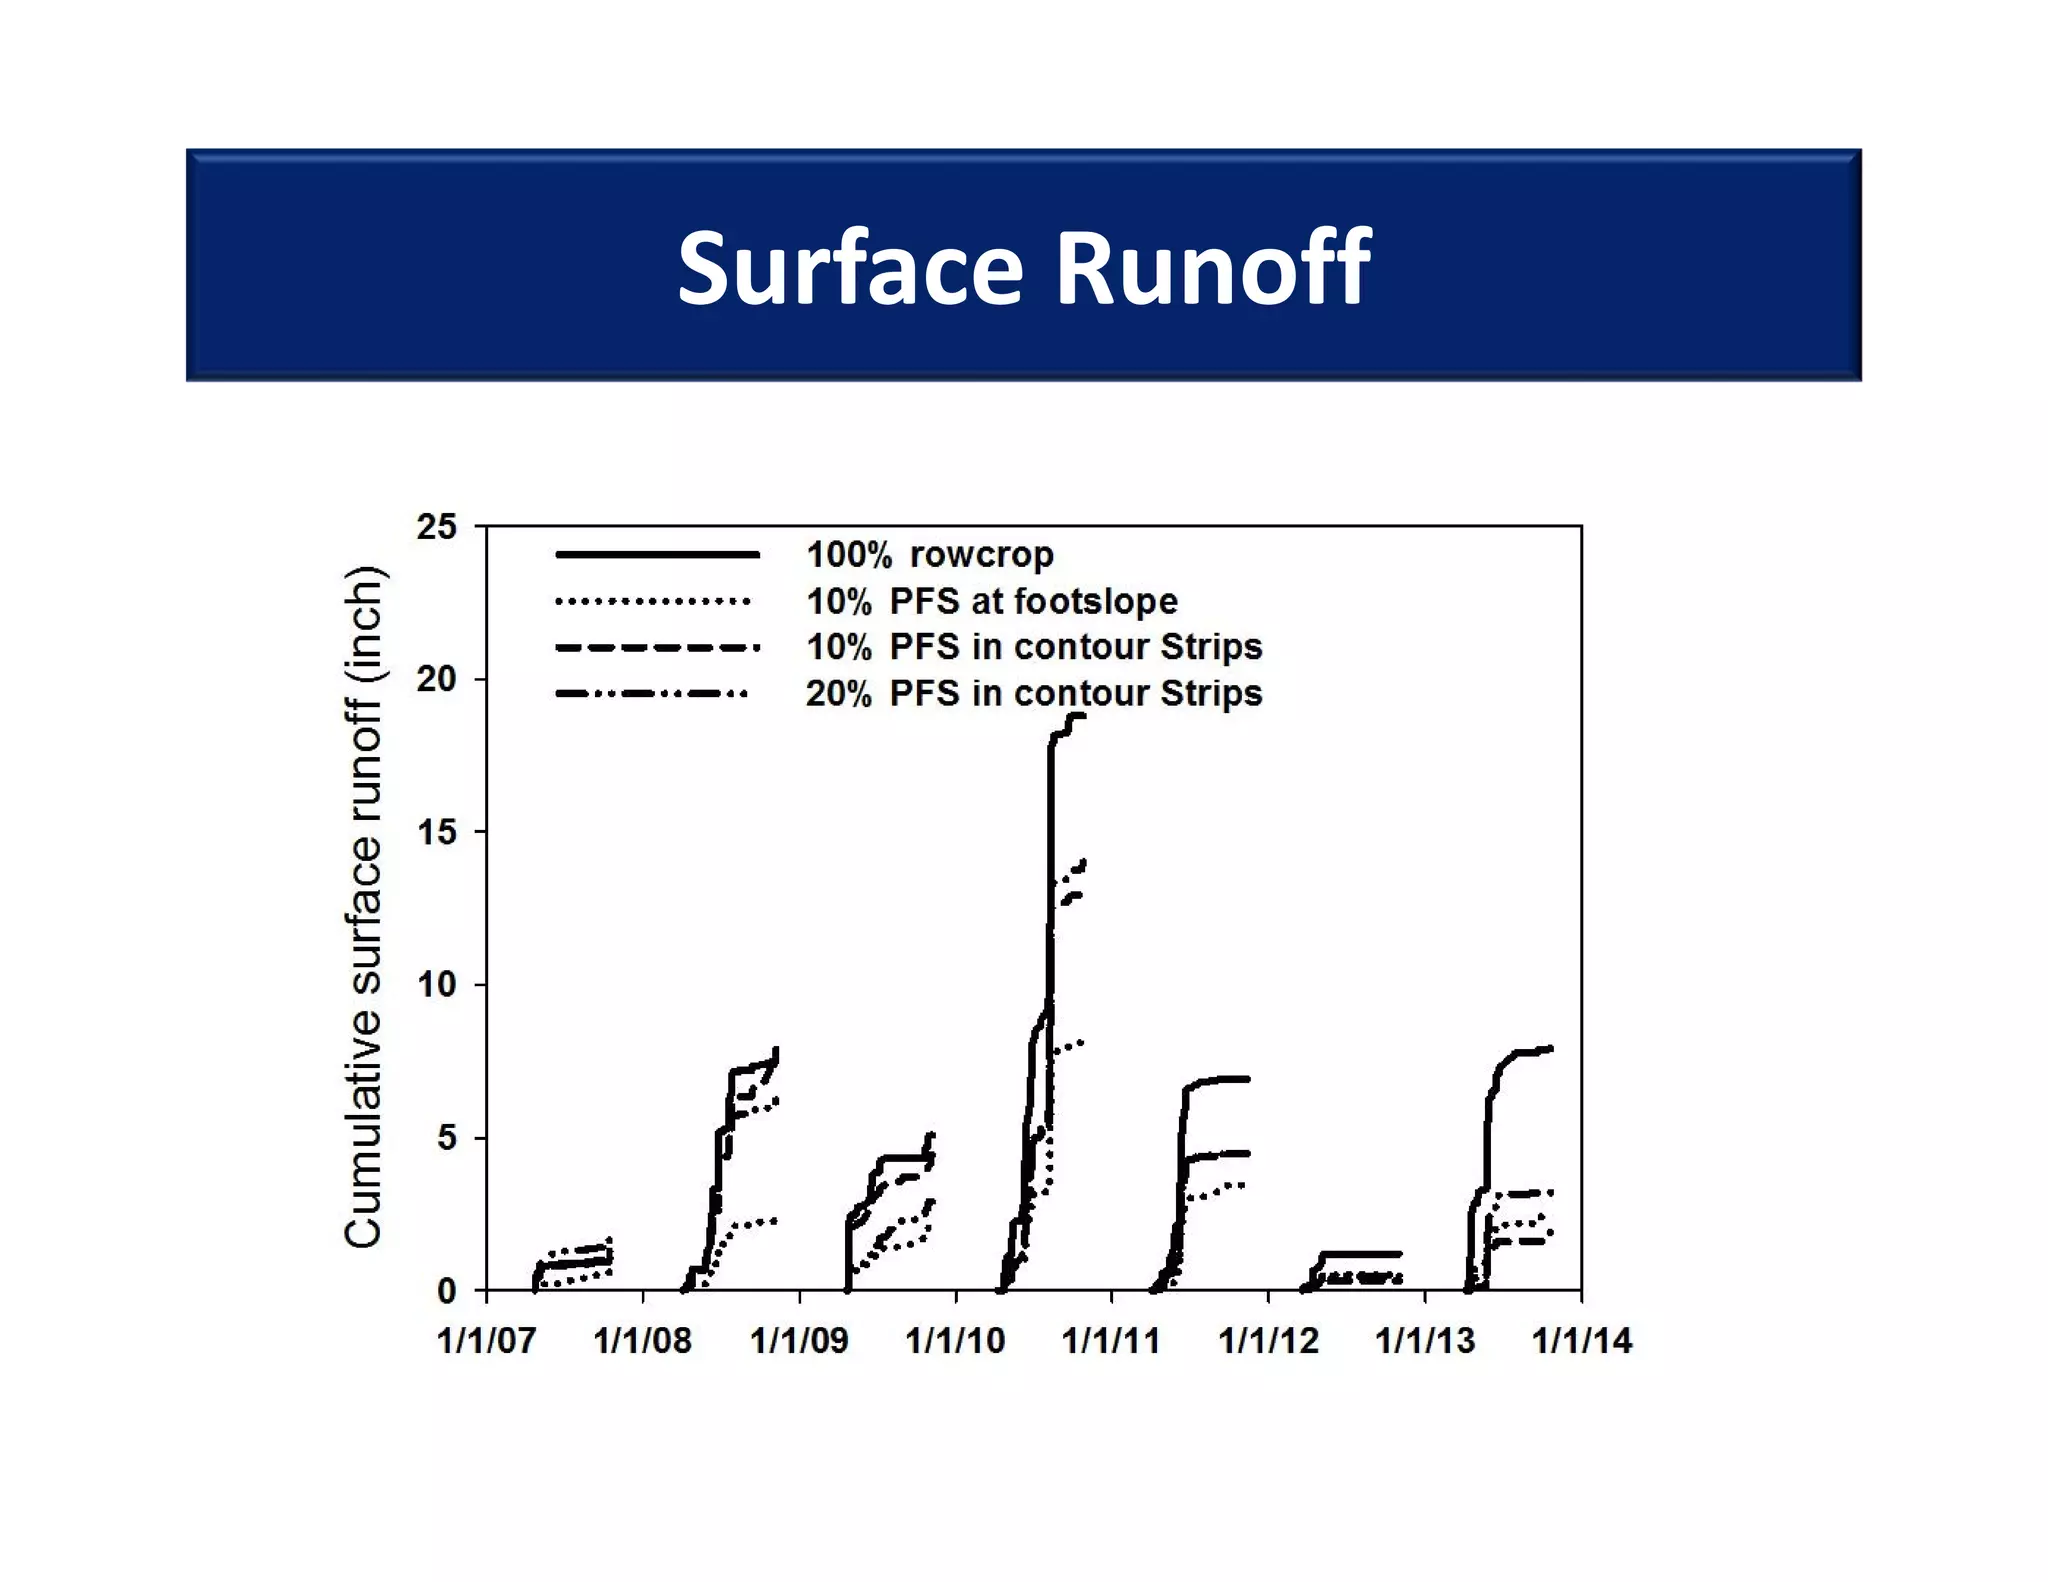
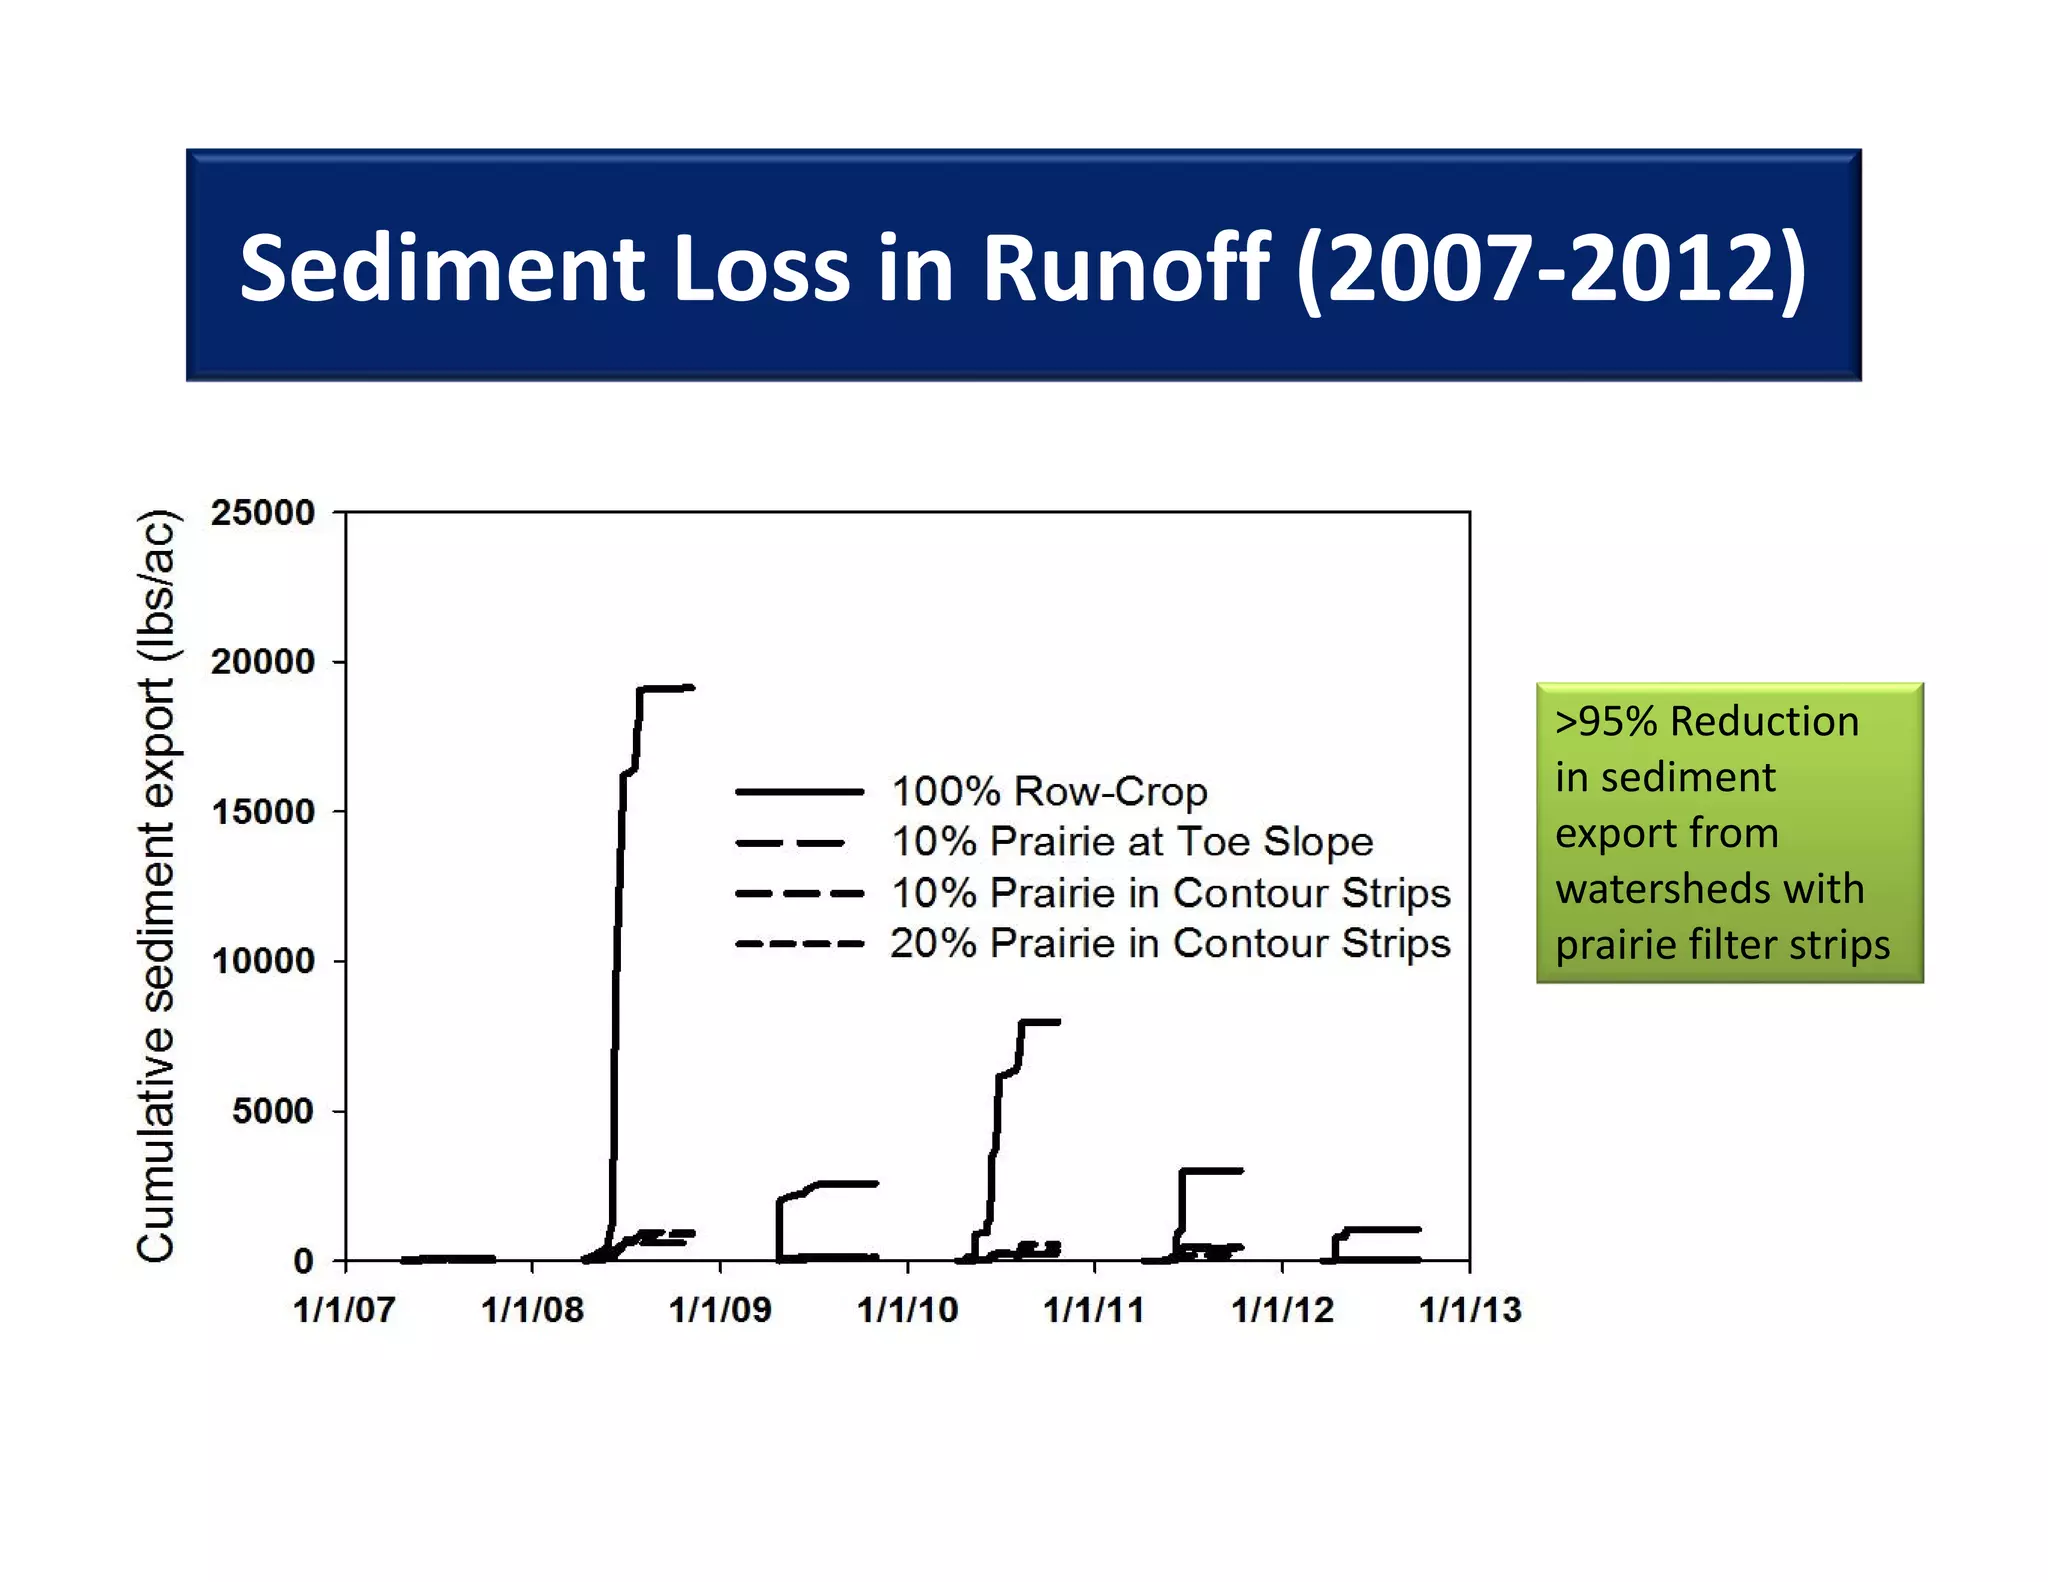
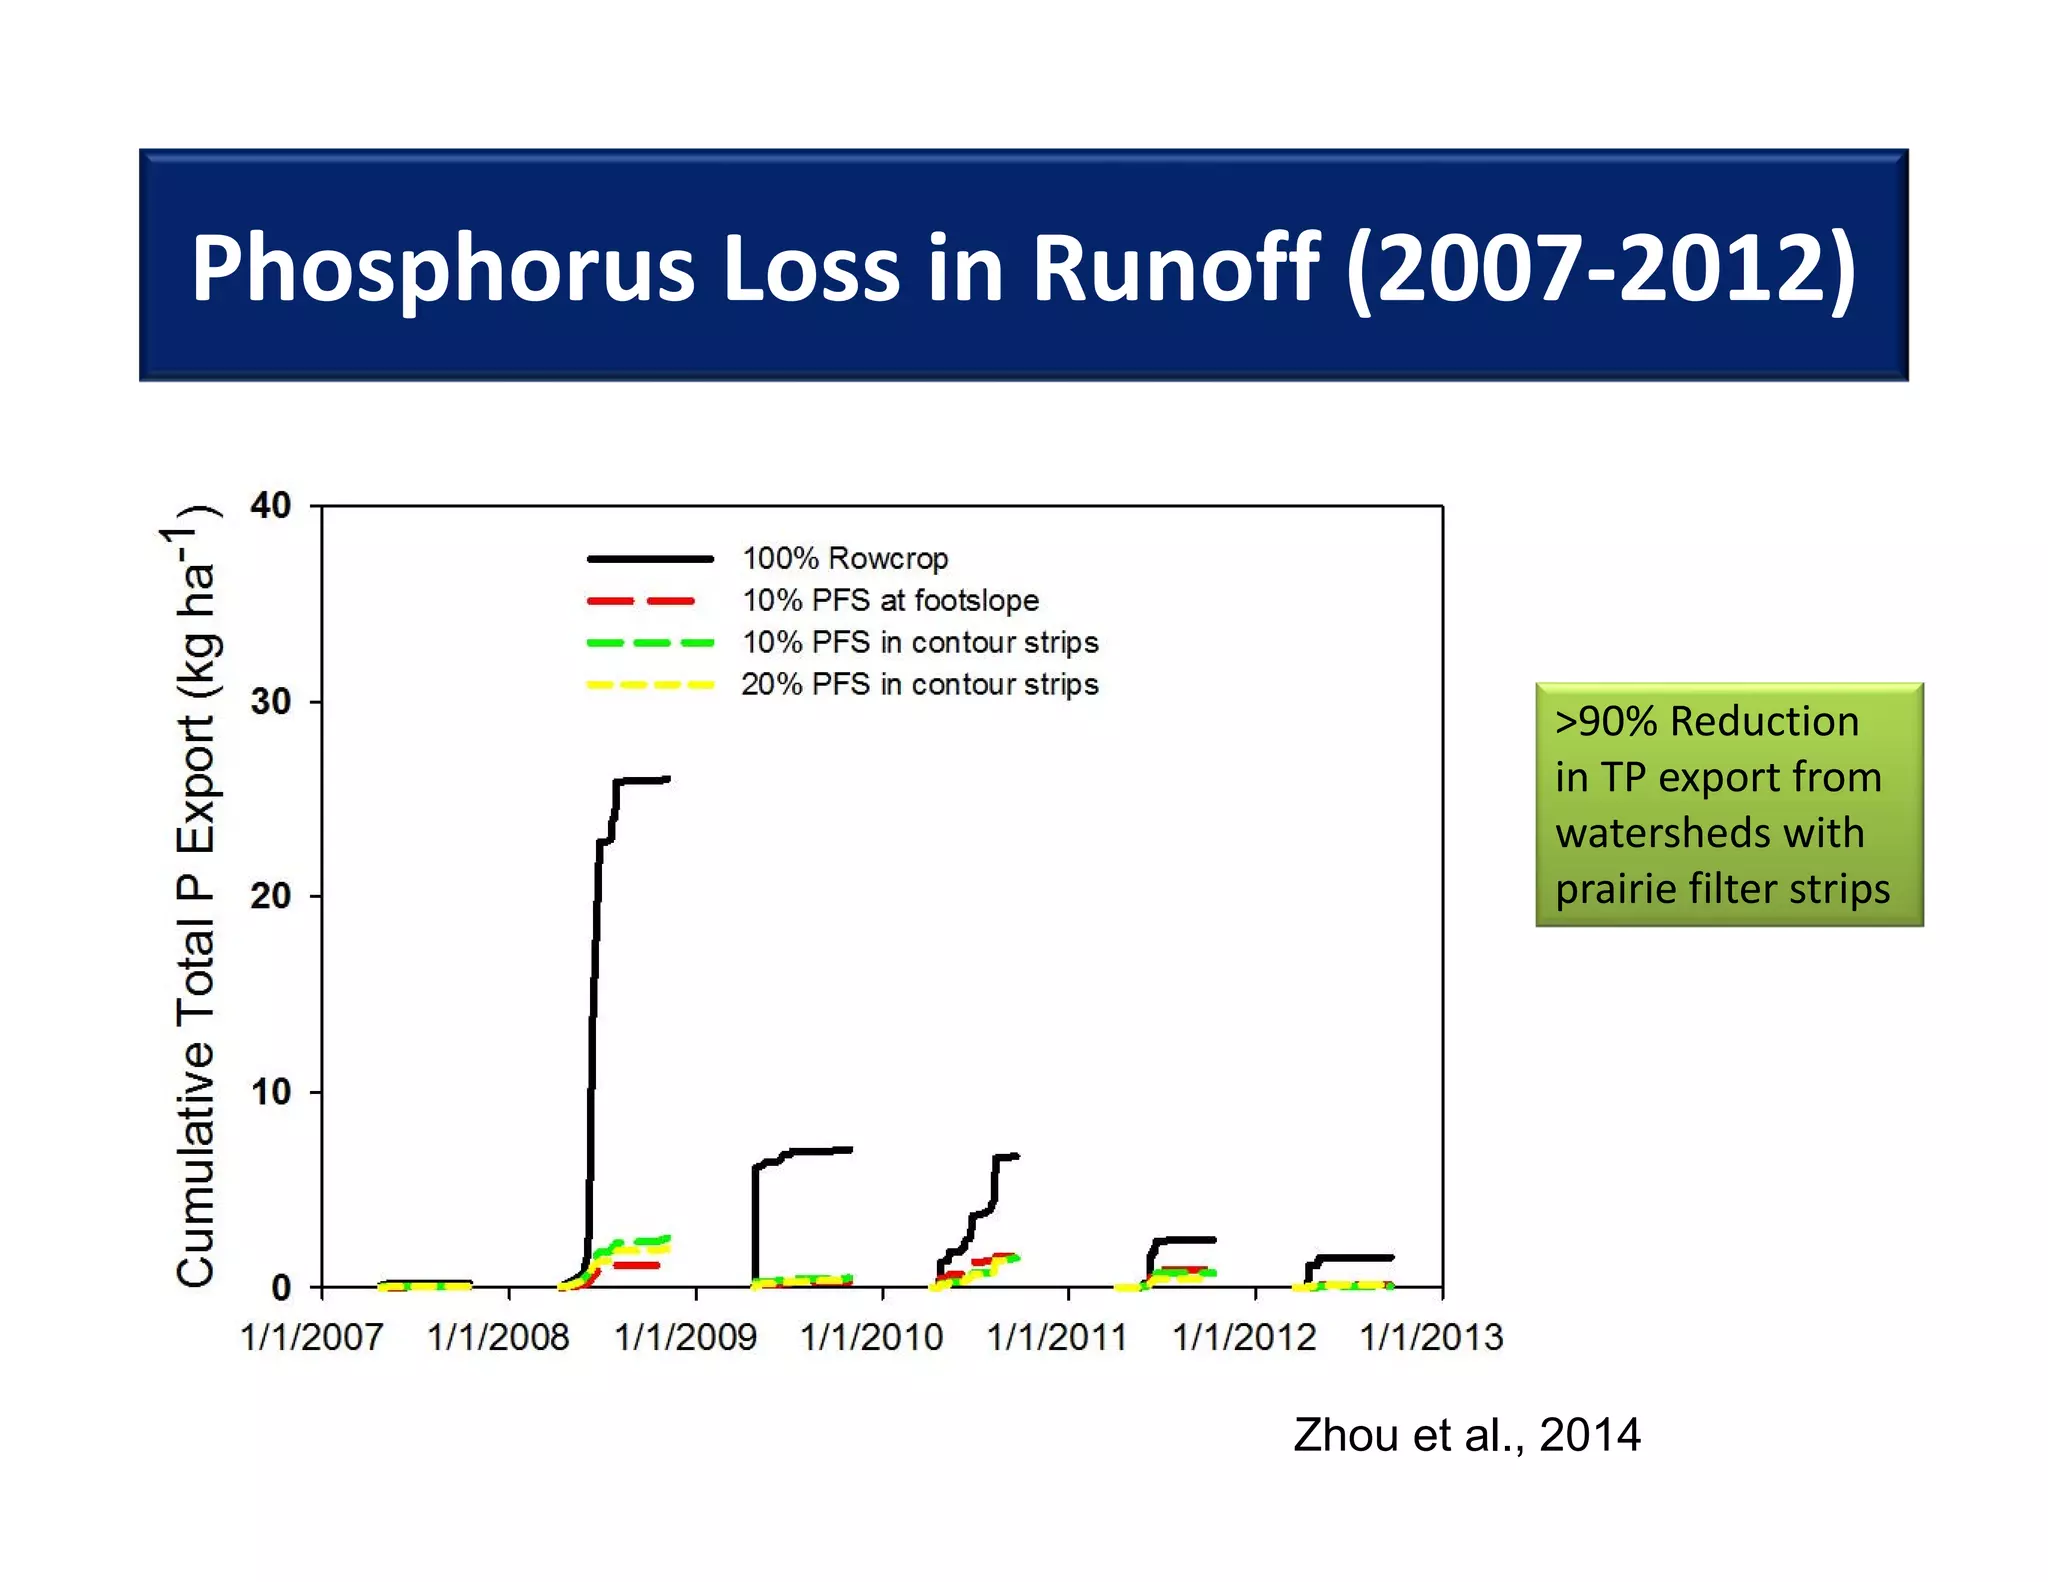
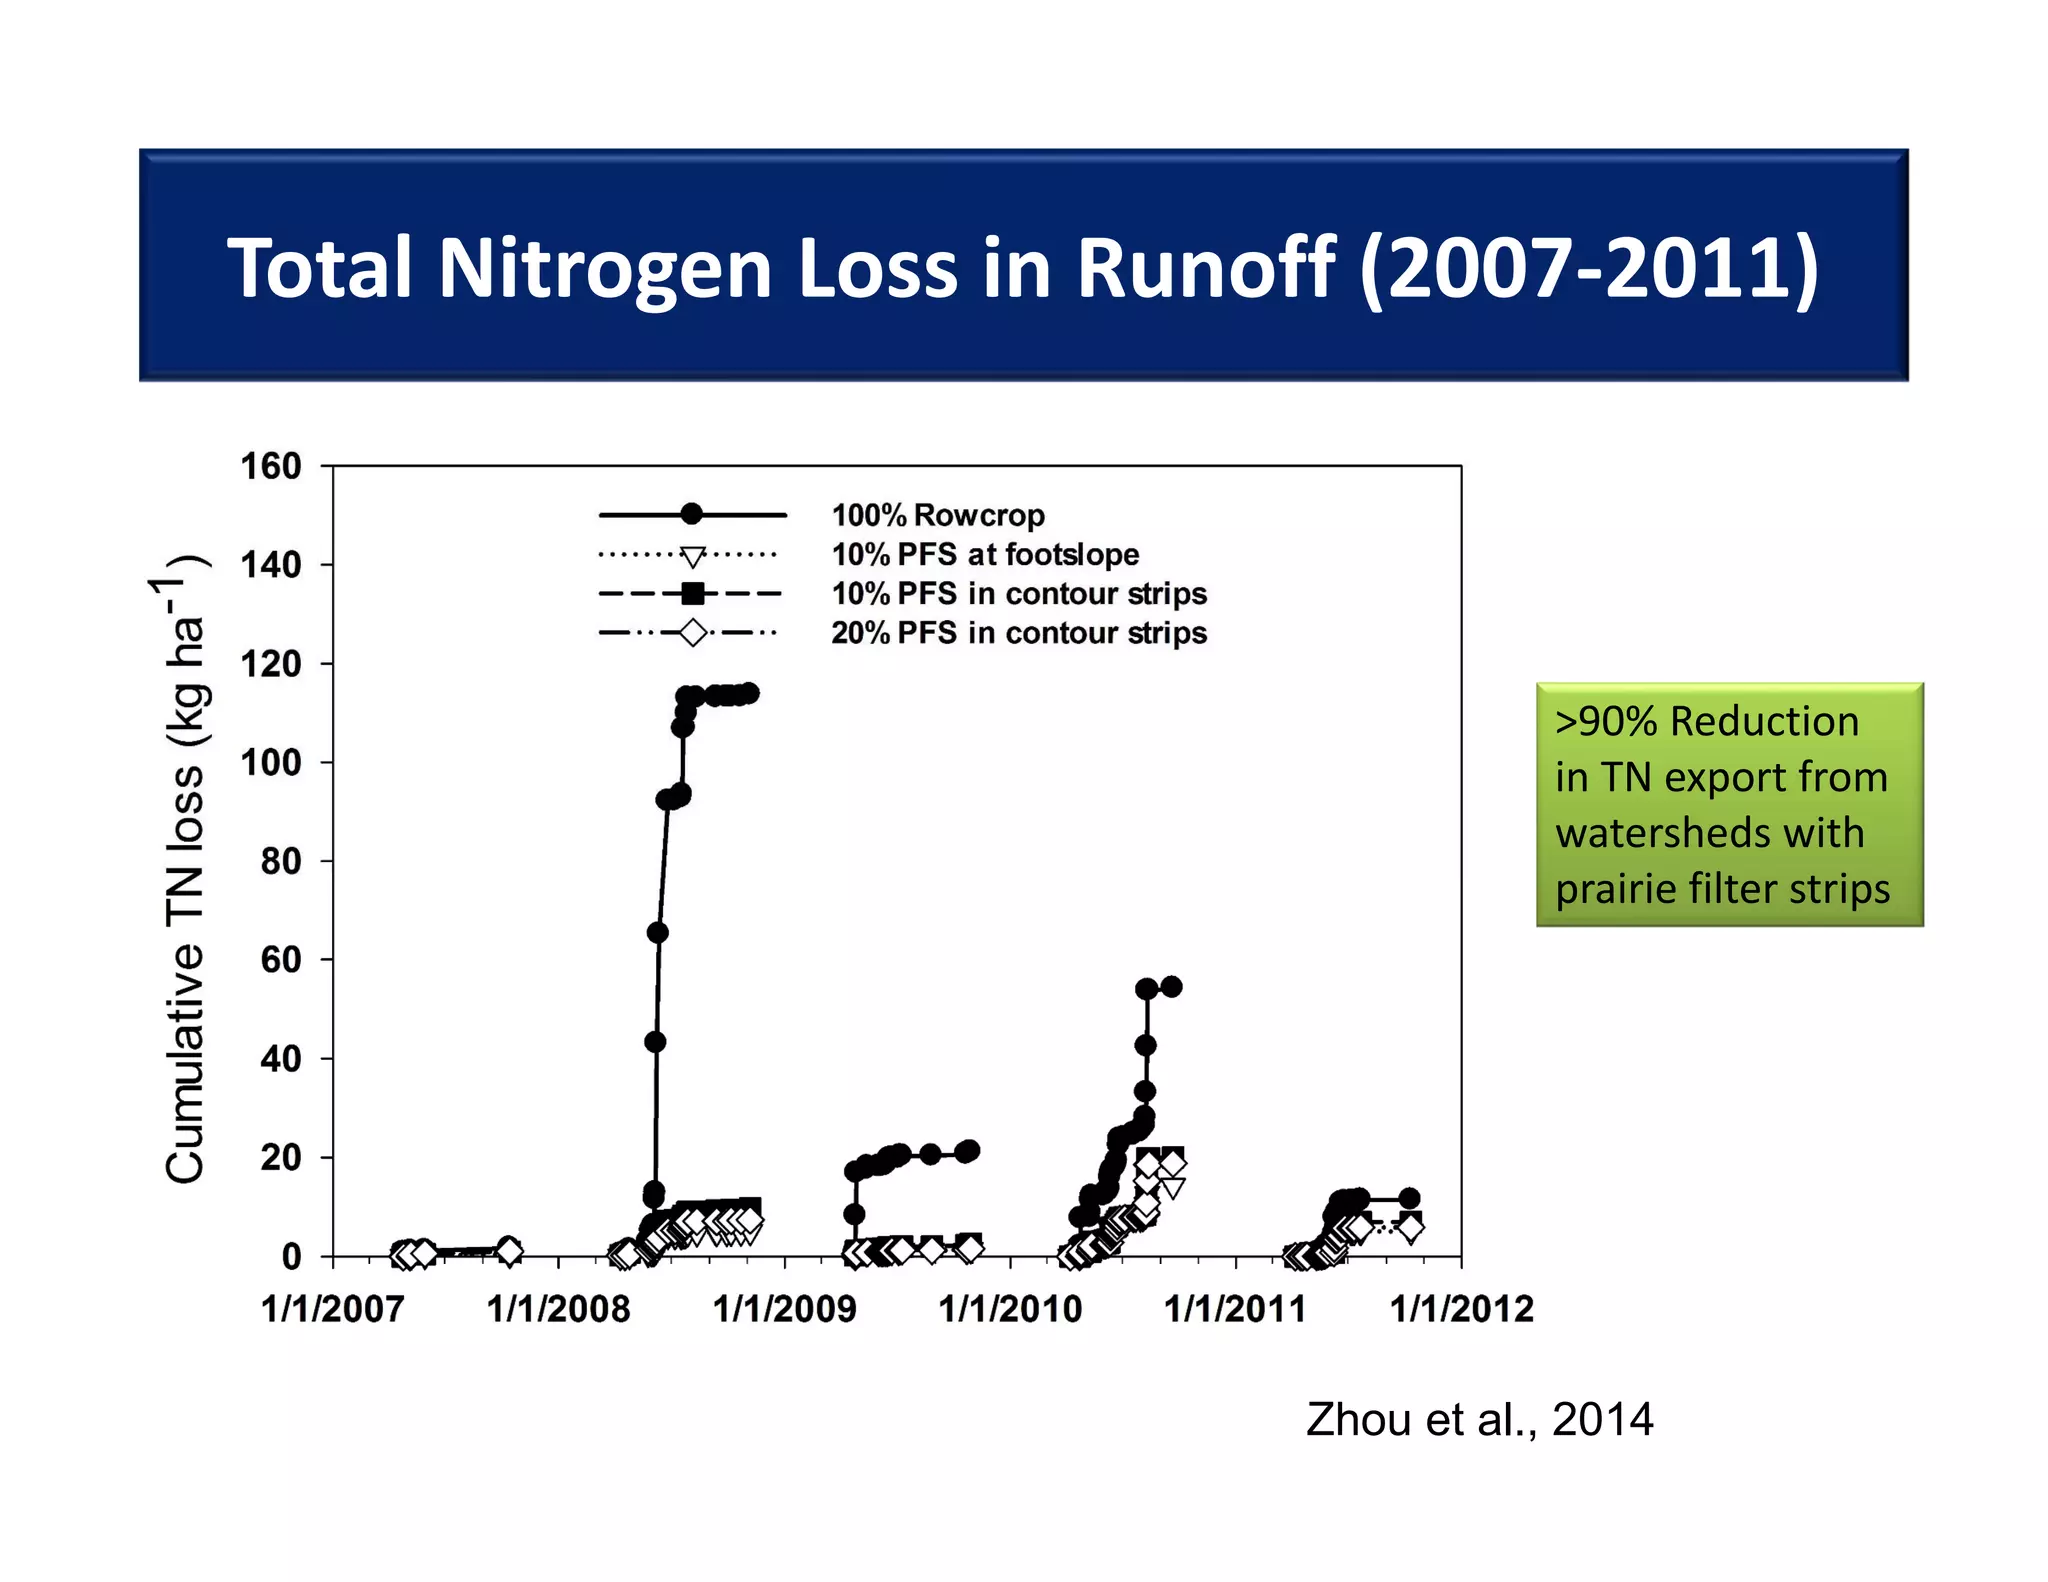
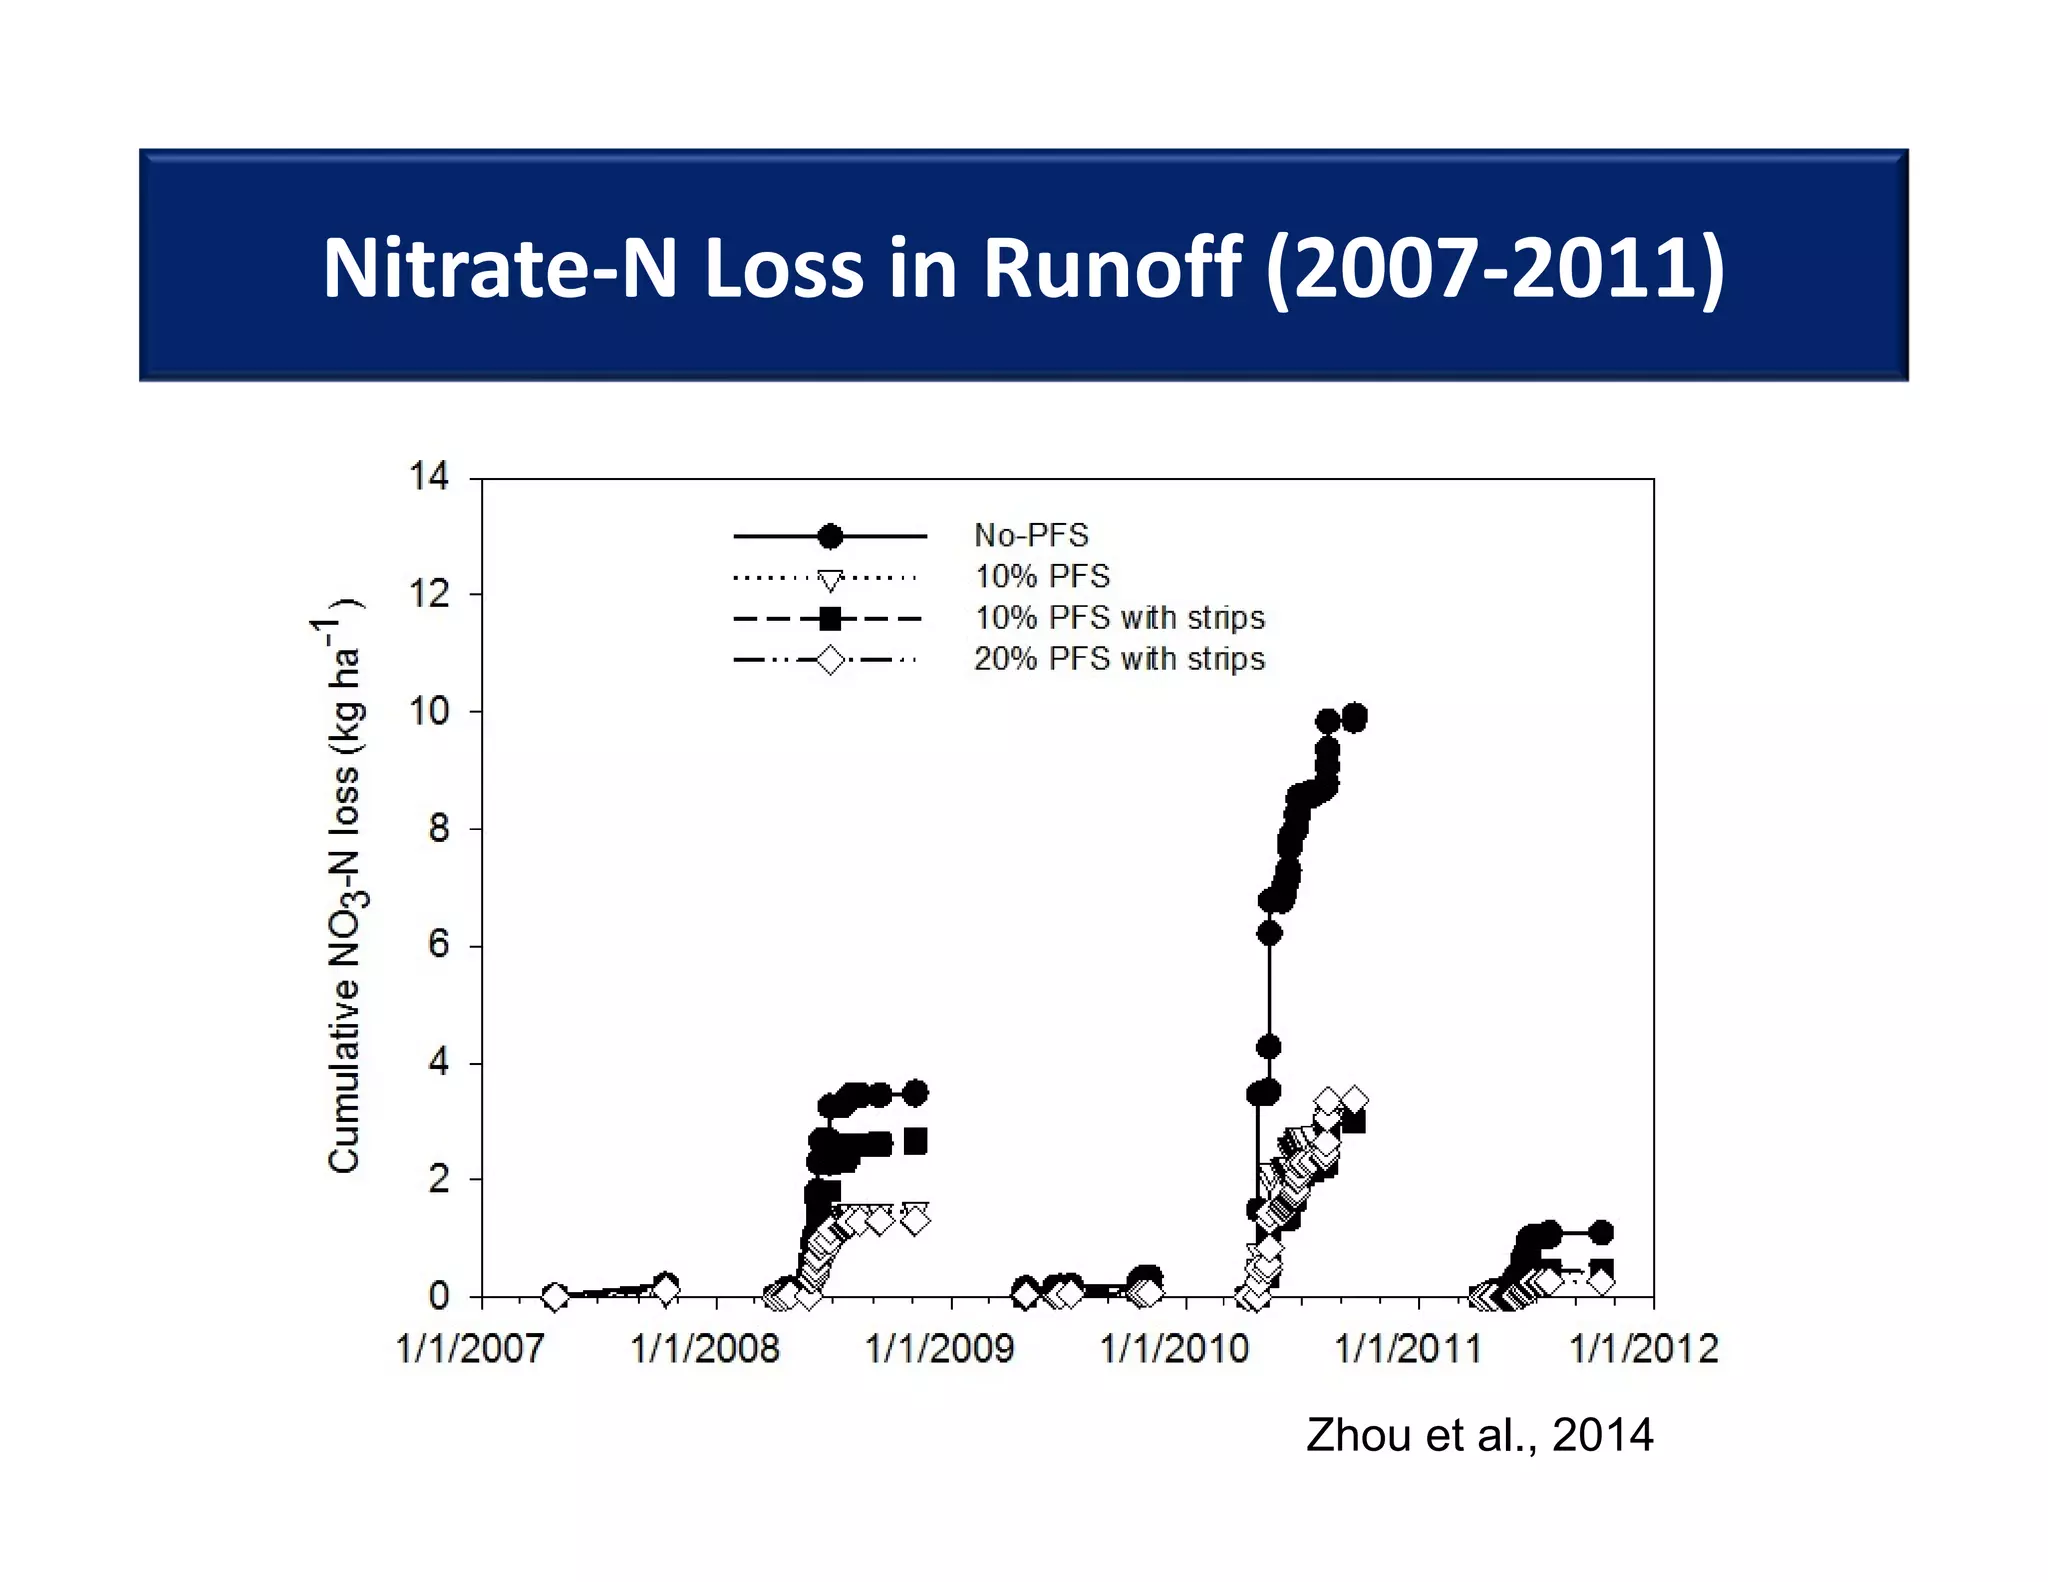
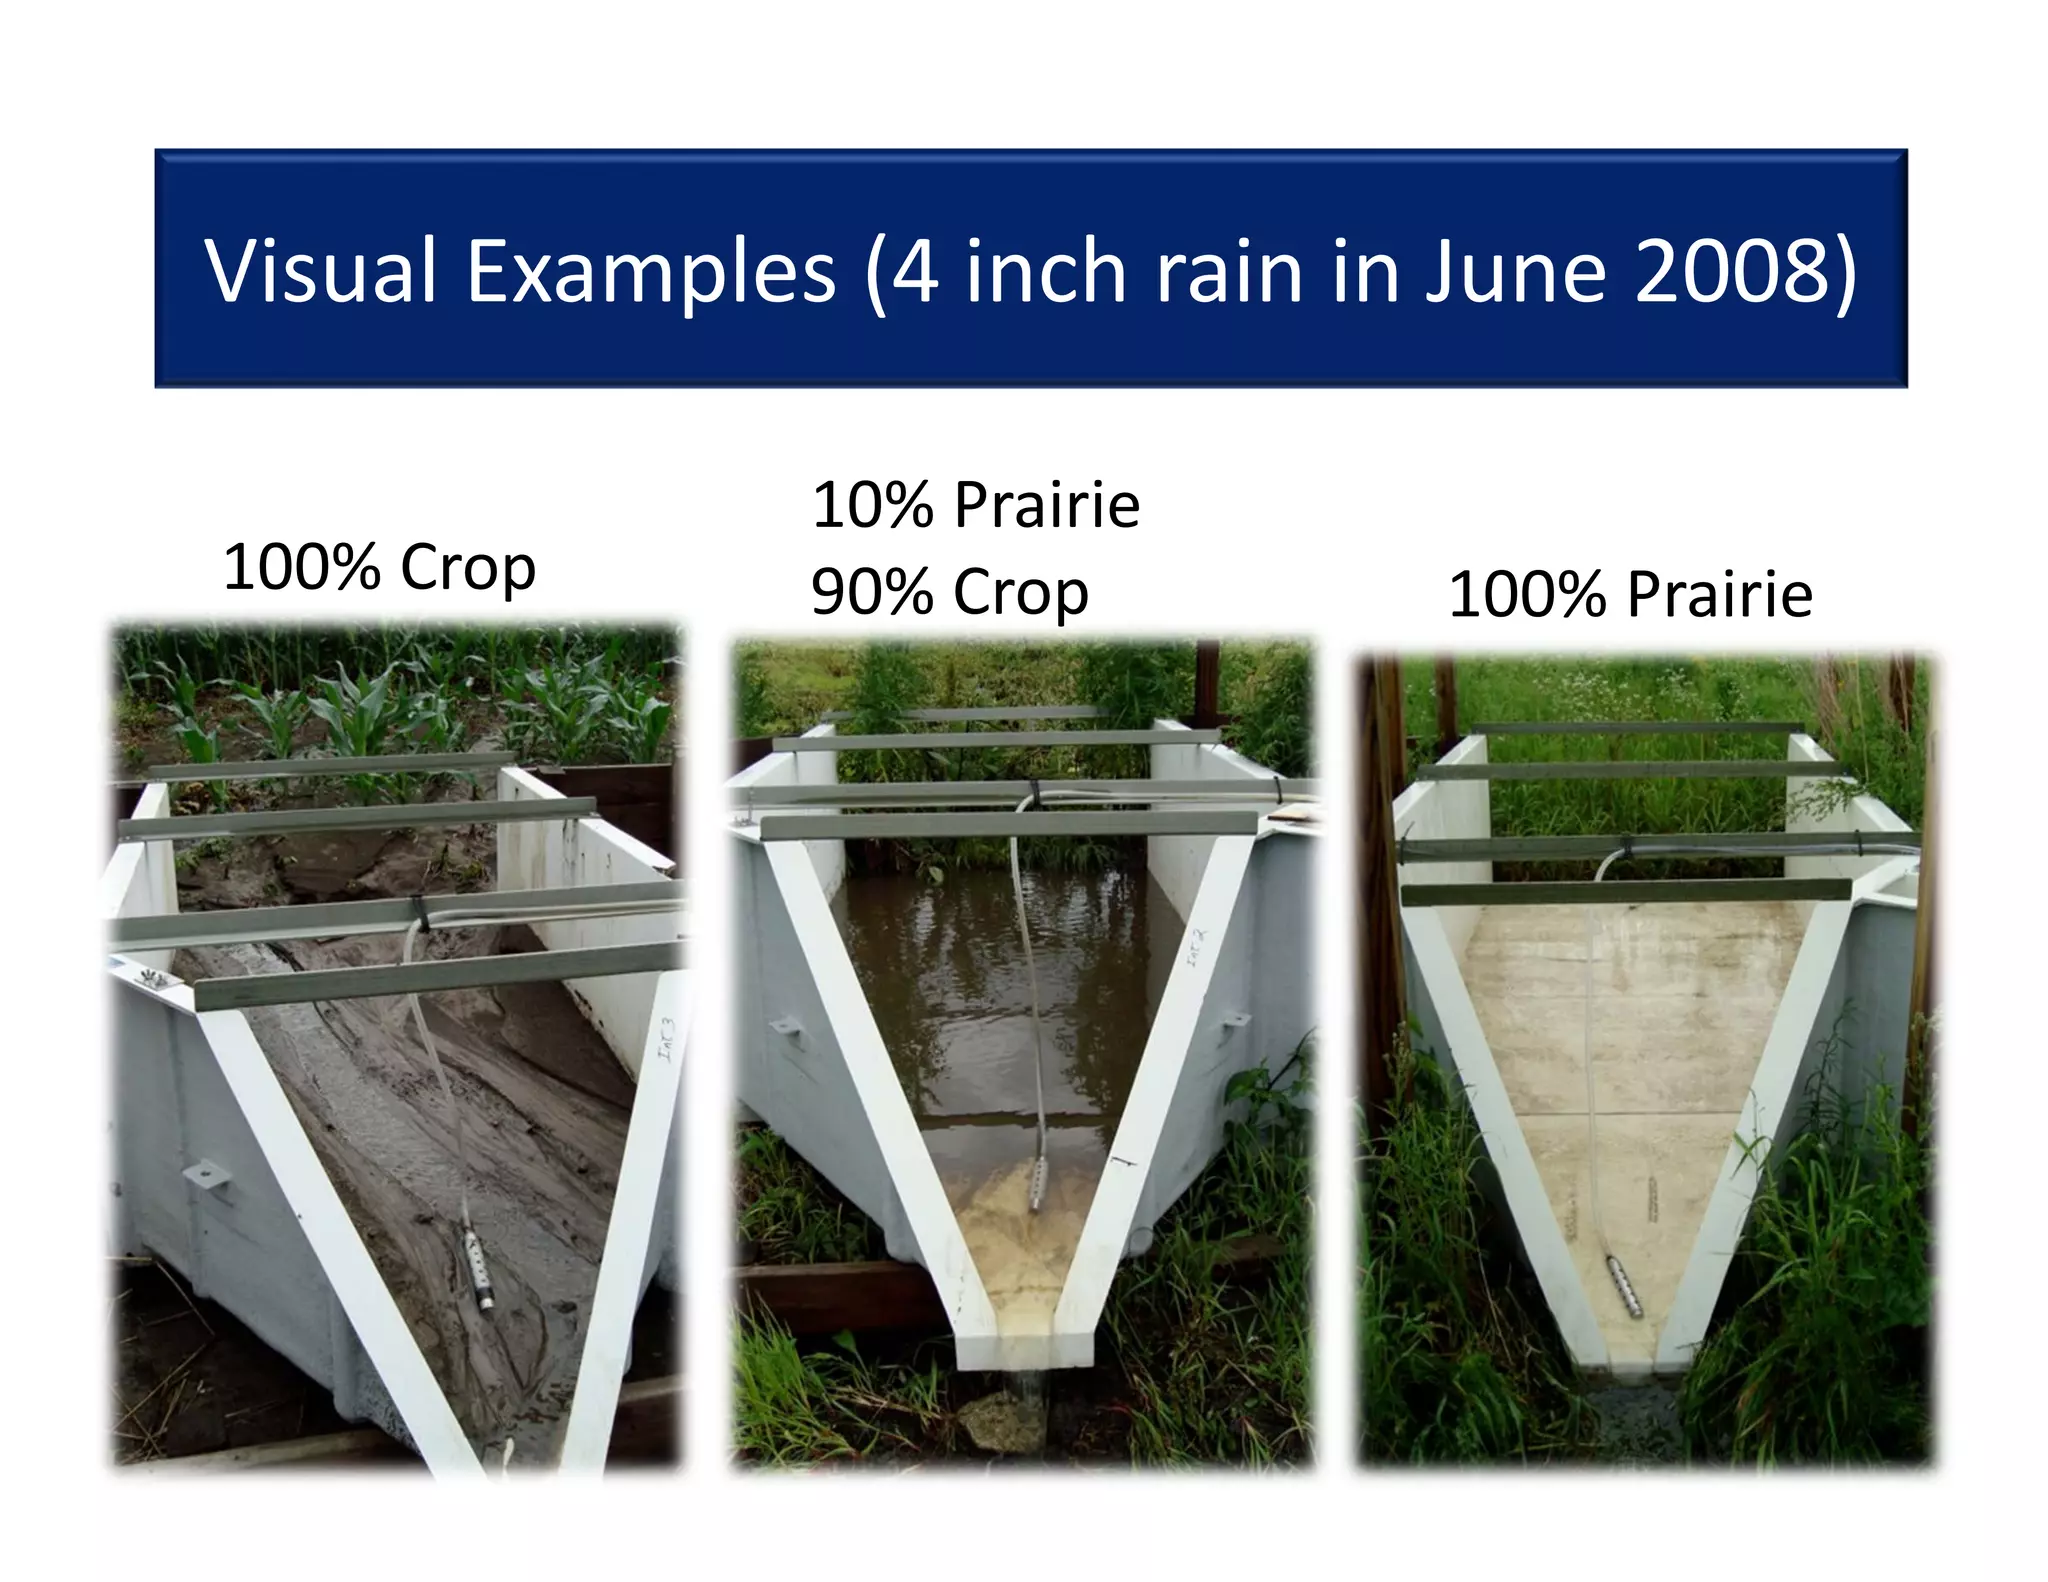
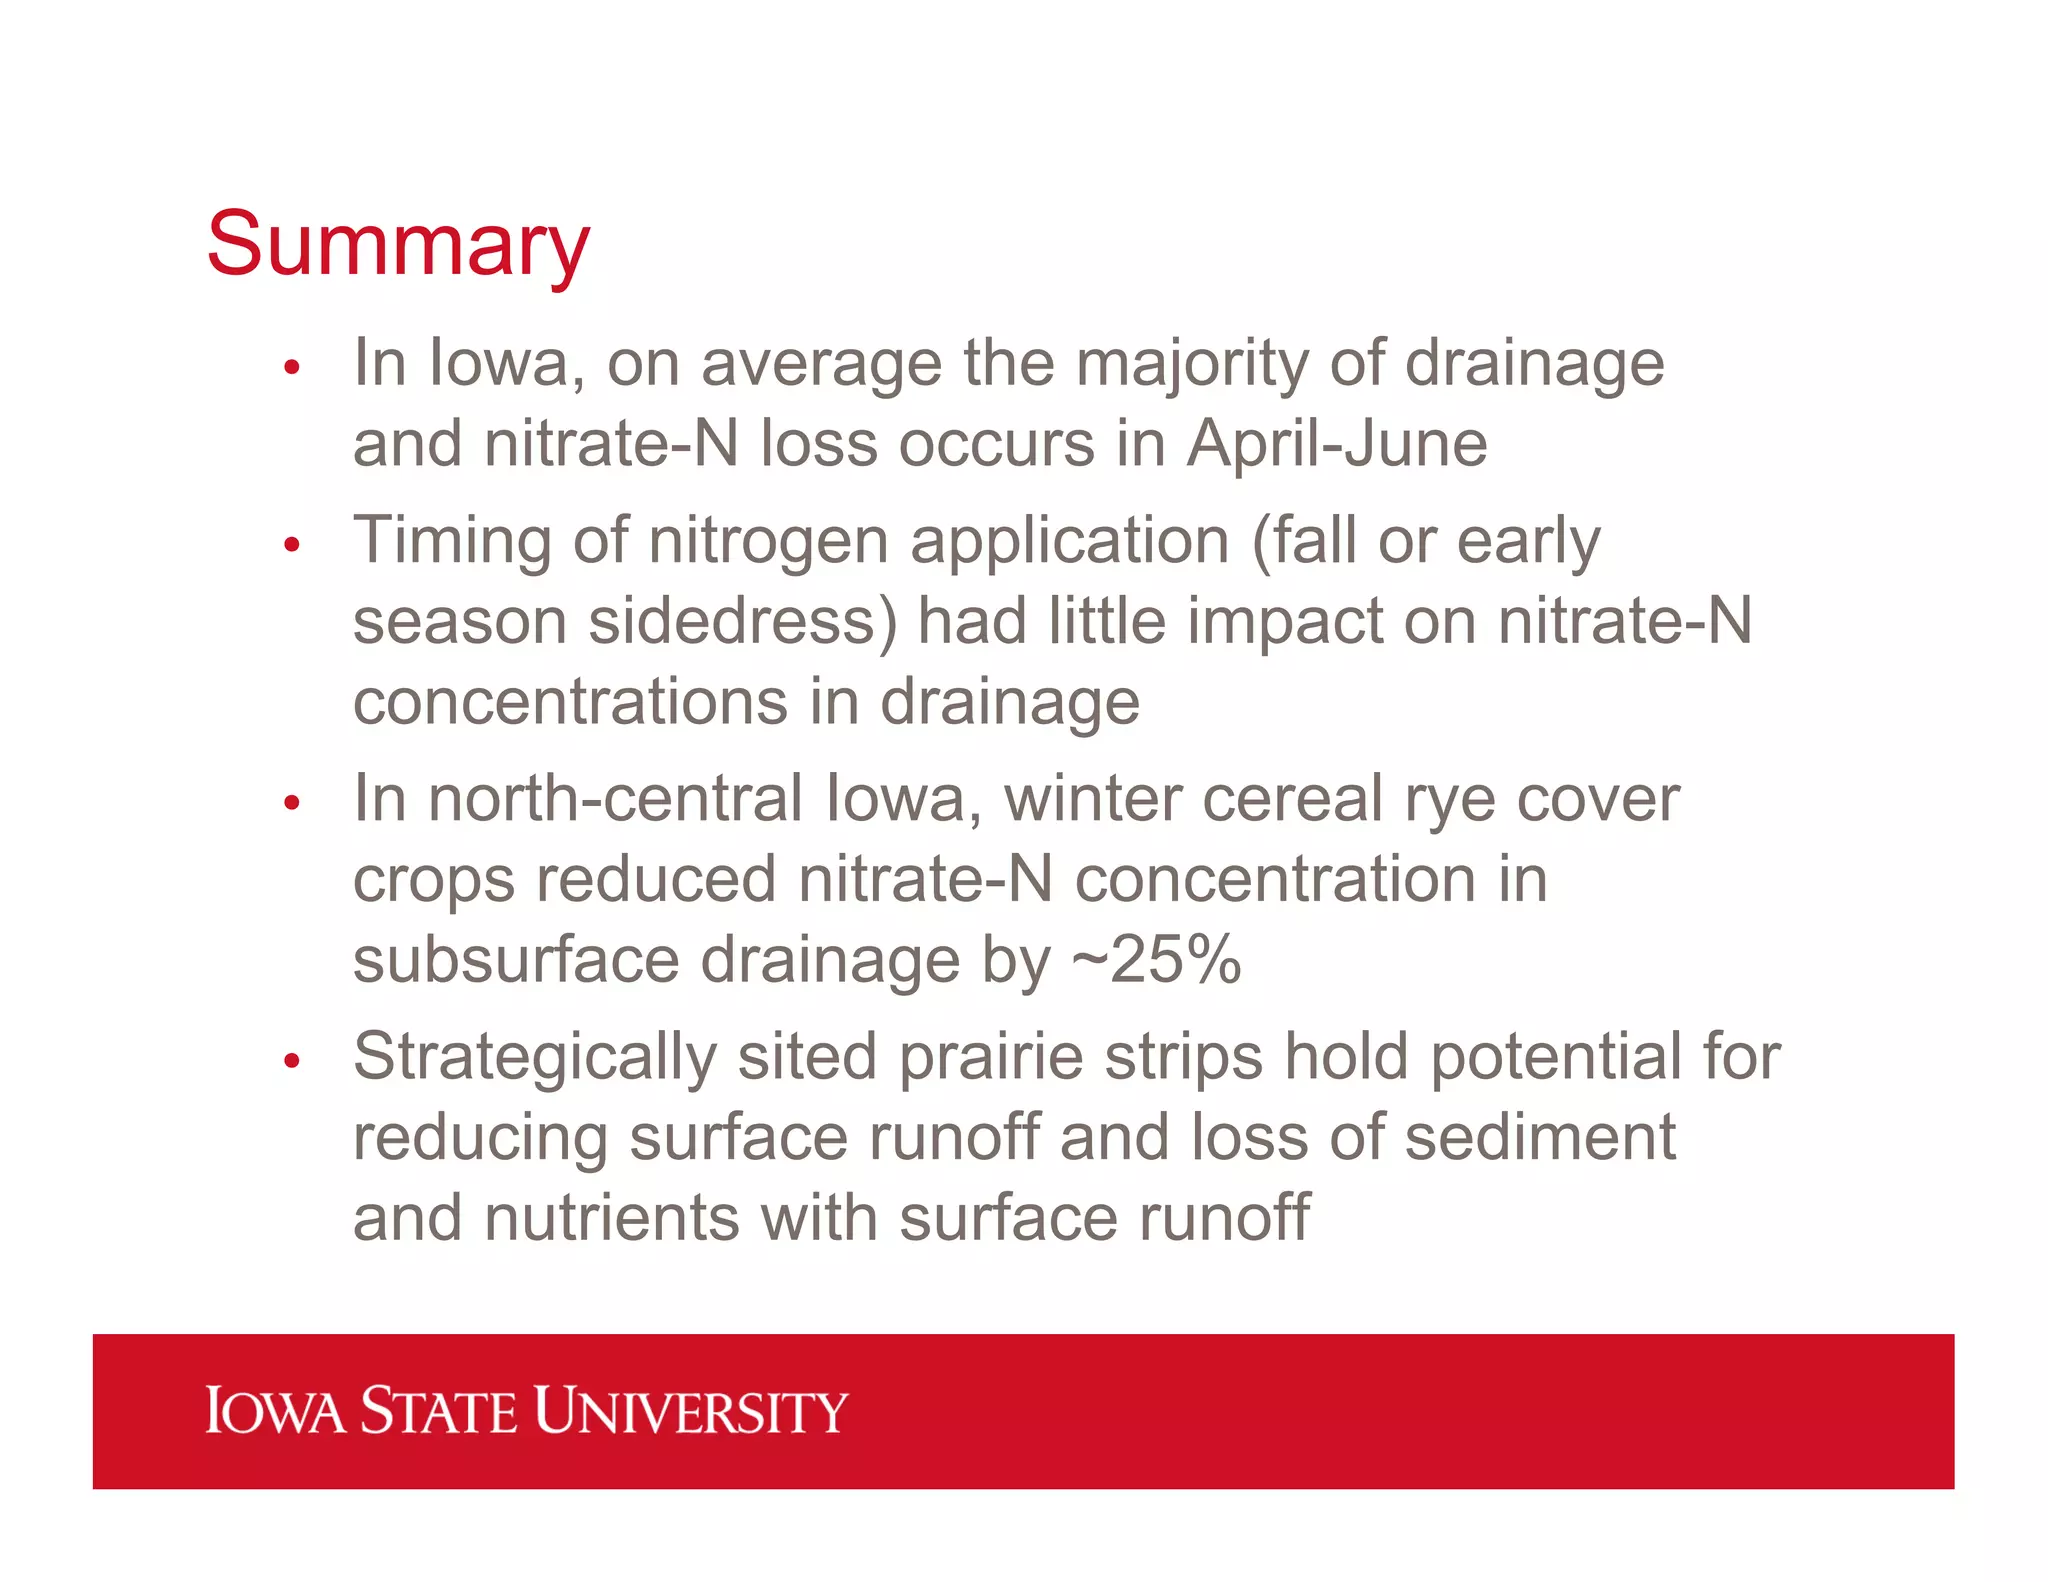

This document summarizes research on using various agricultural management practices to improve water quality. It describes studies that used replicated subsurface drainage plots to evaluate the impact of nitrogen application rate, timing, and source on nitrate levels in drainage water. Cover crops were found to reduce nitrate concentrations by 25%. It also describes a watershed experiment showing that strategically placed prairie strips reduced sediment and nutrient losses in surface runoff by over 90% compared to watersheds without prairie strips. The research demonstrated the potential for cover crops and prairie strips to help protect water quality.


