Download as PDF, PPTX
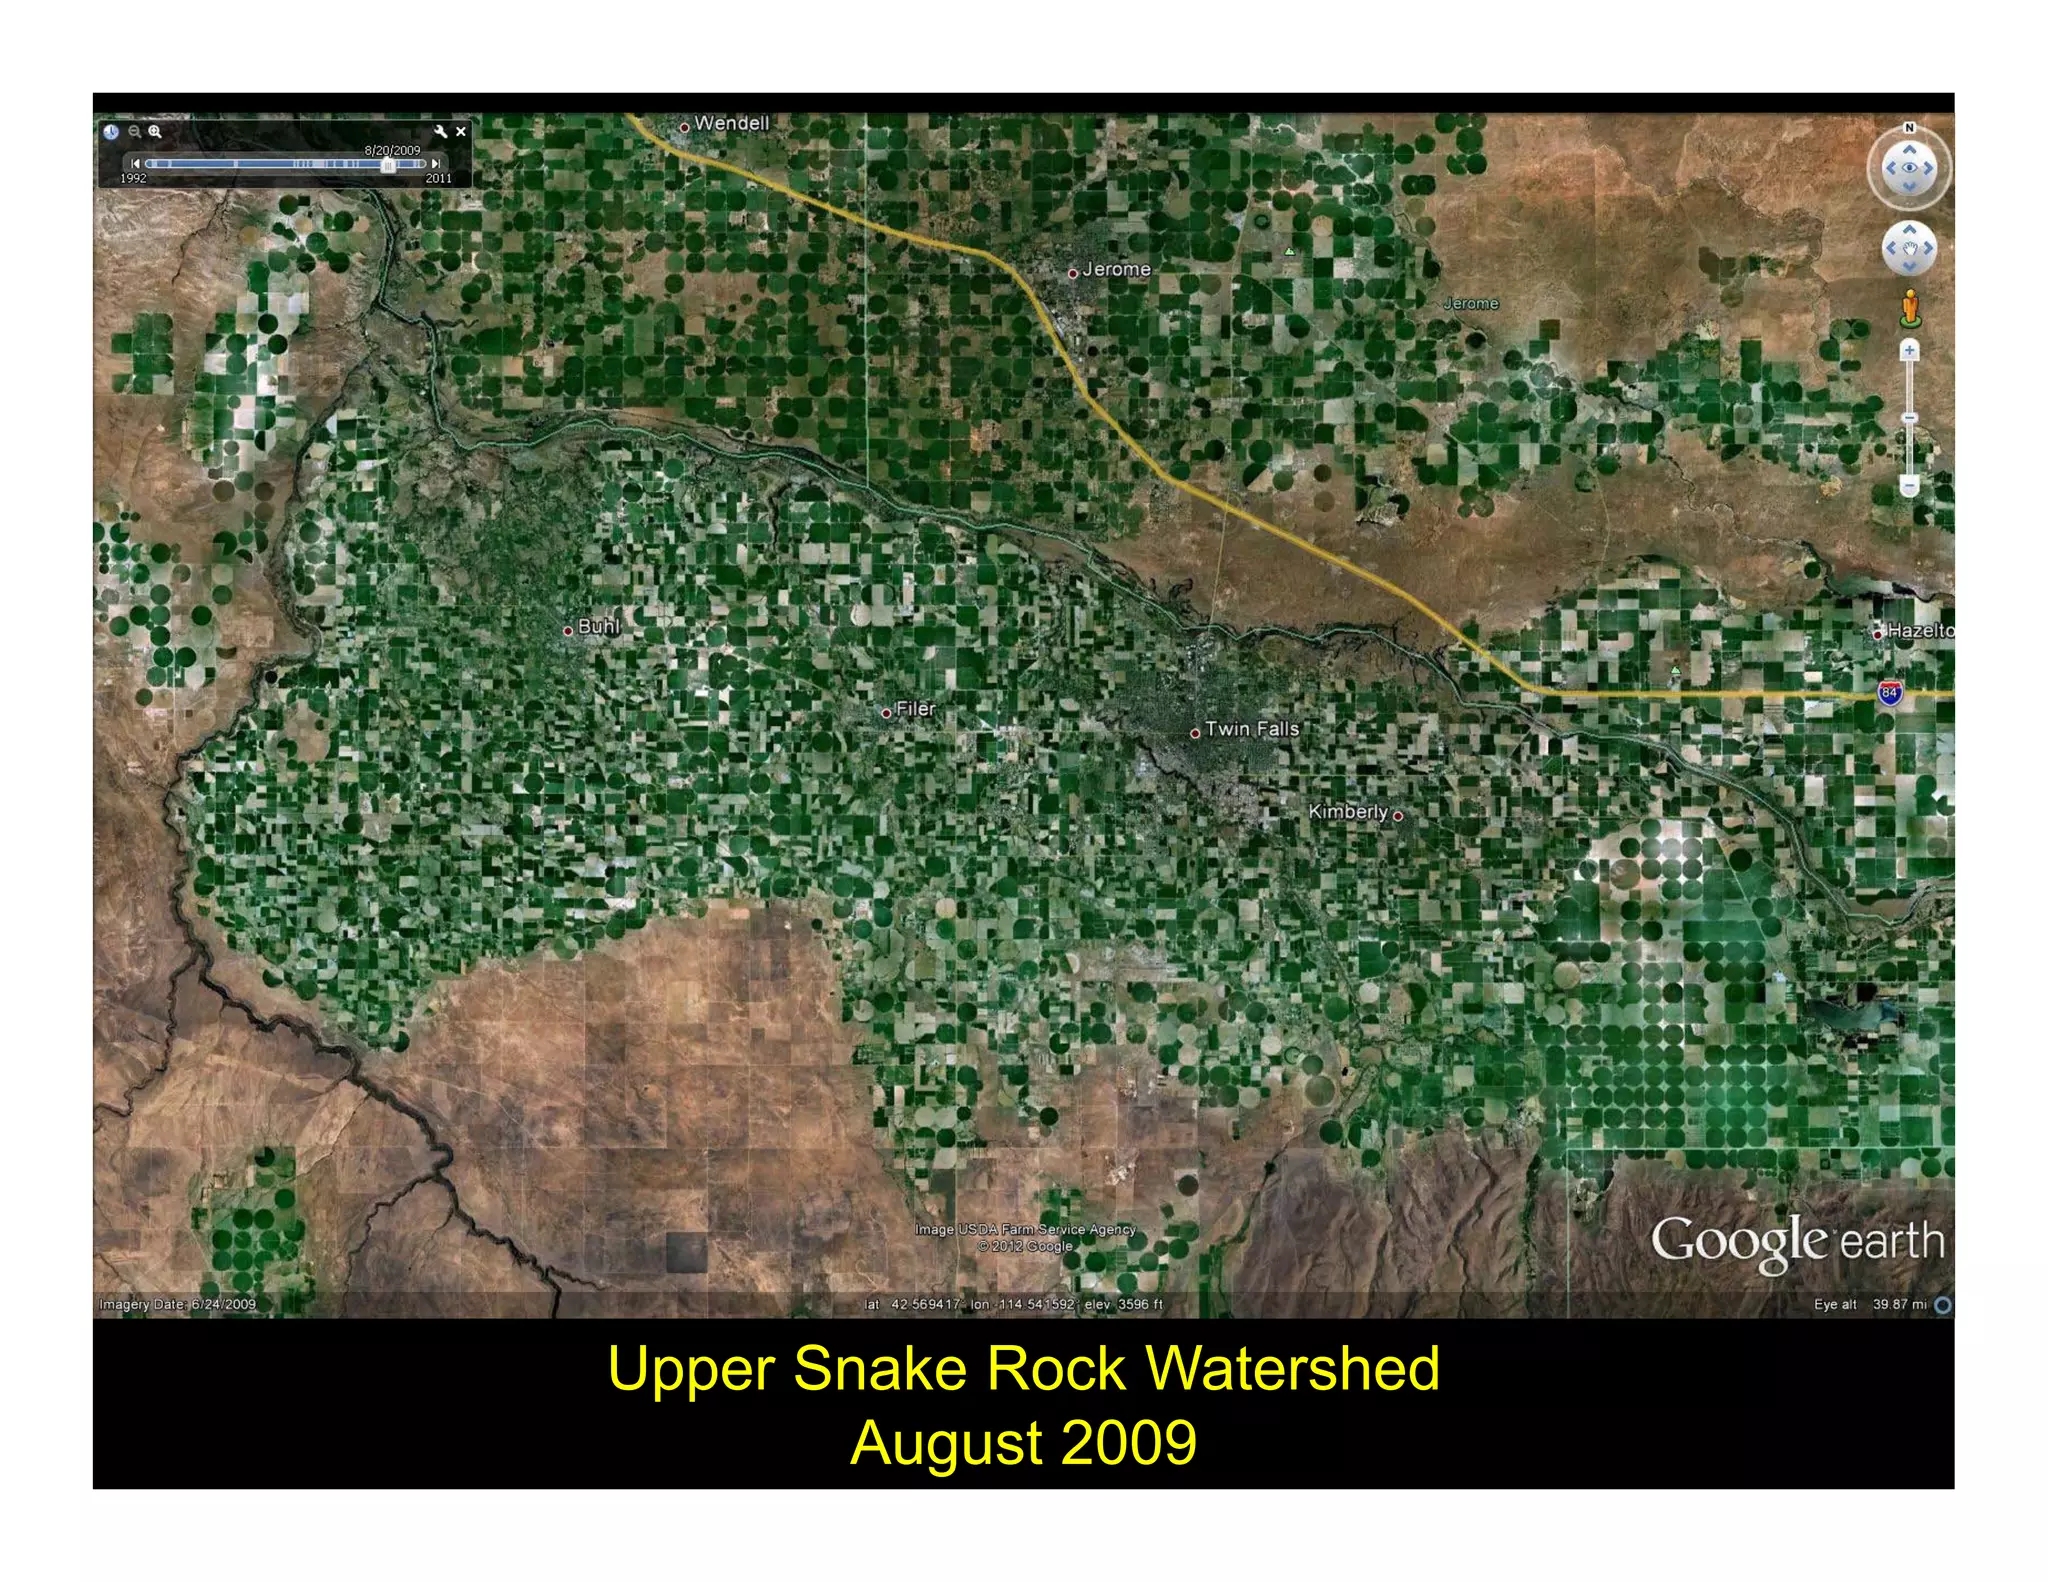
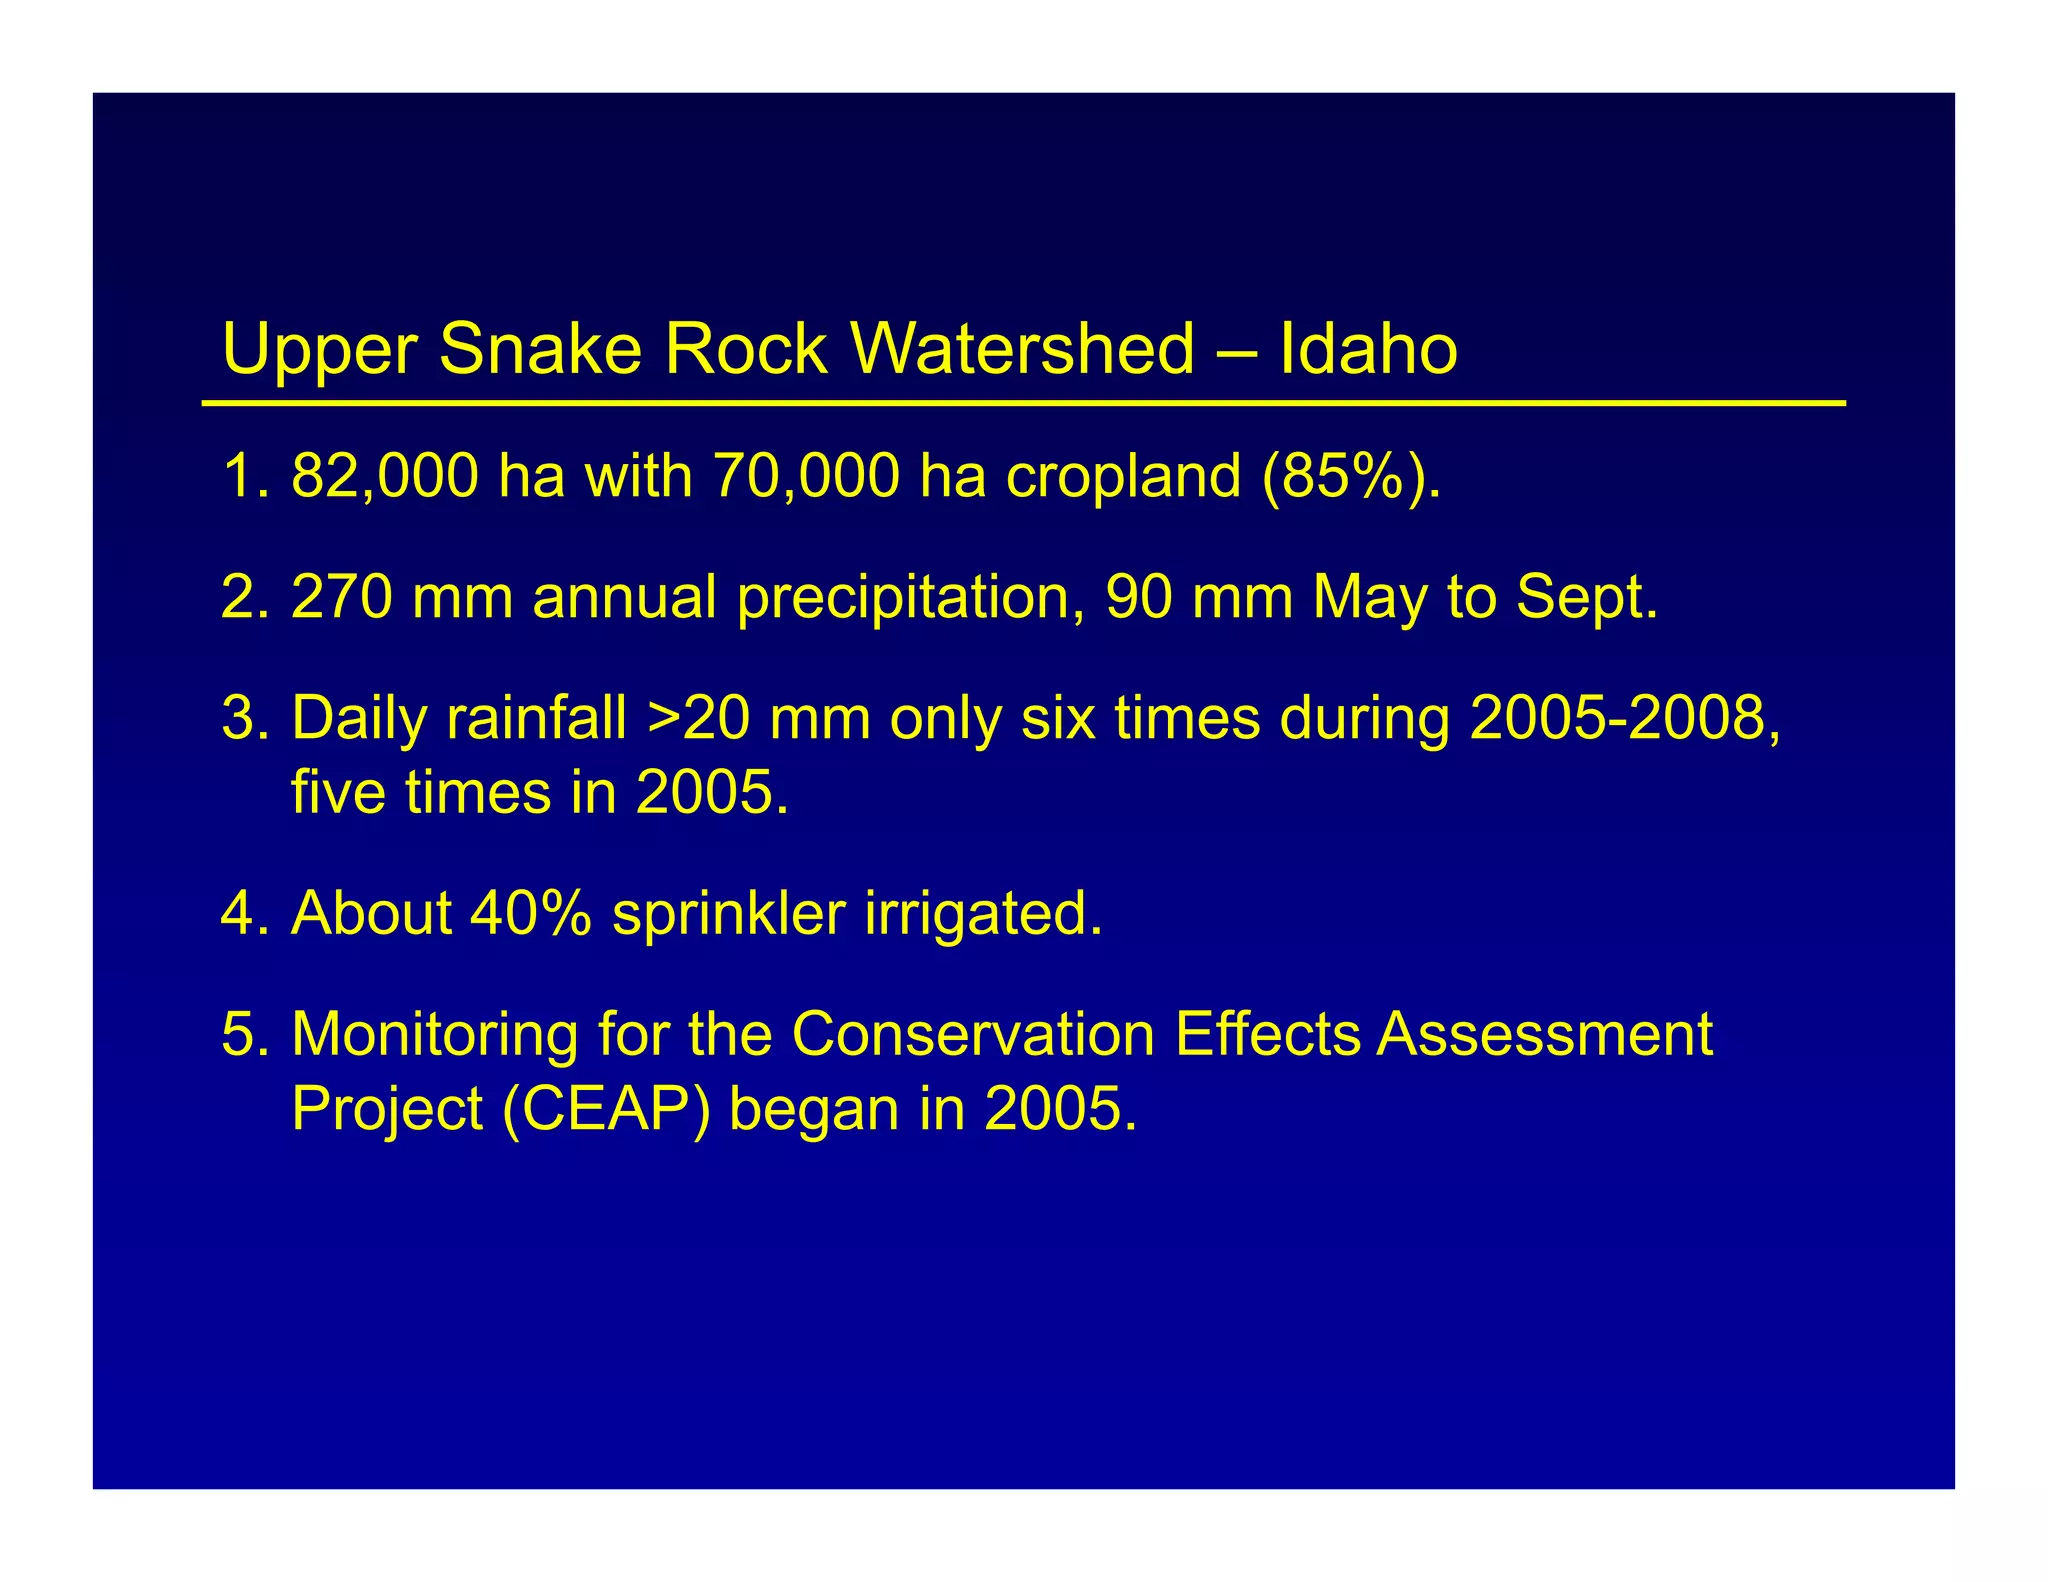
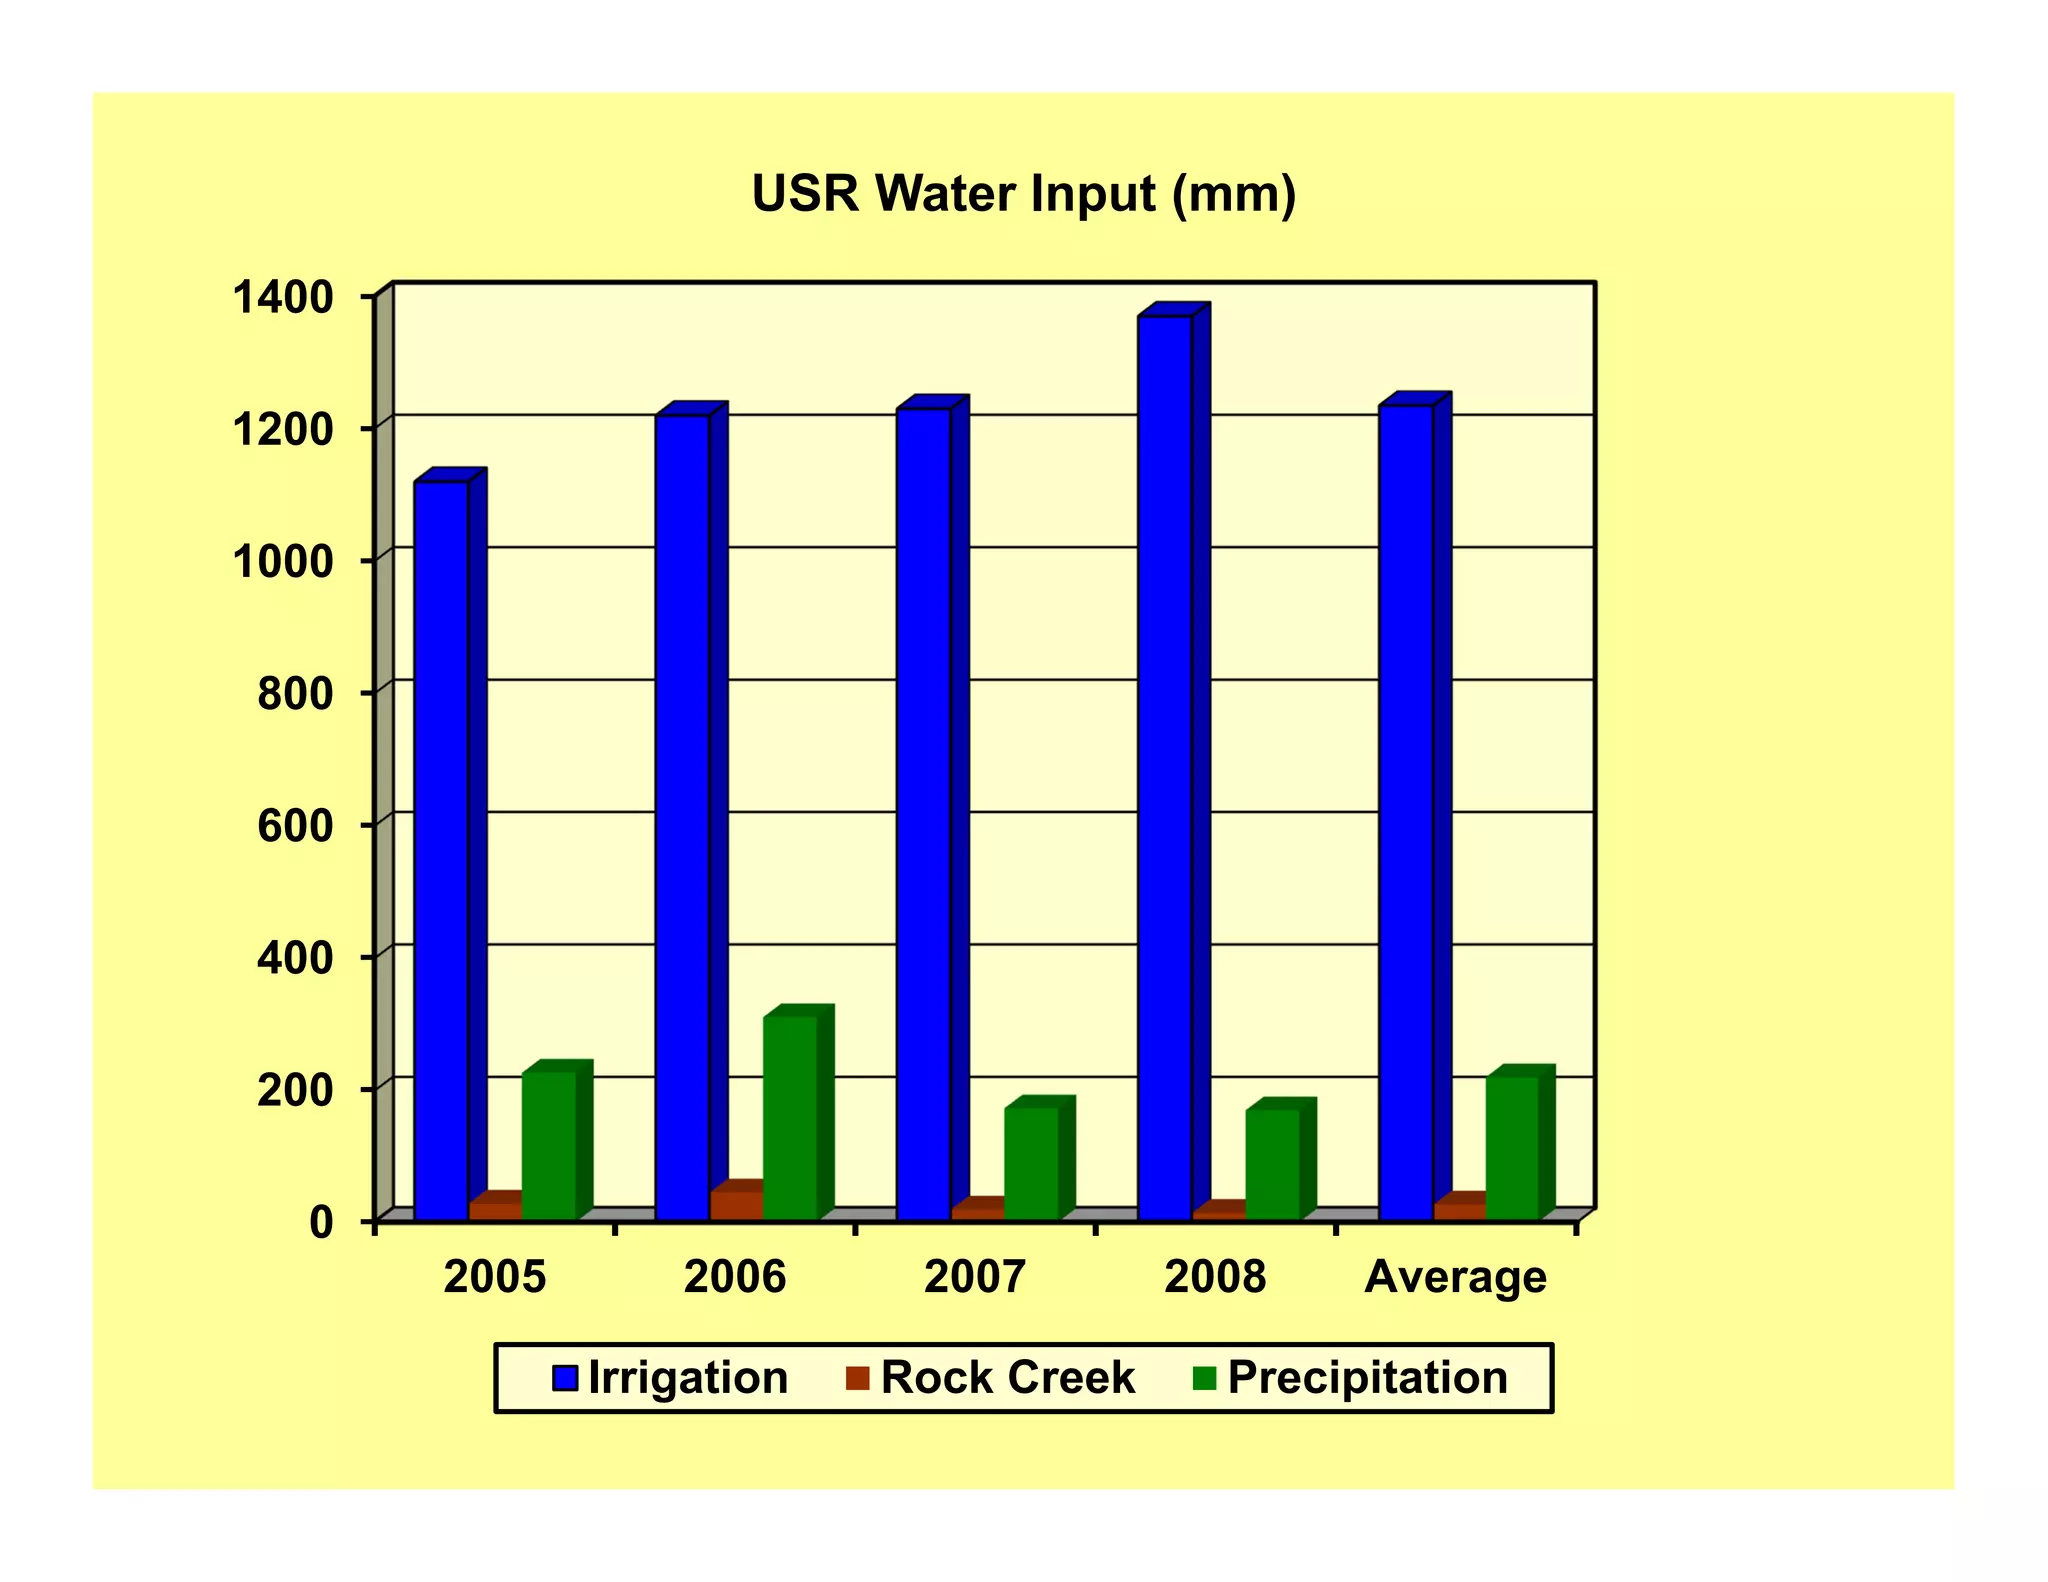
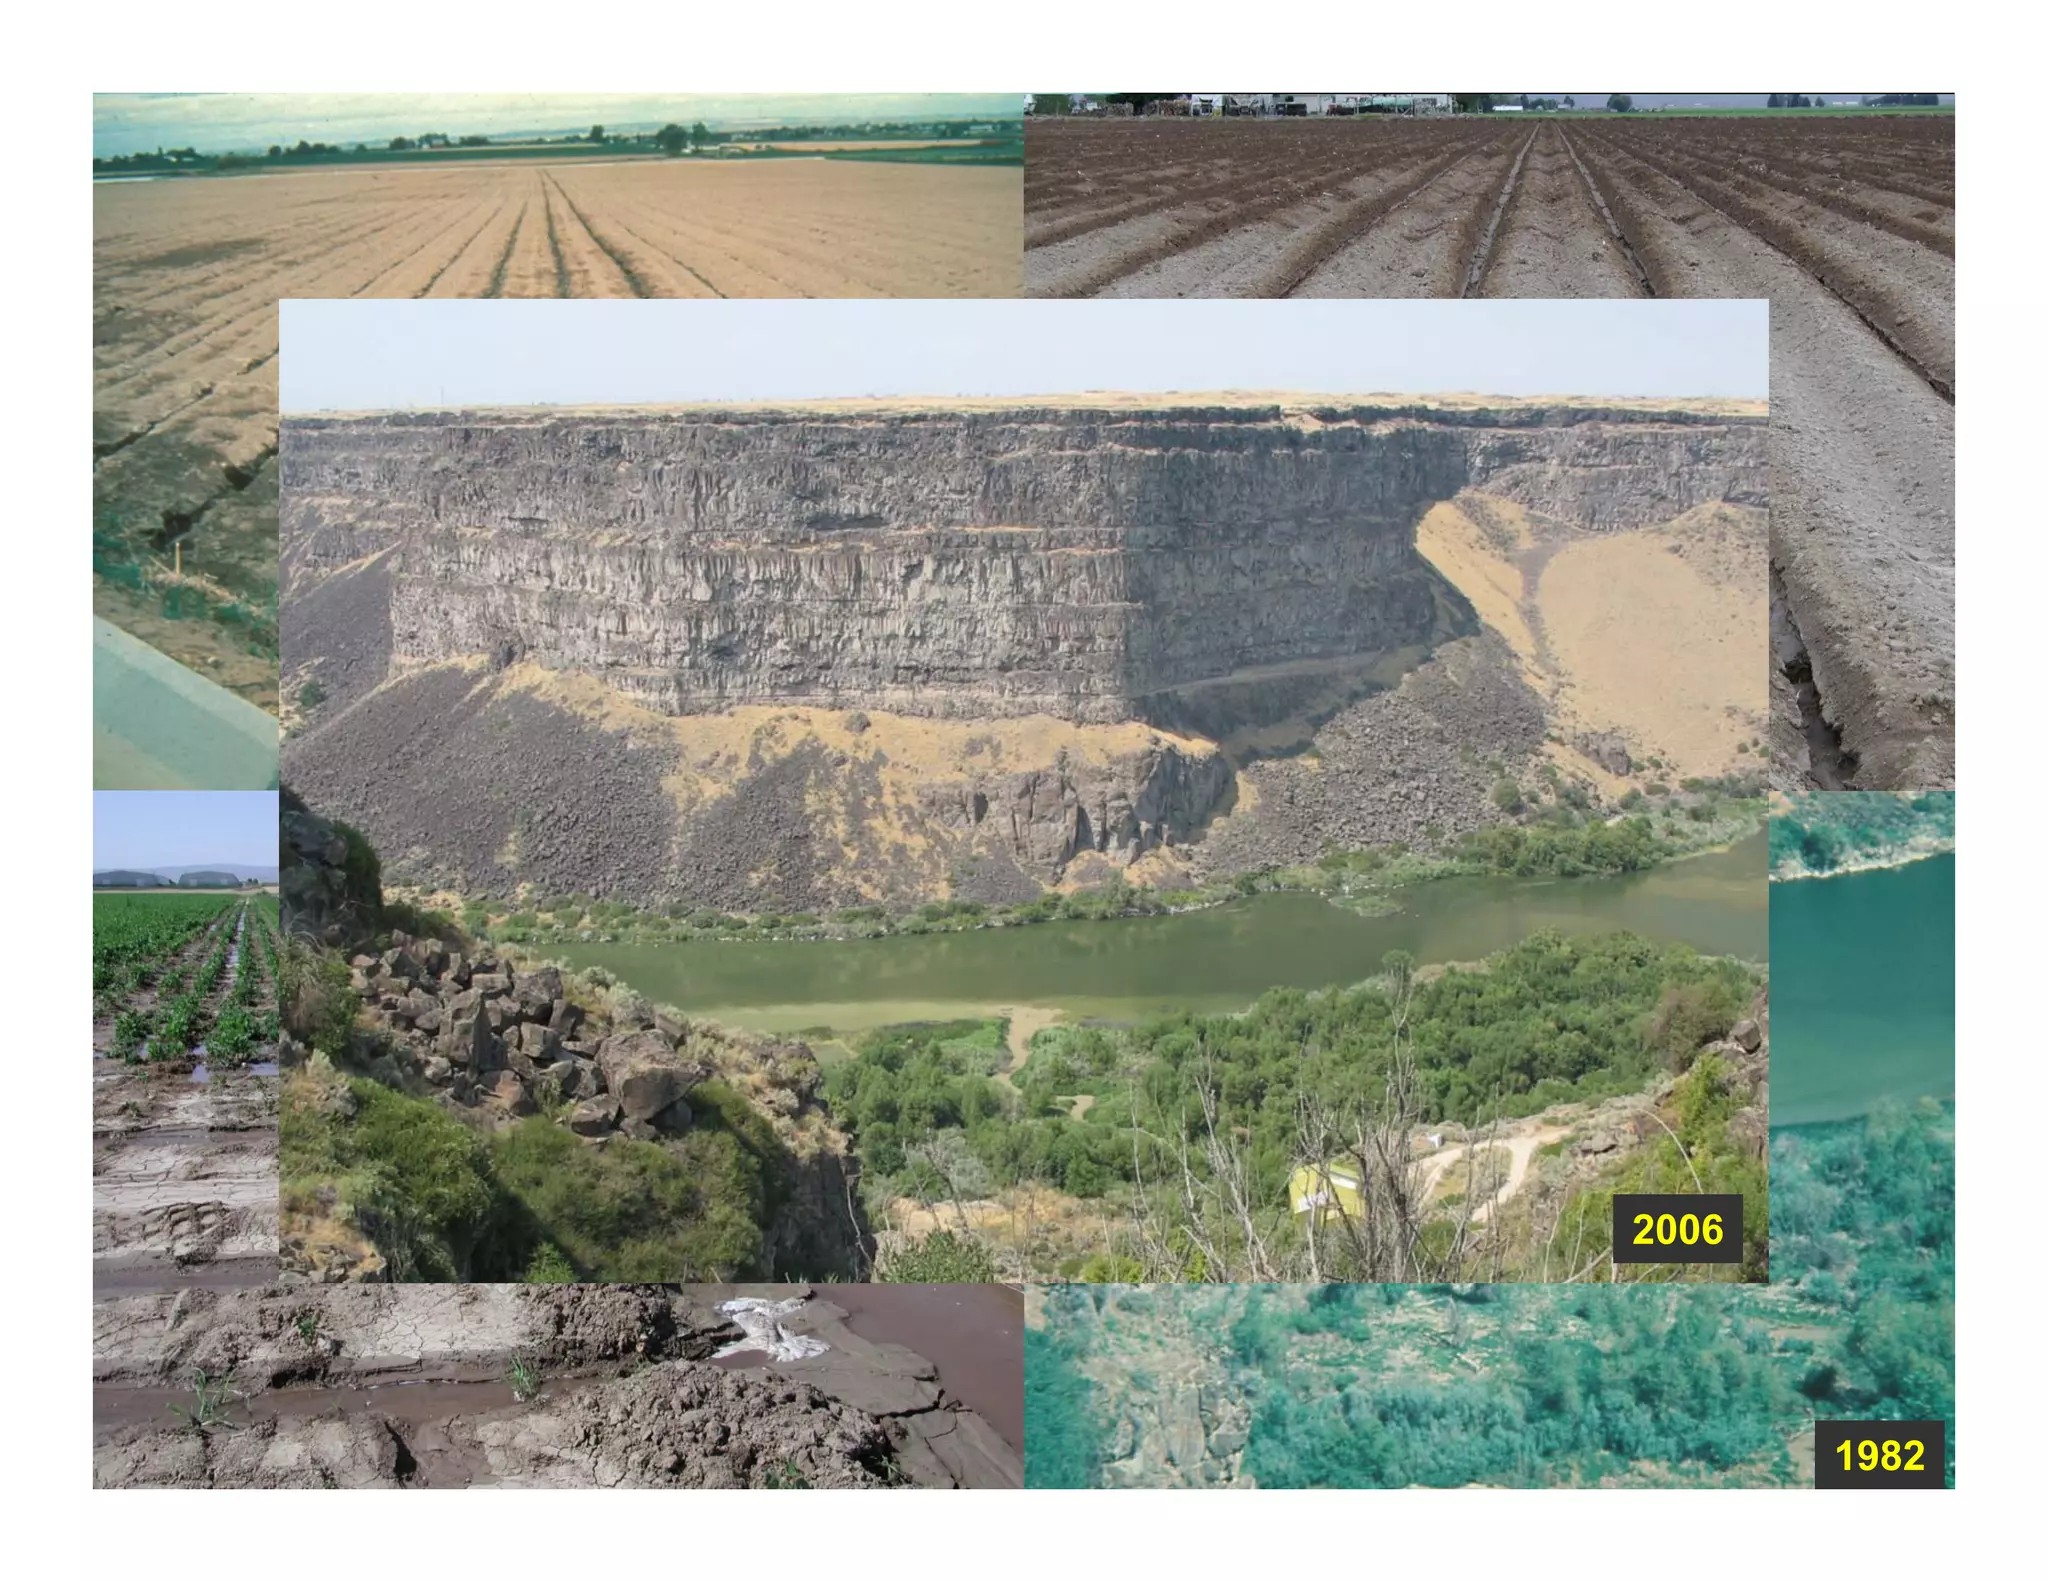
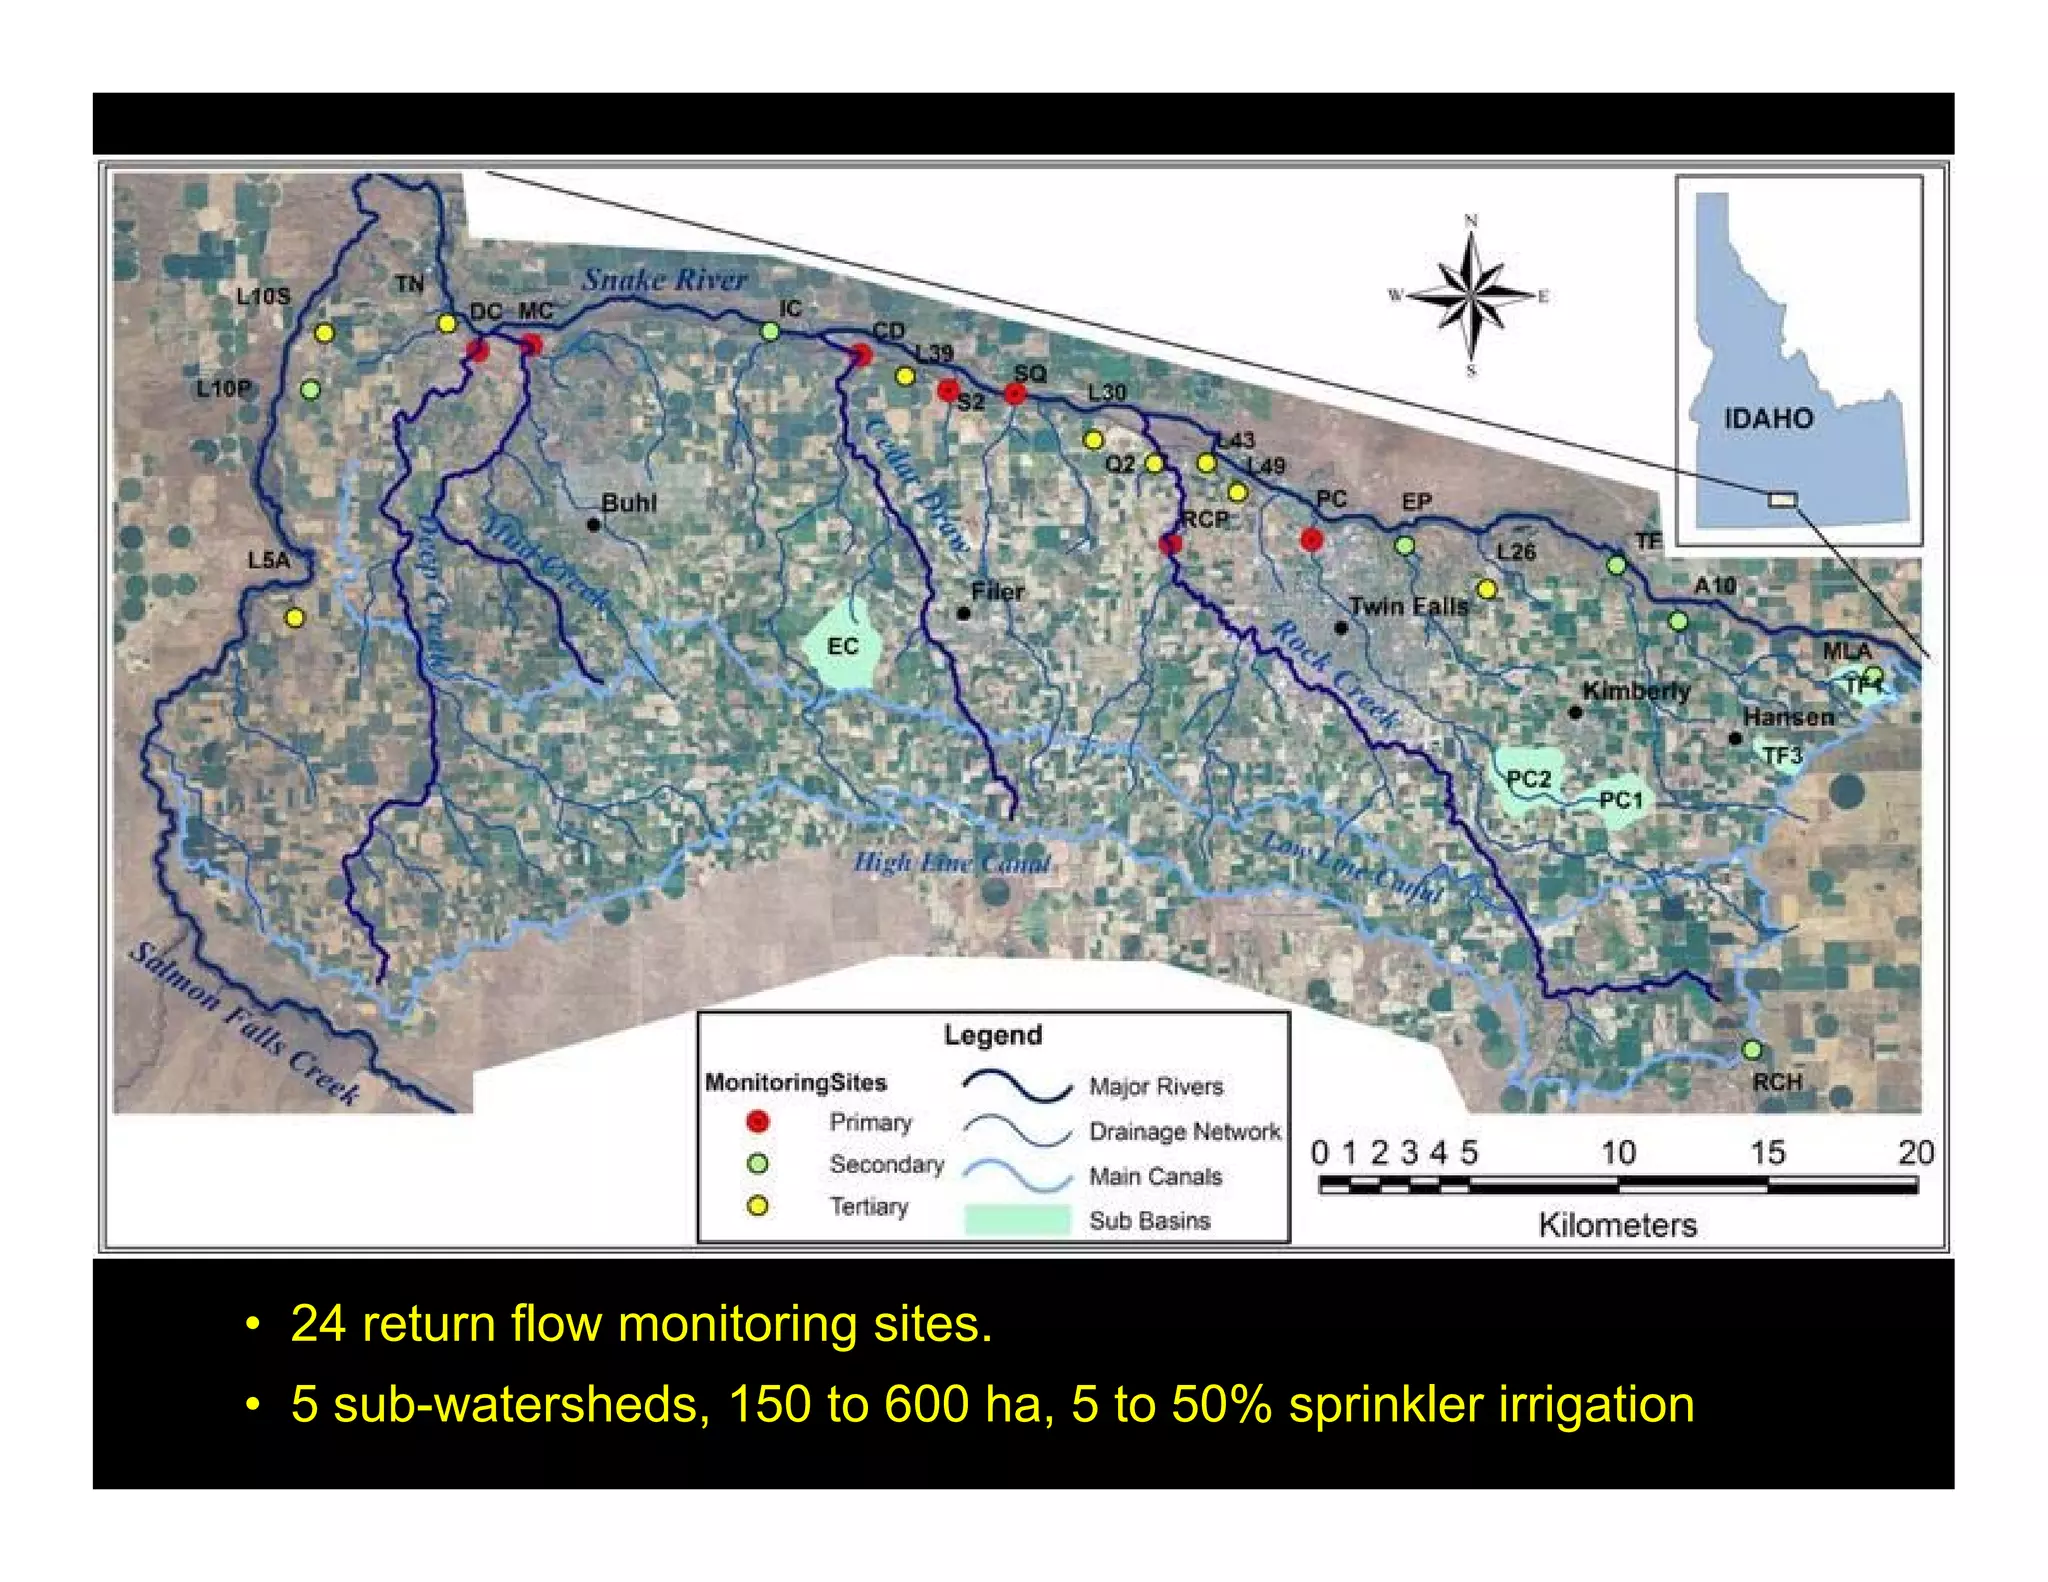
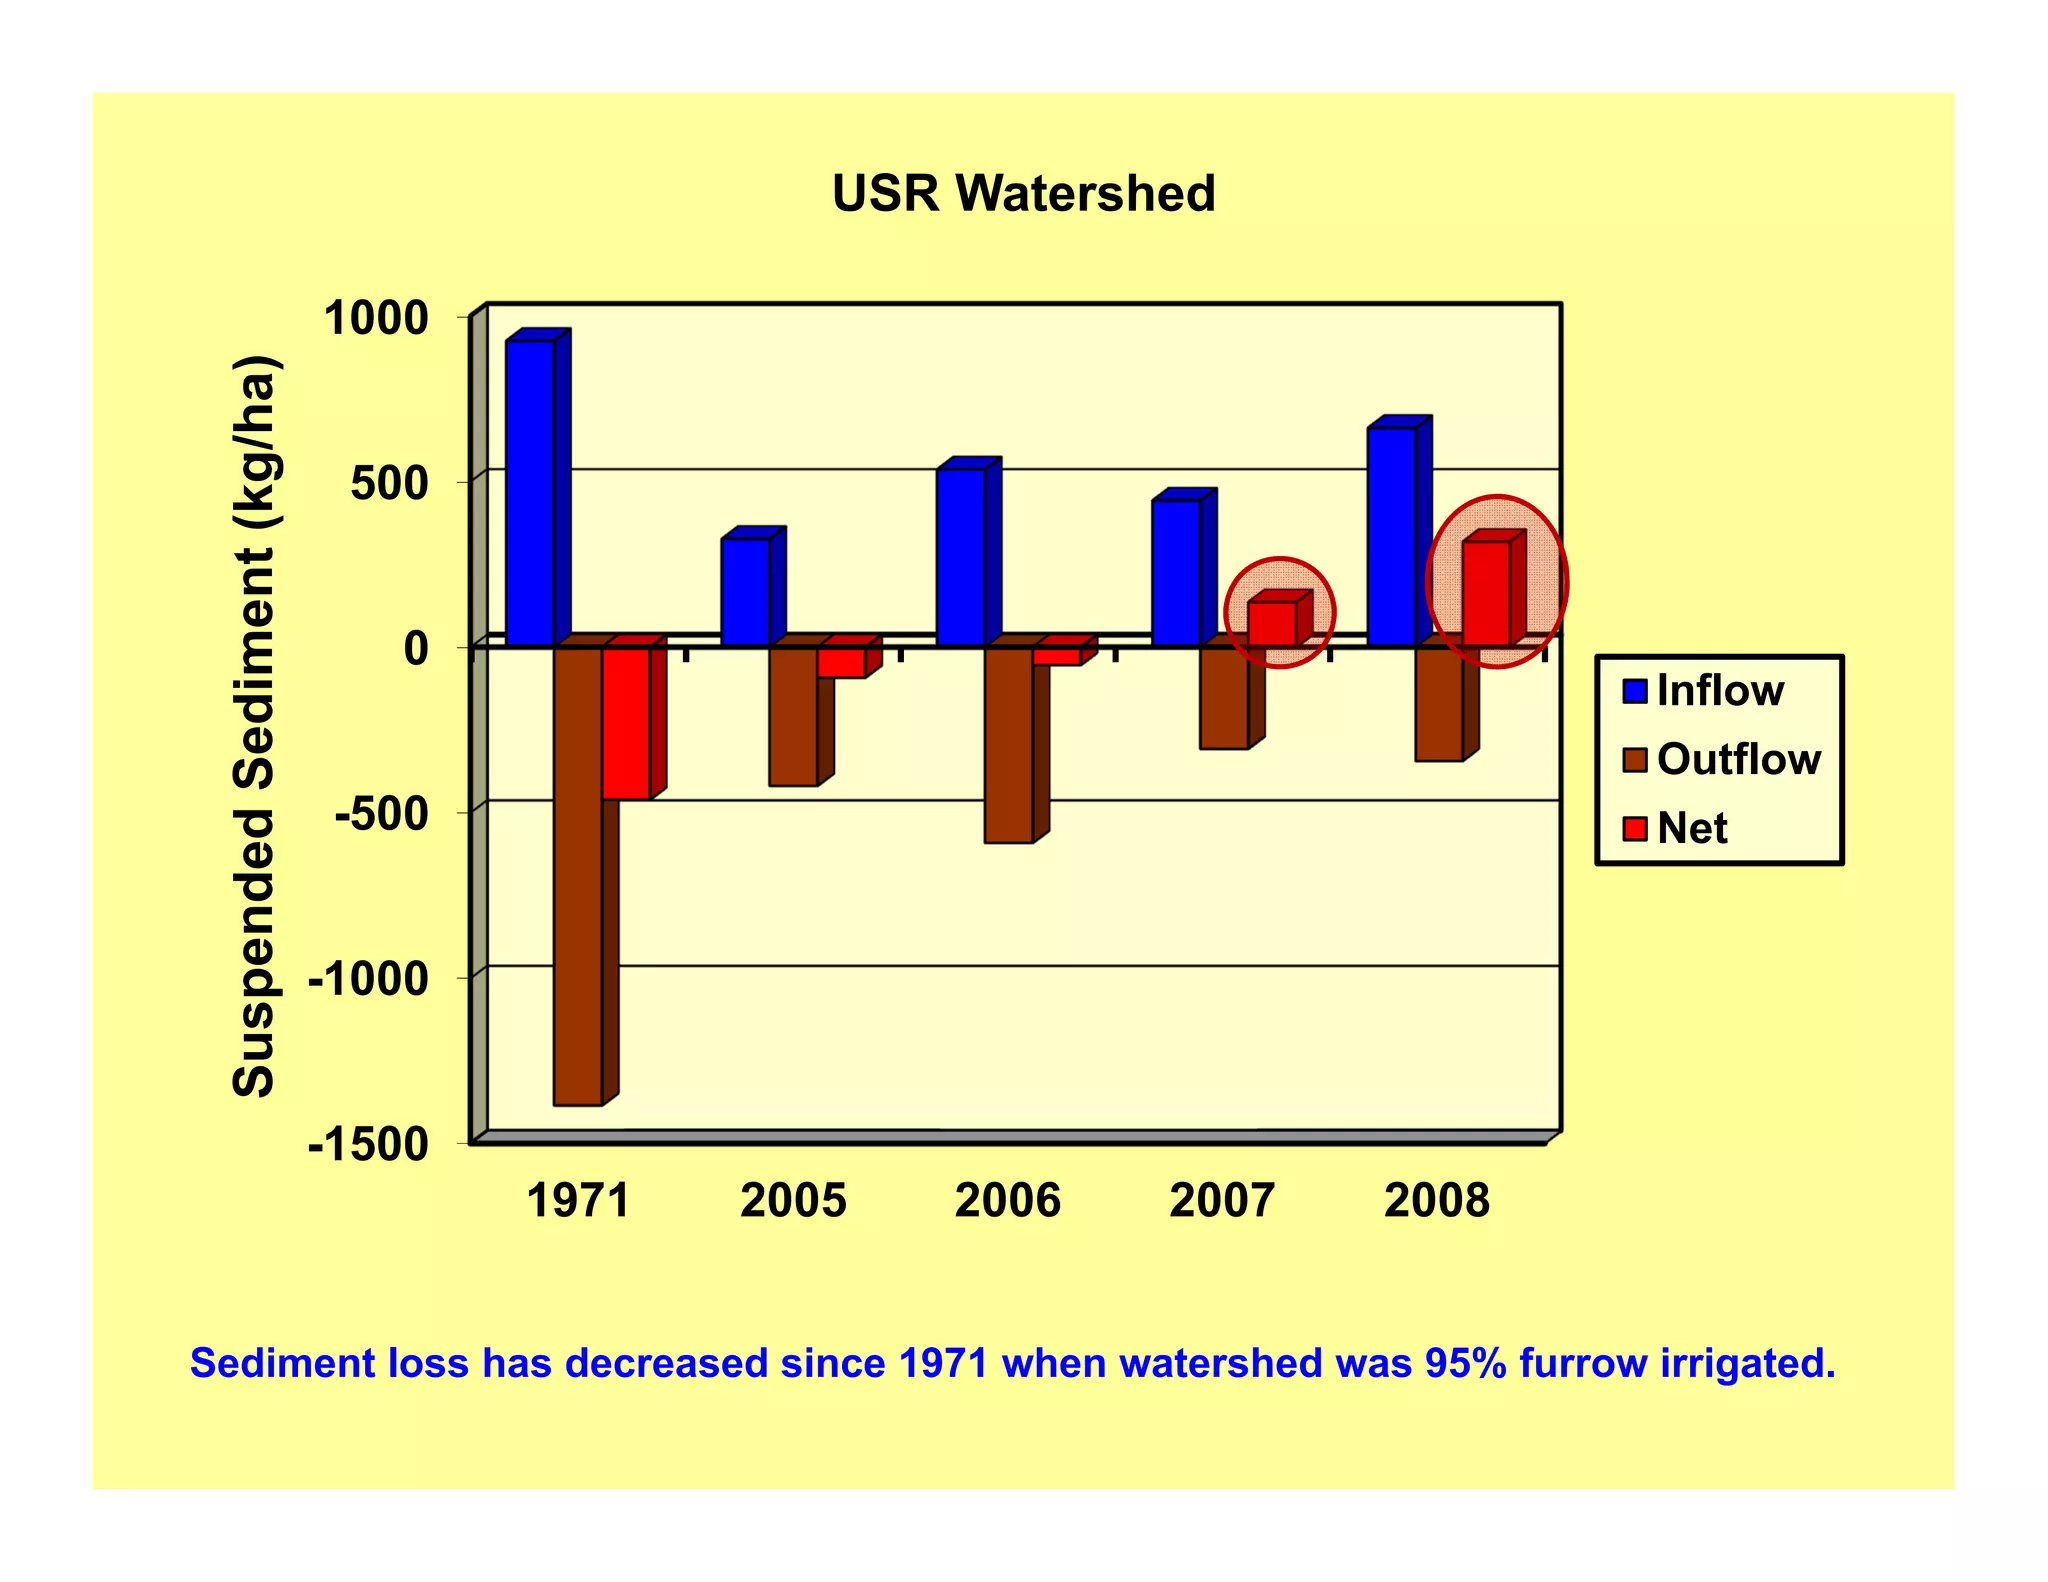
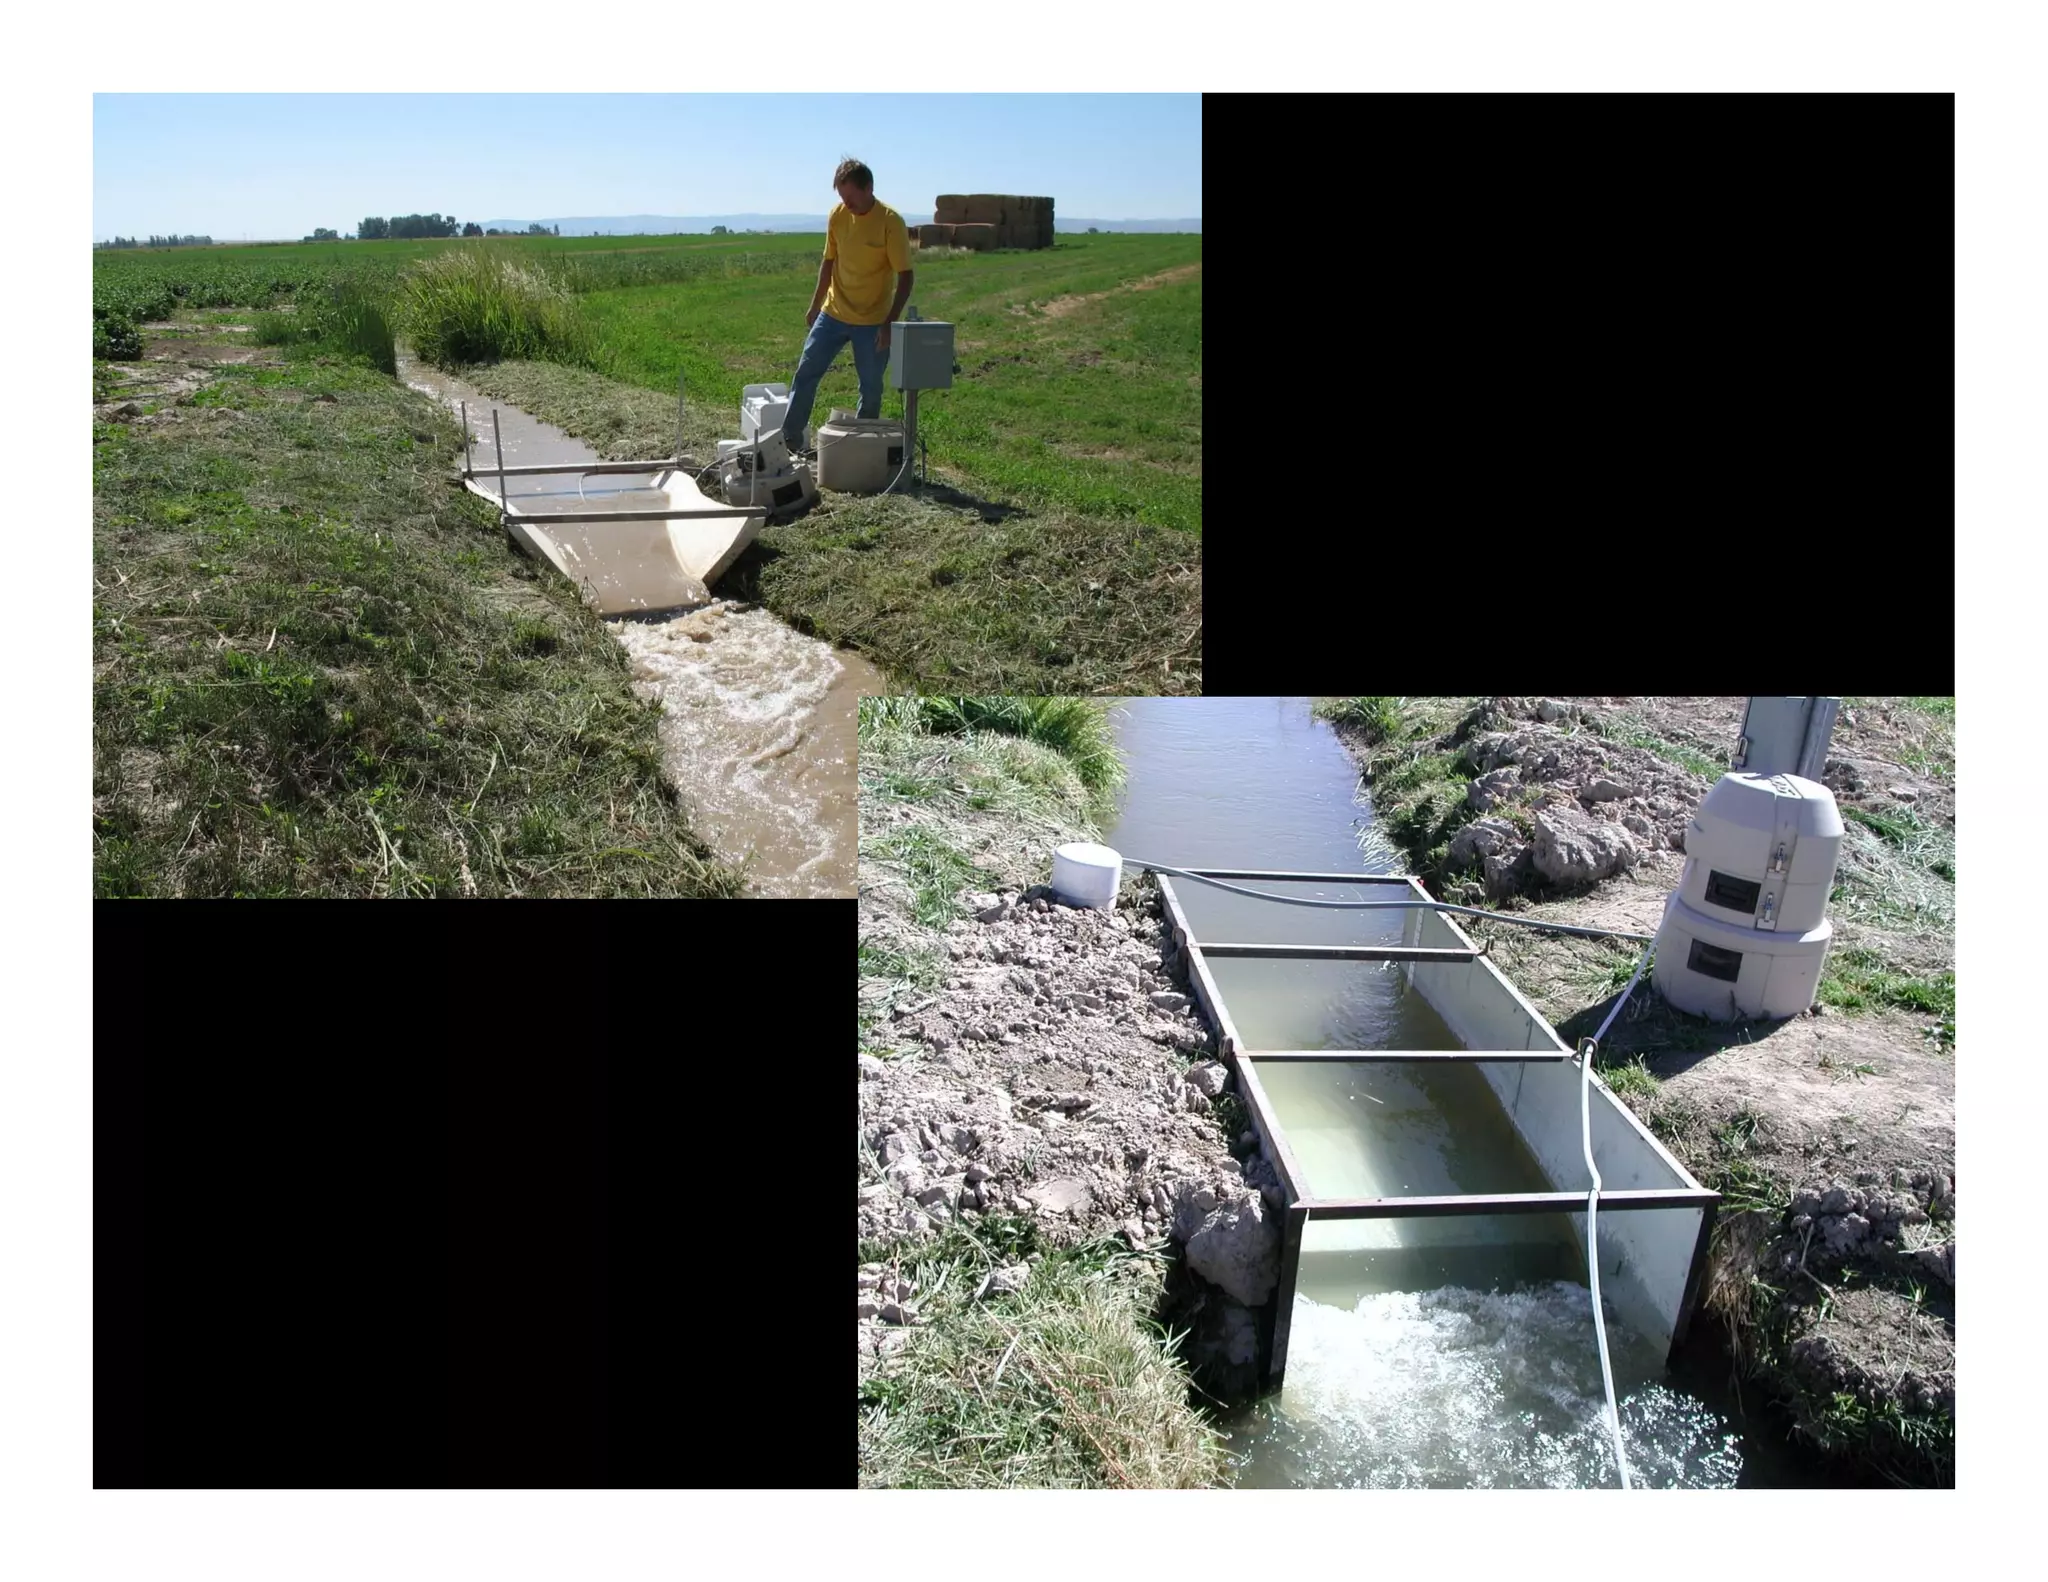
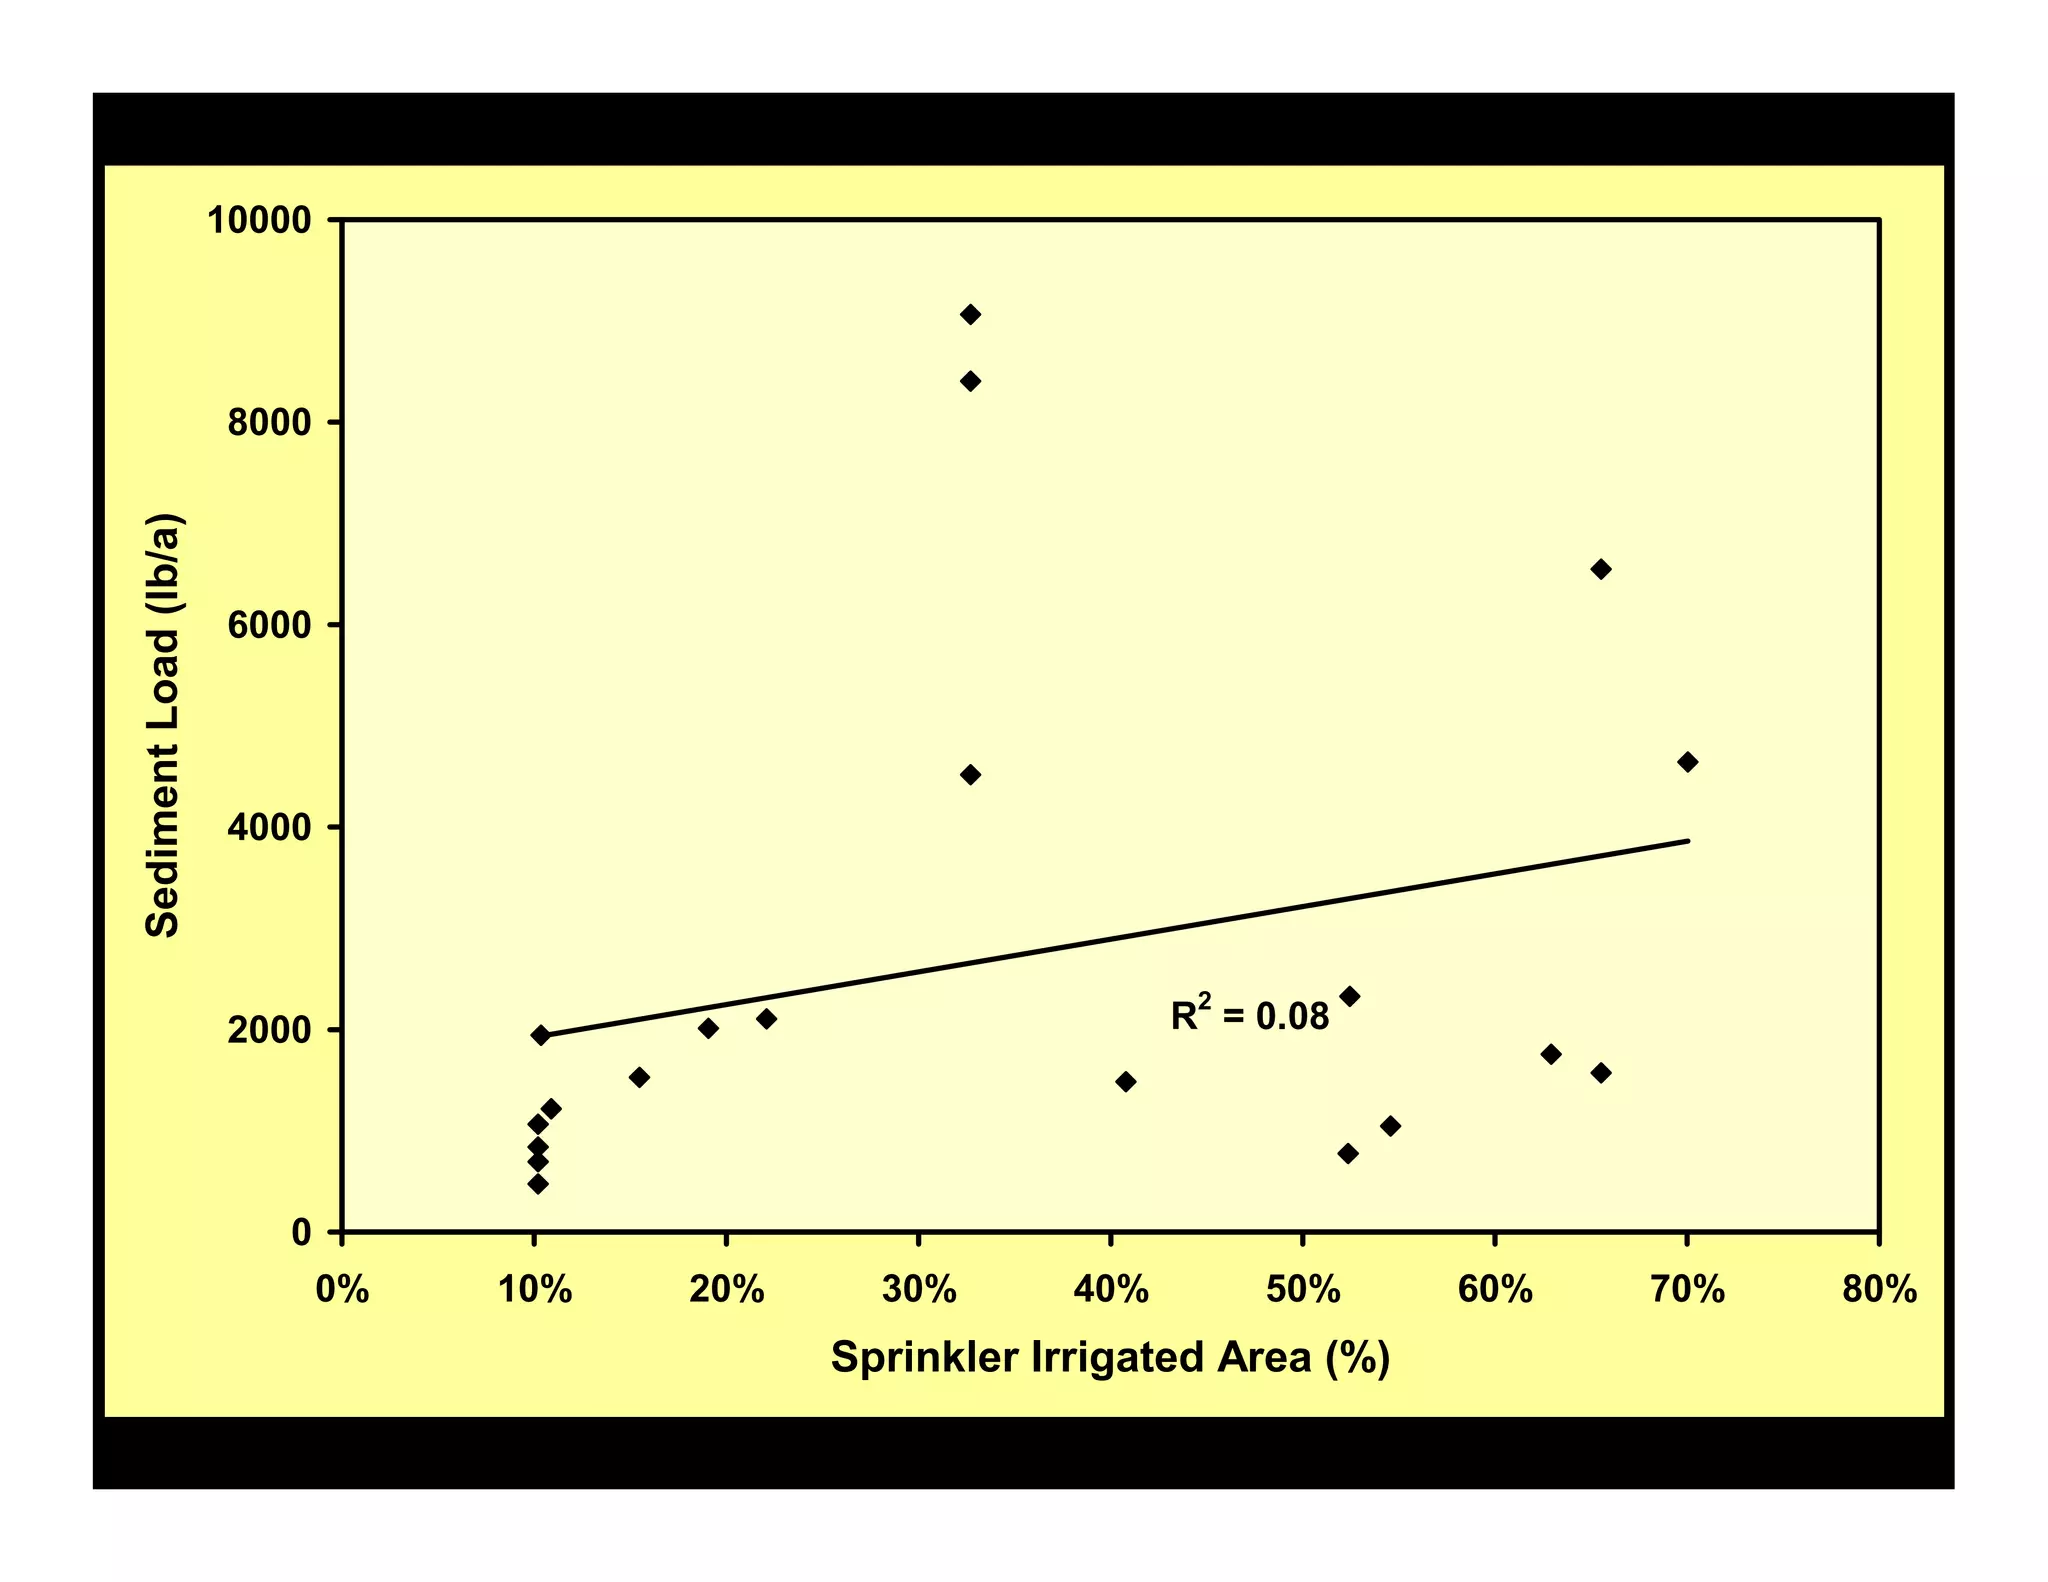
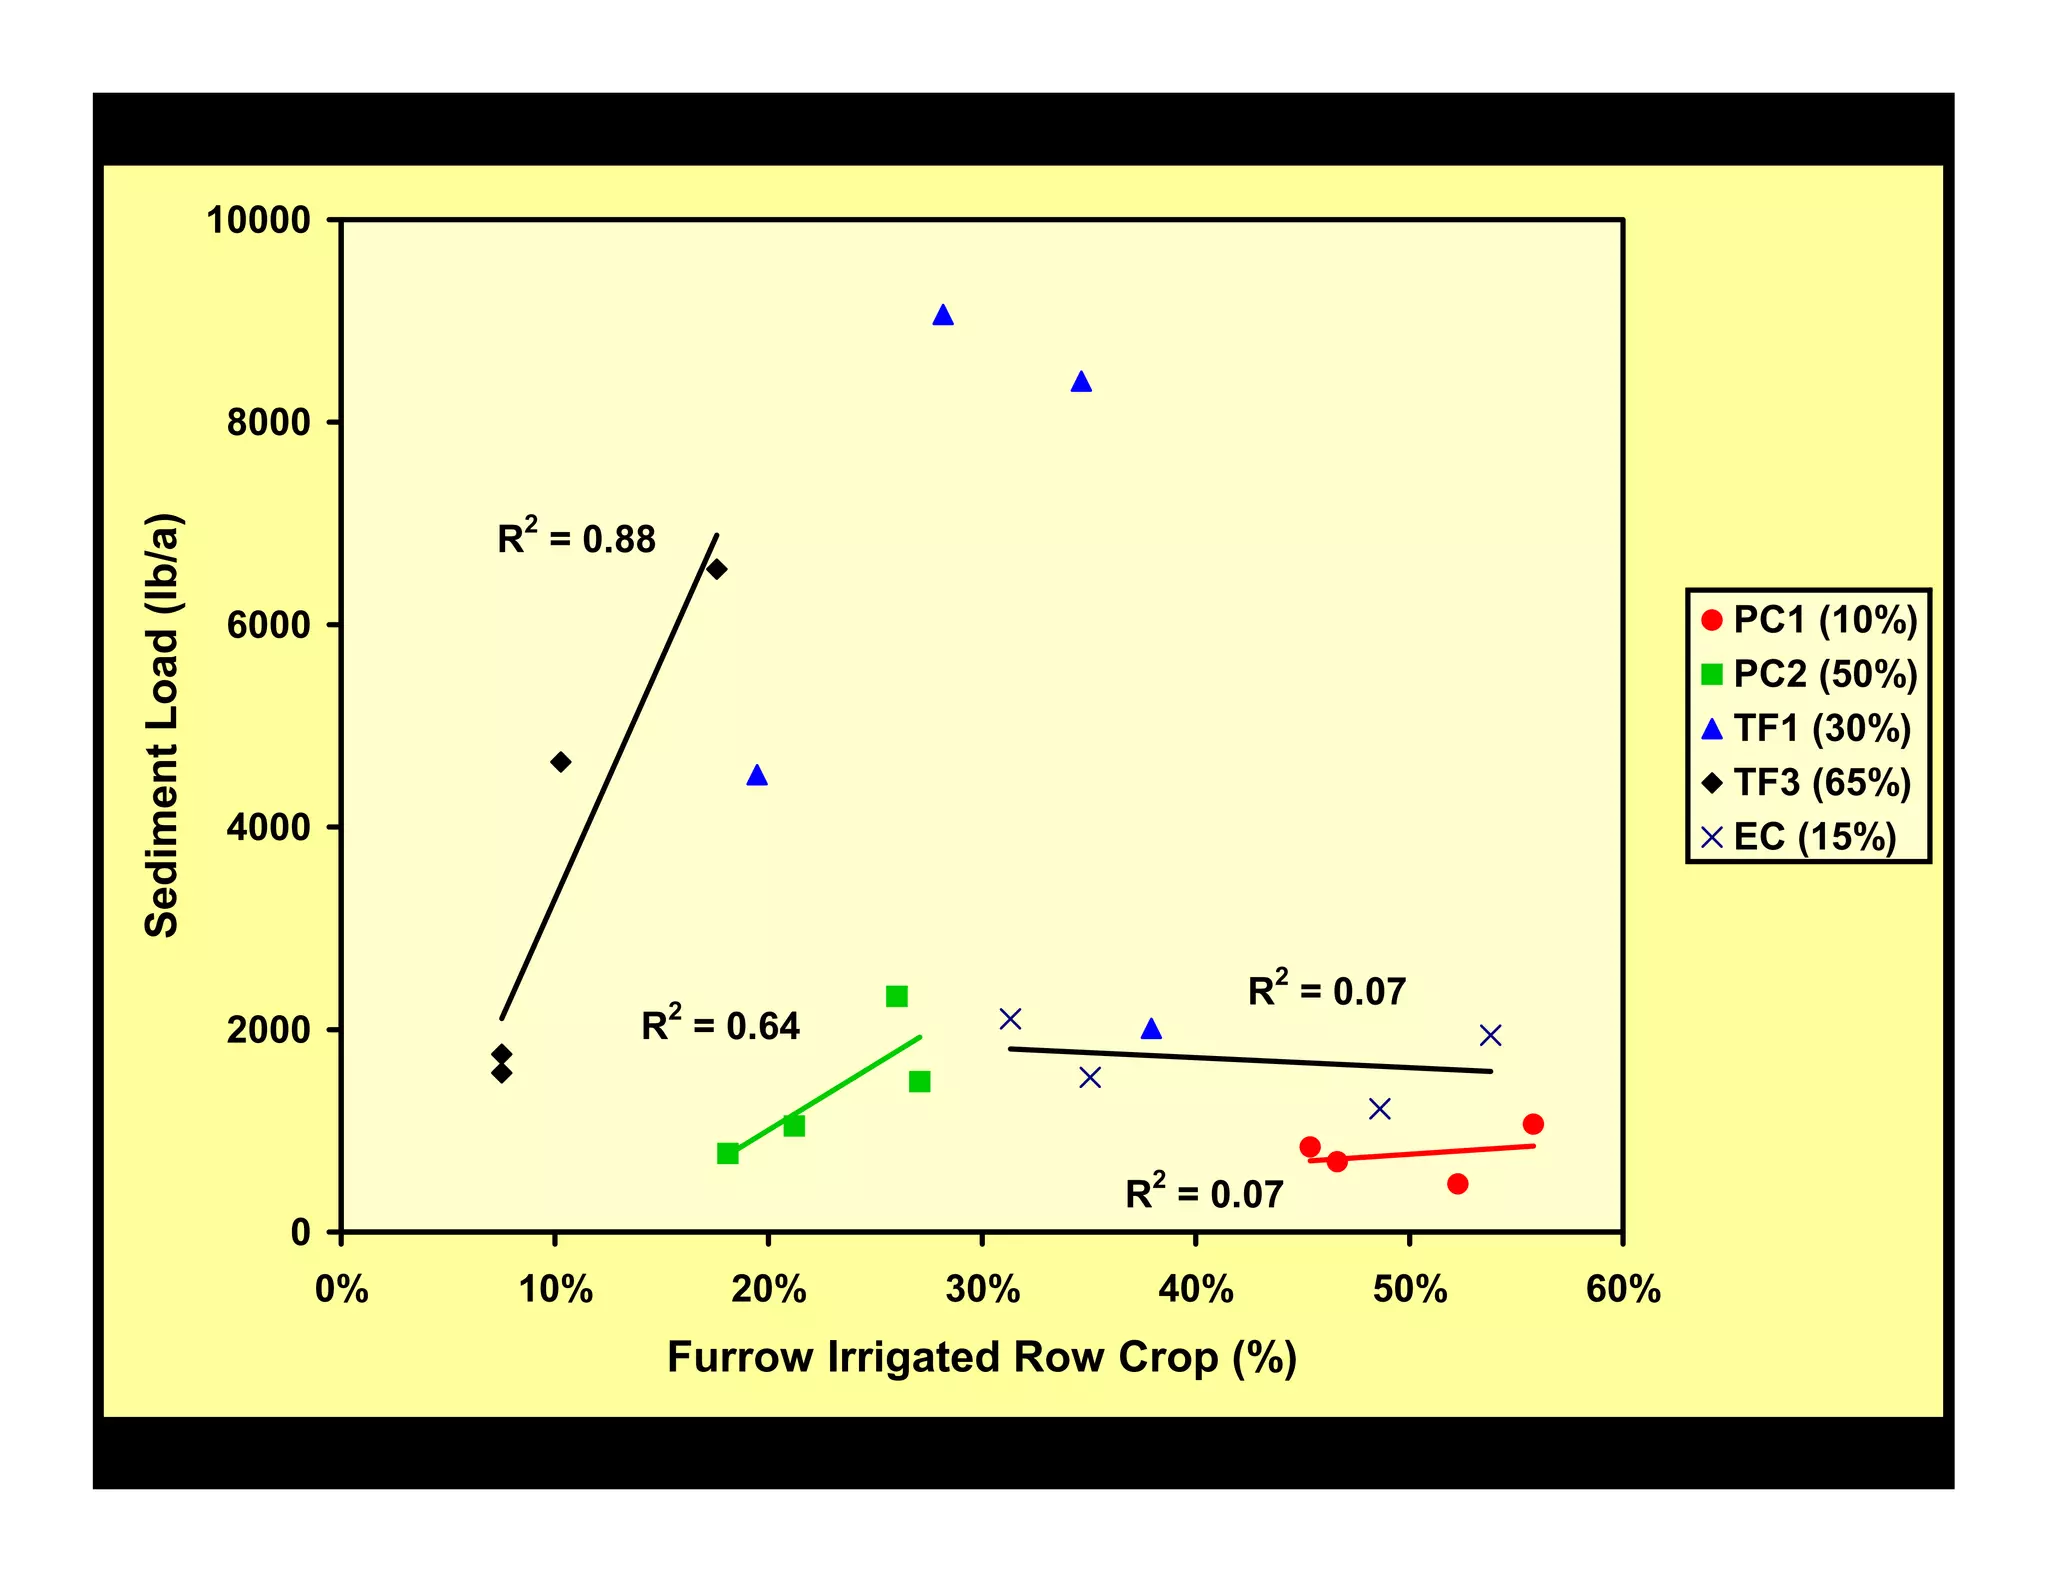
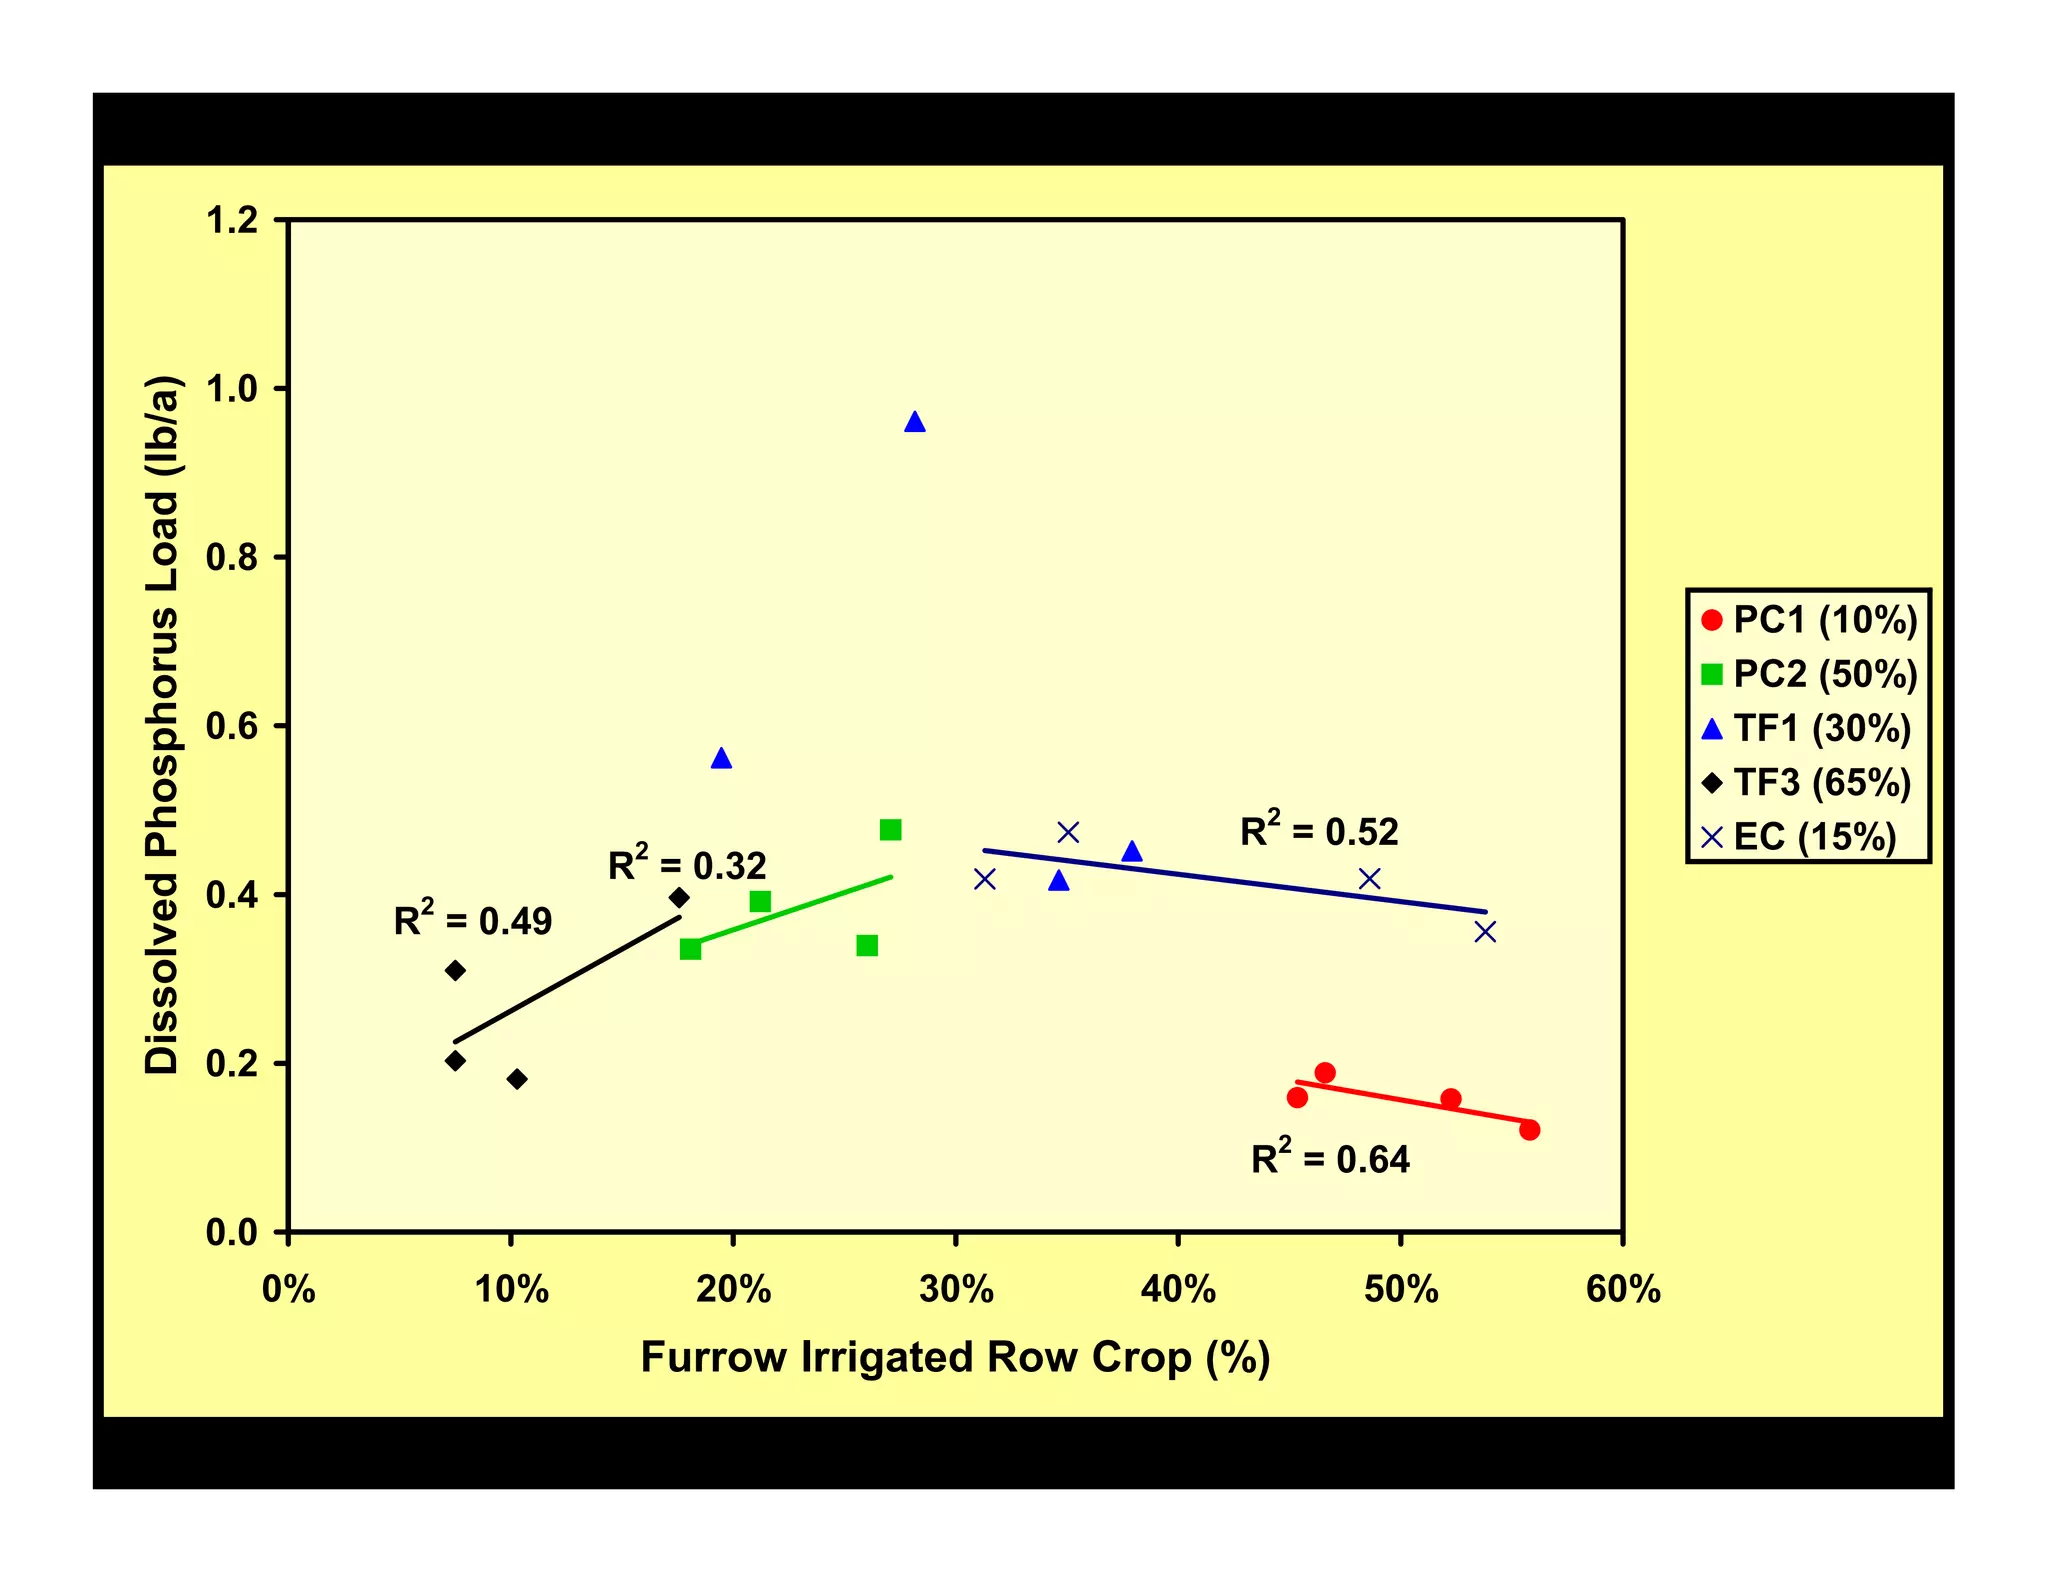

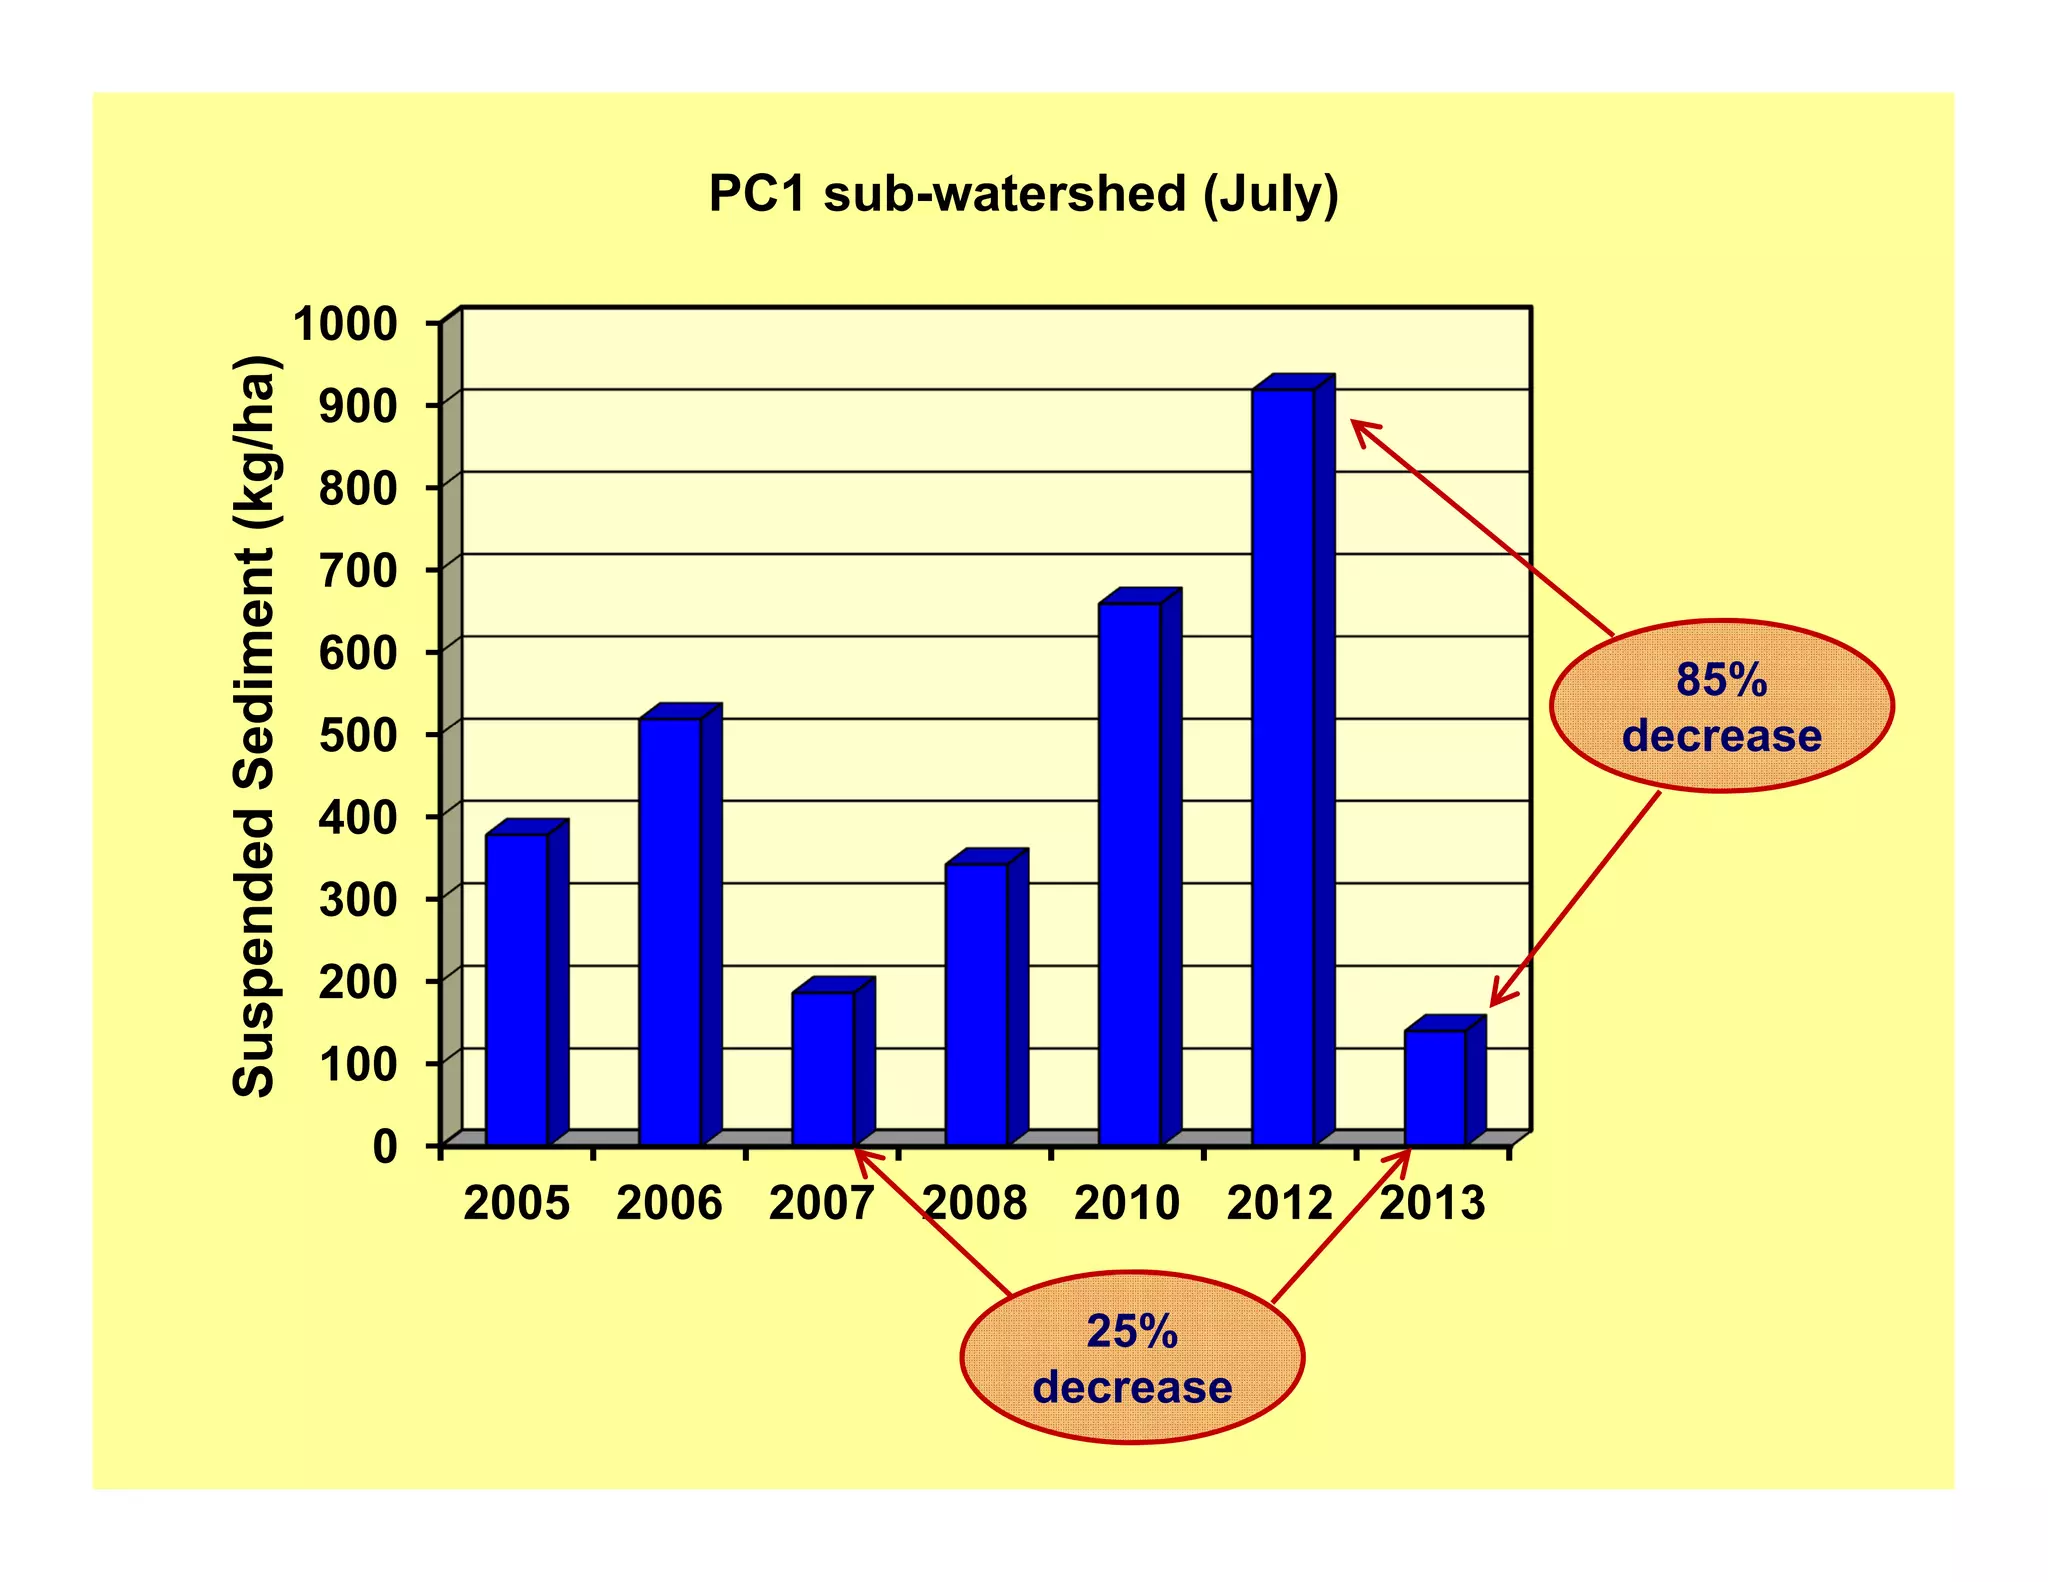
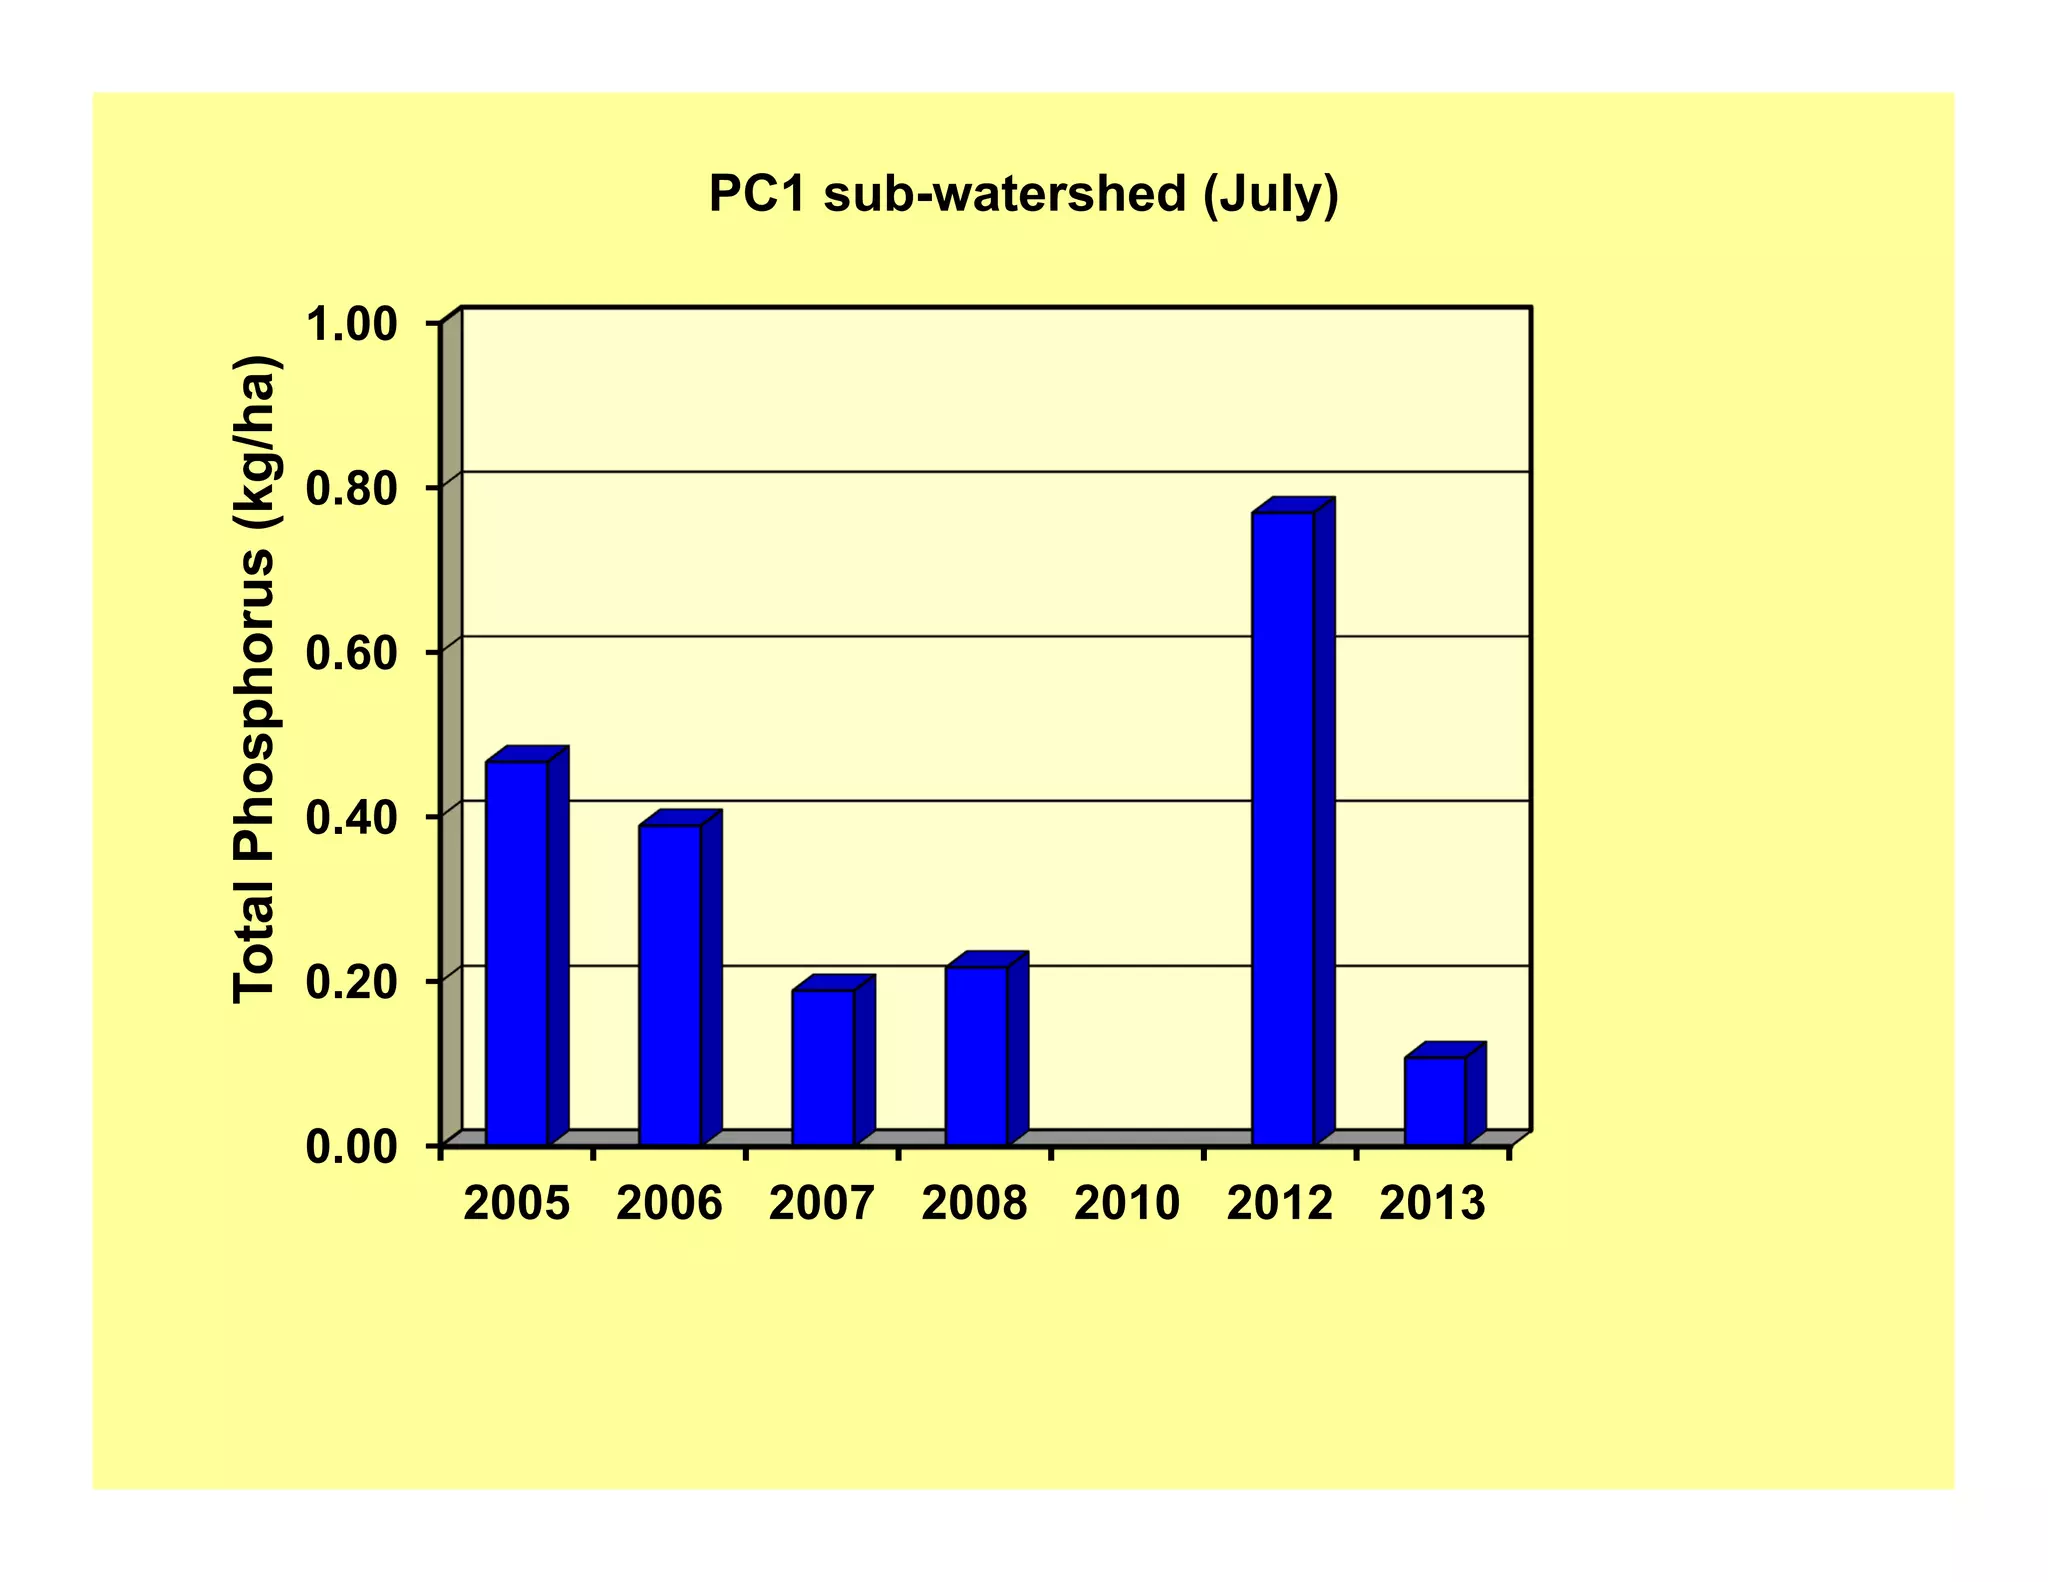
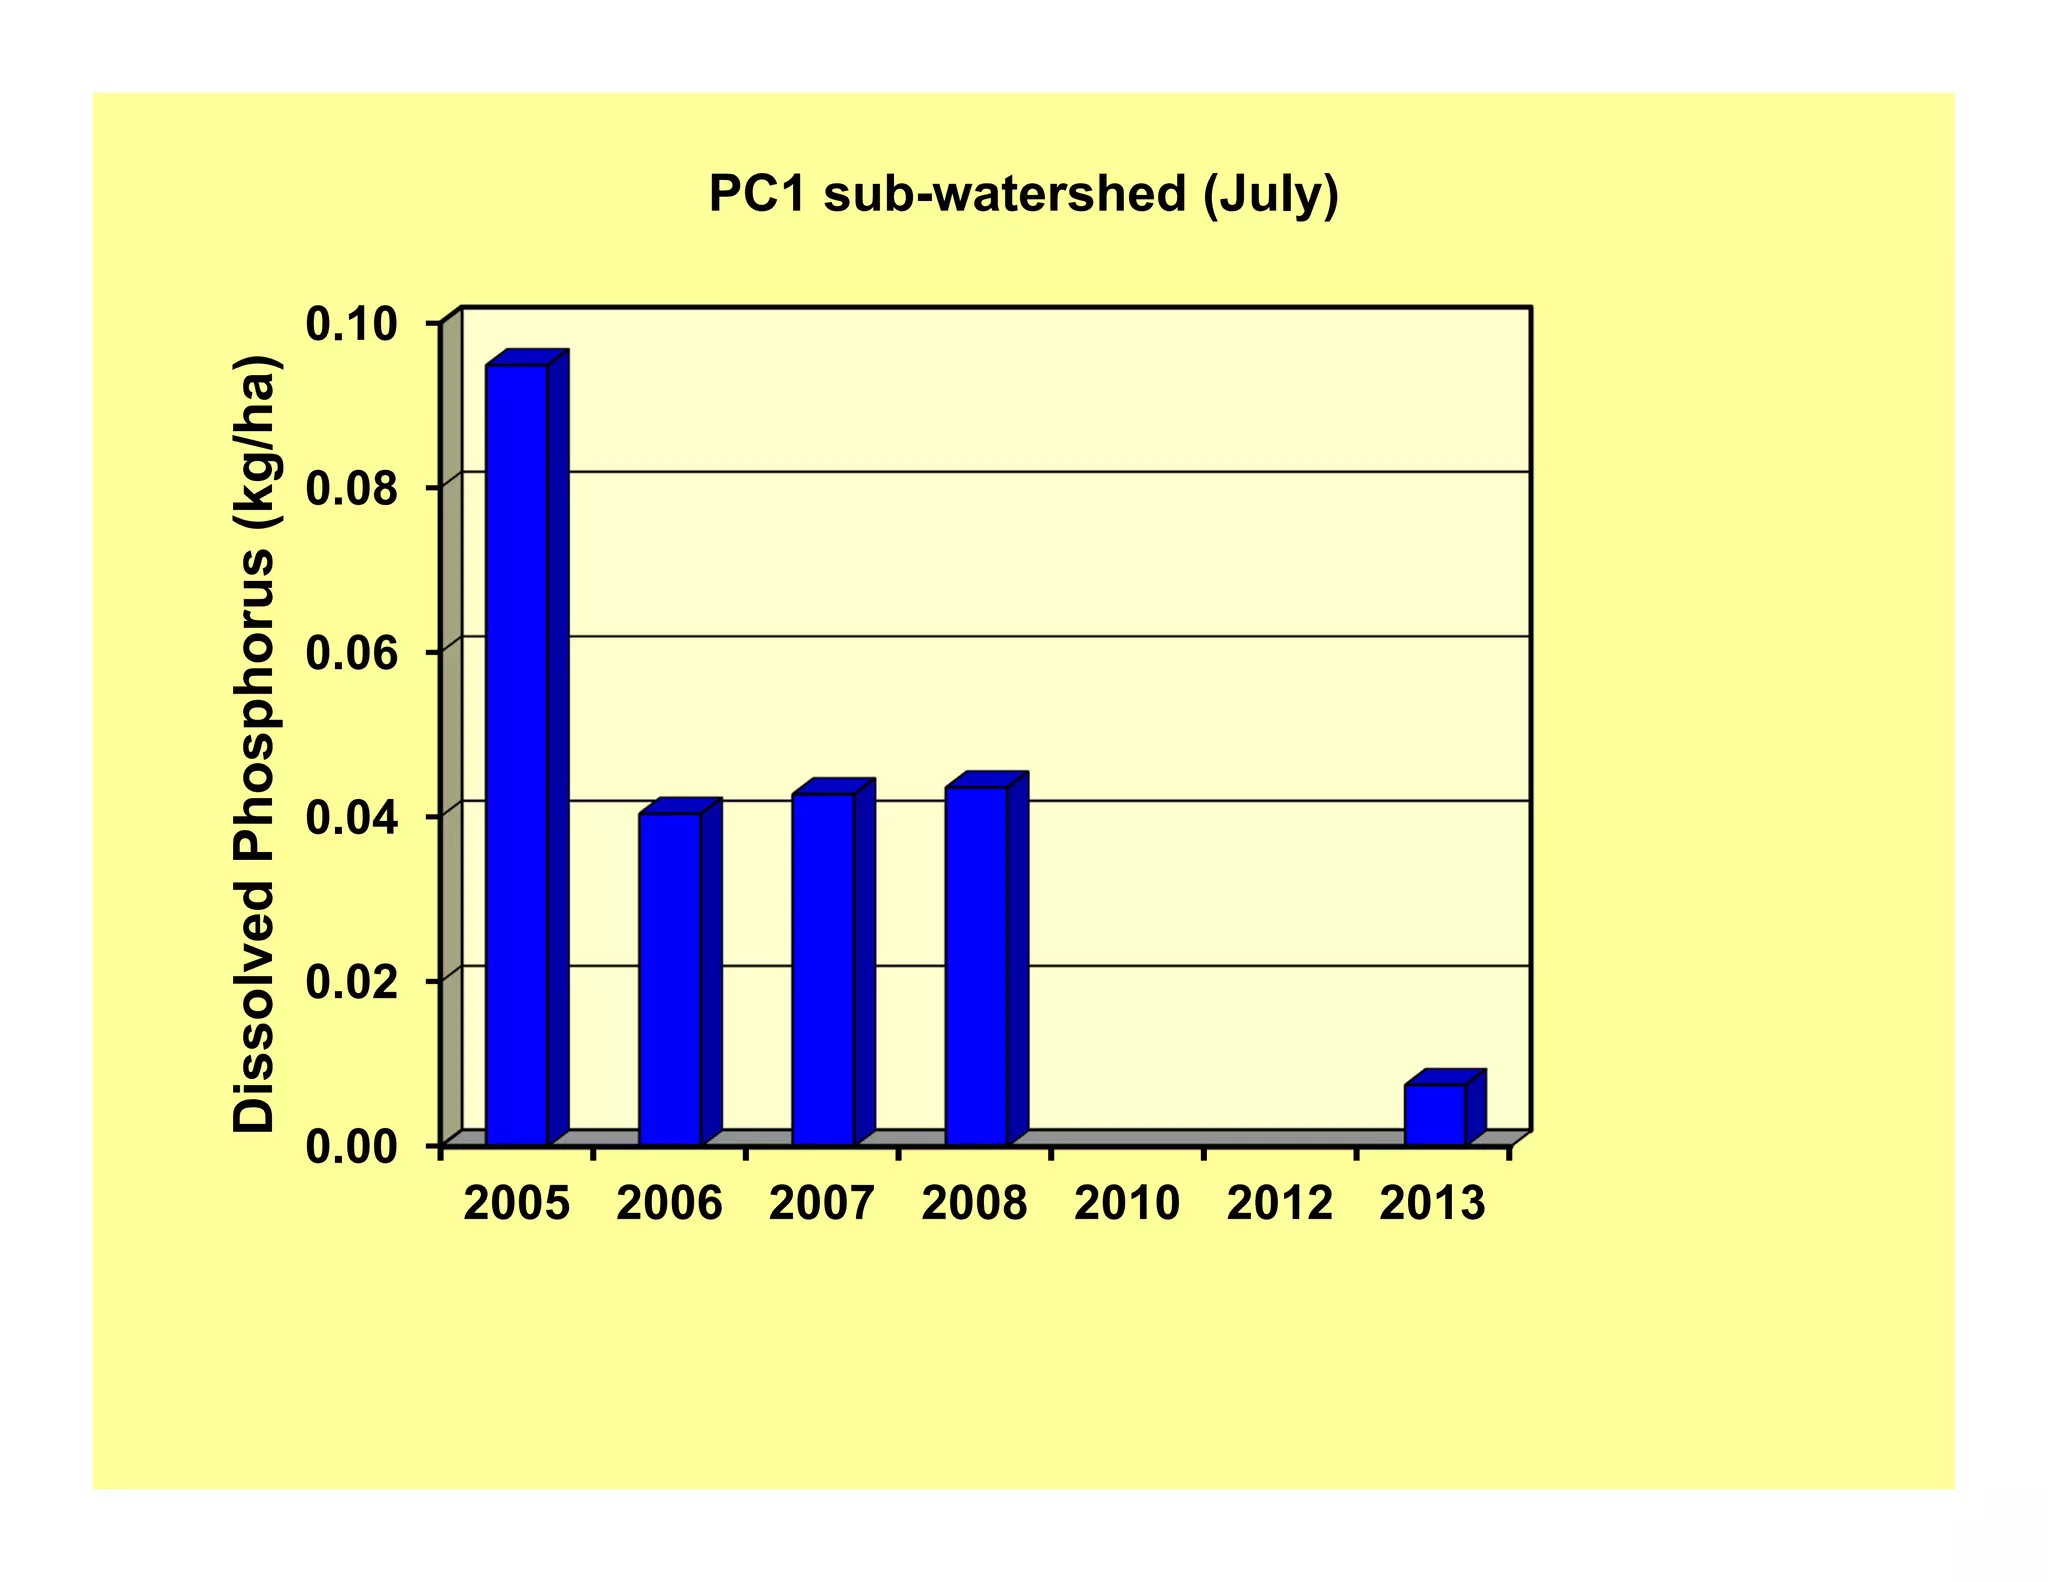
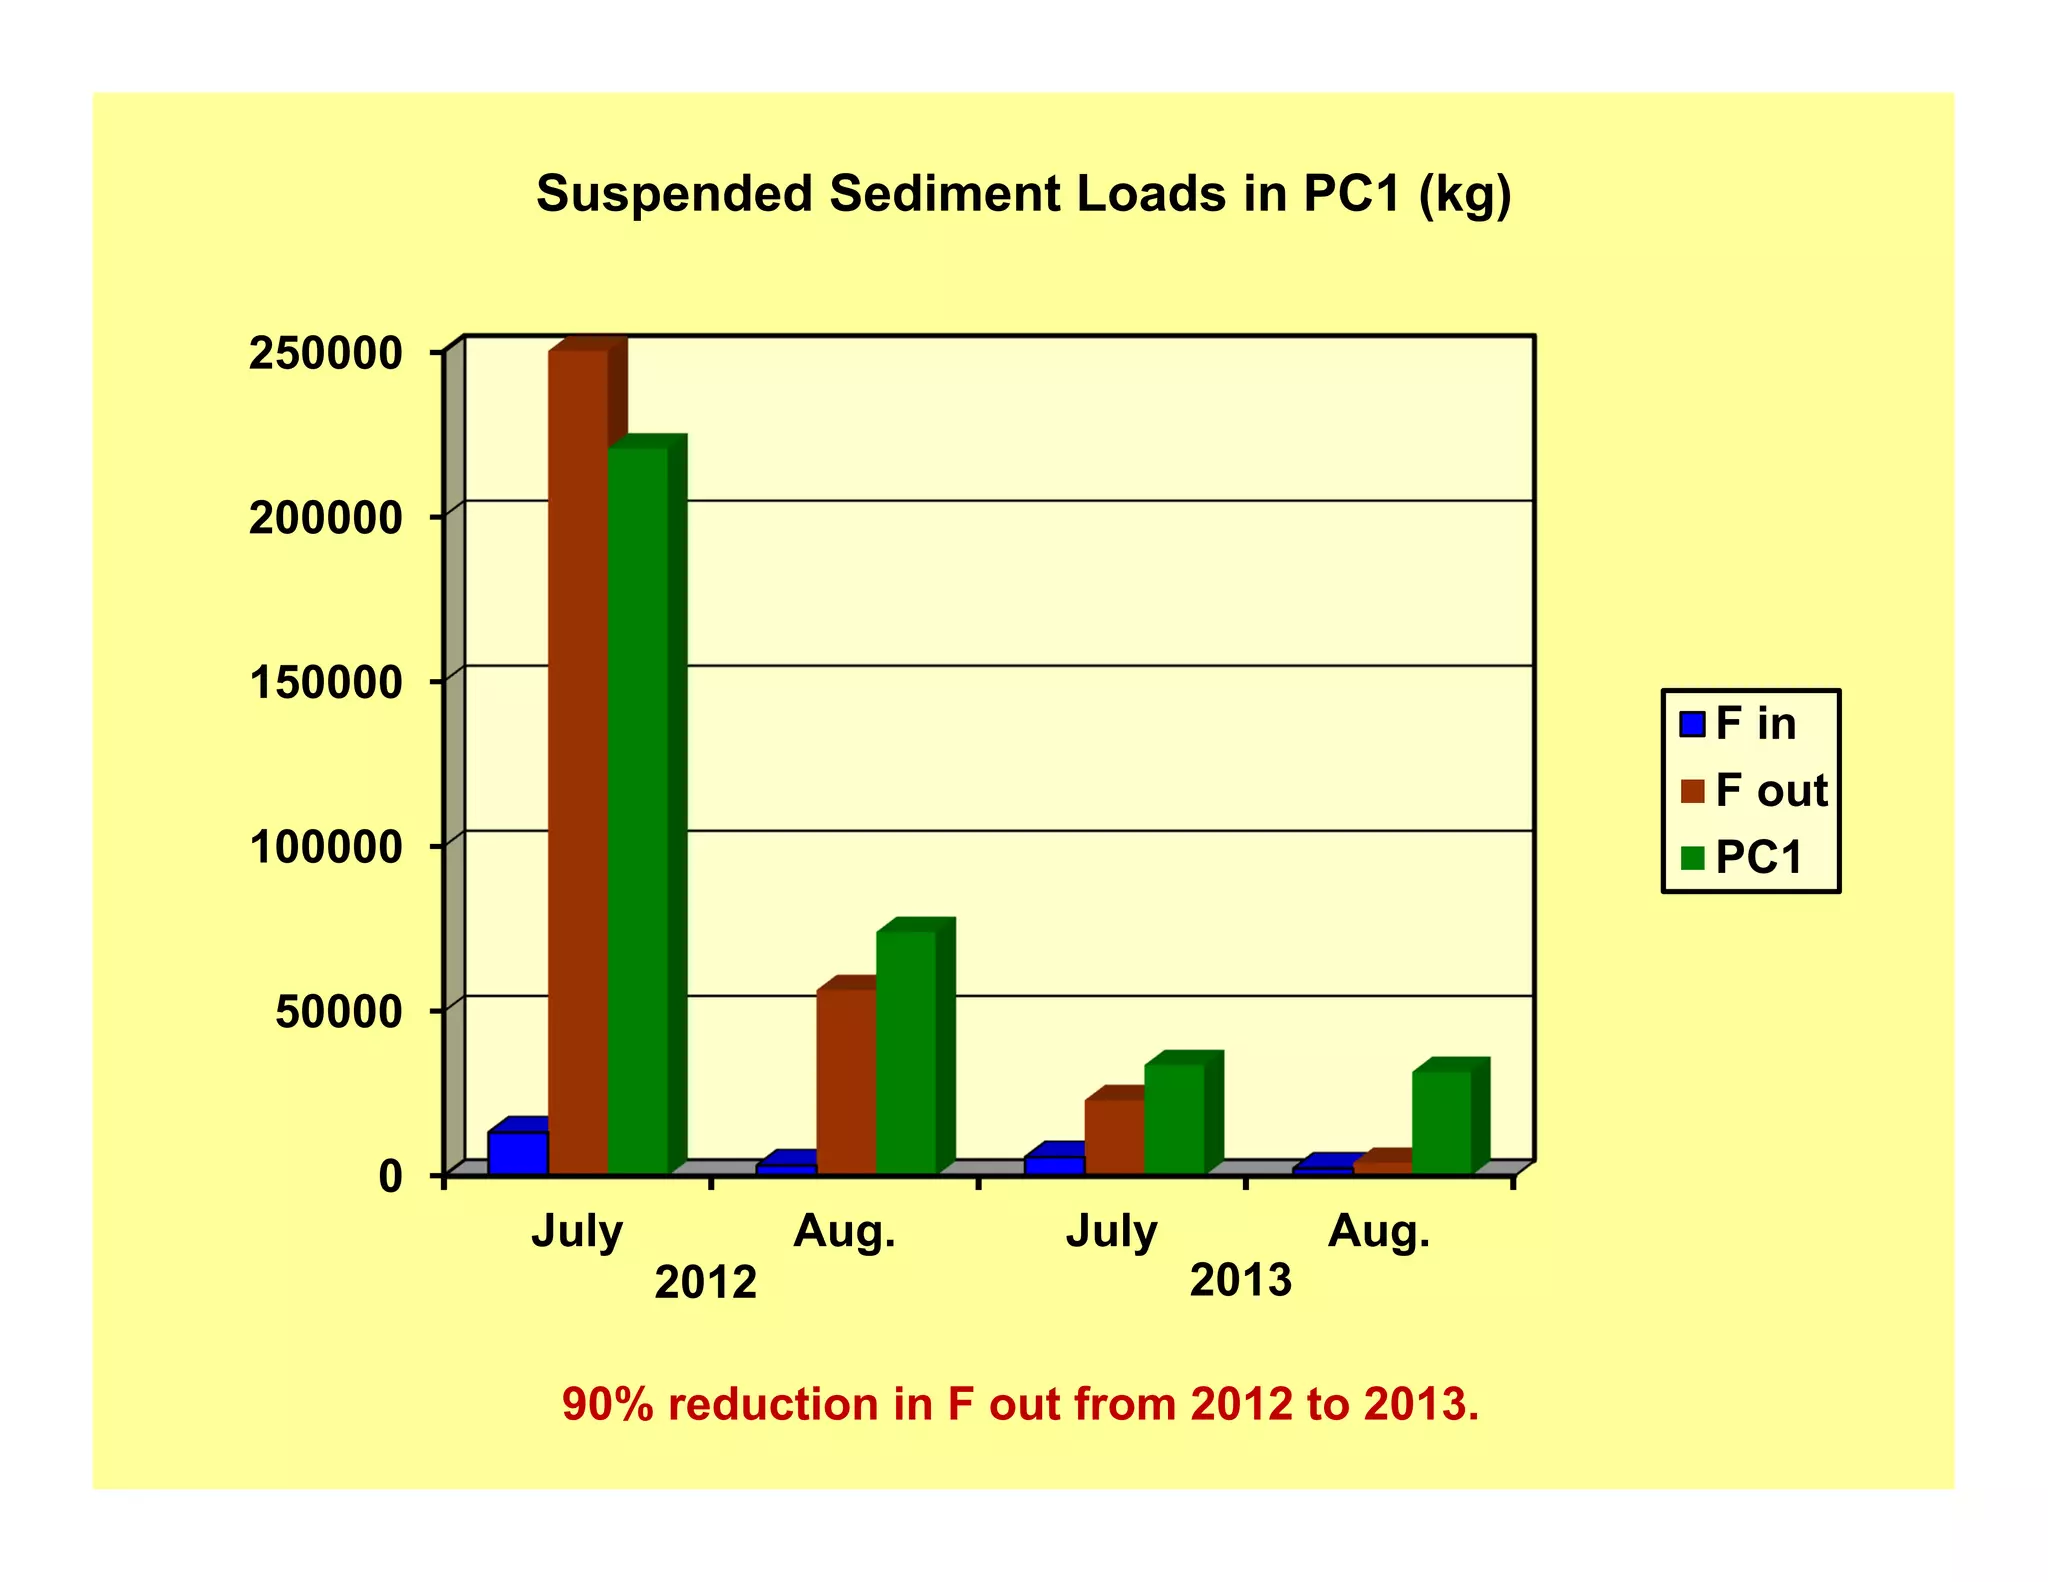
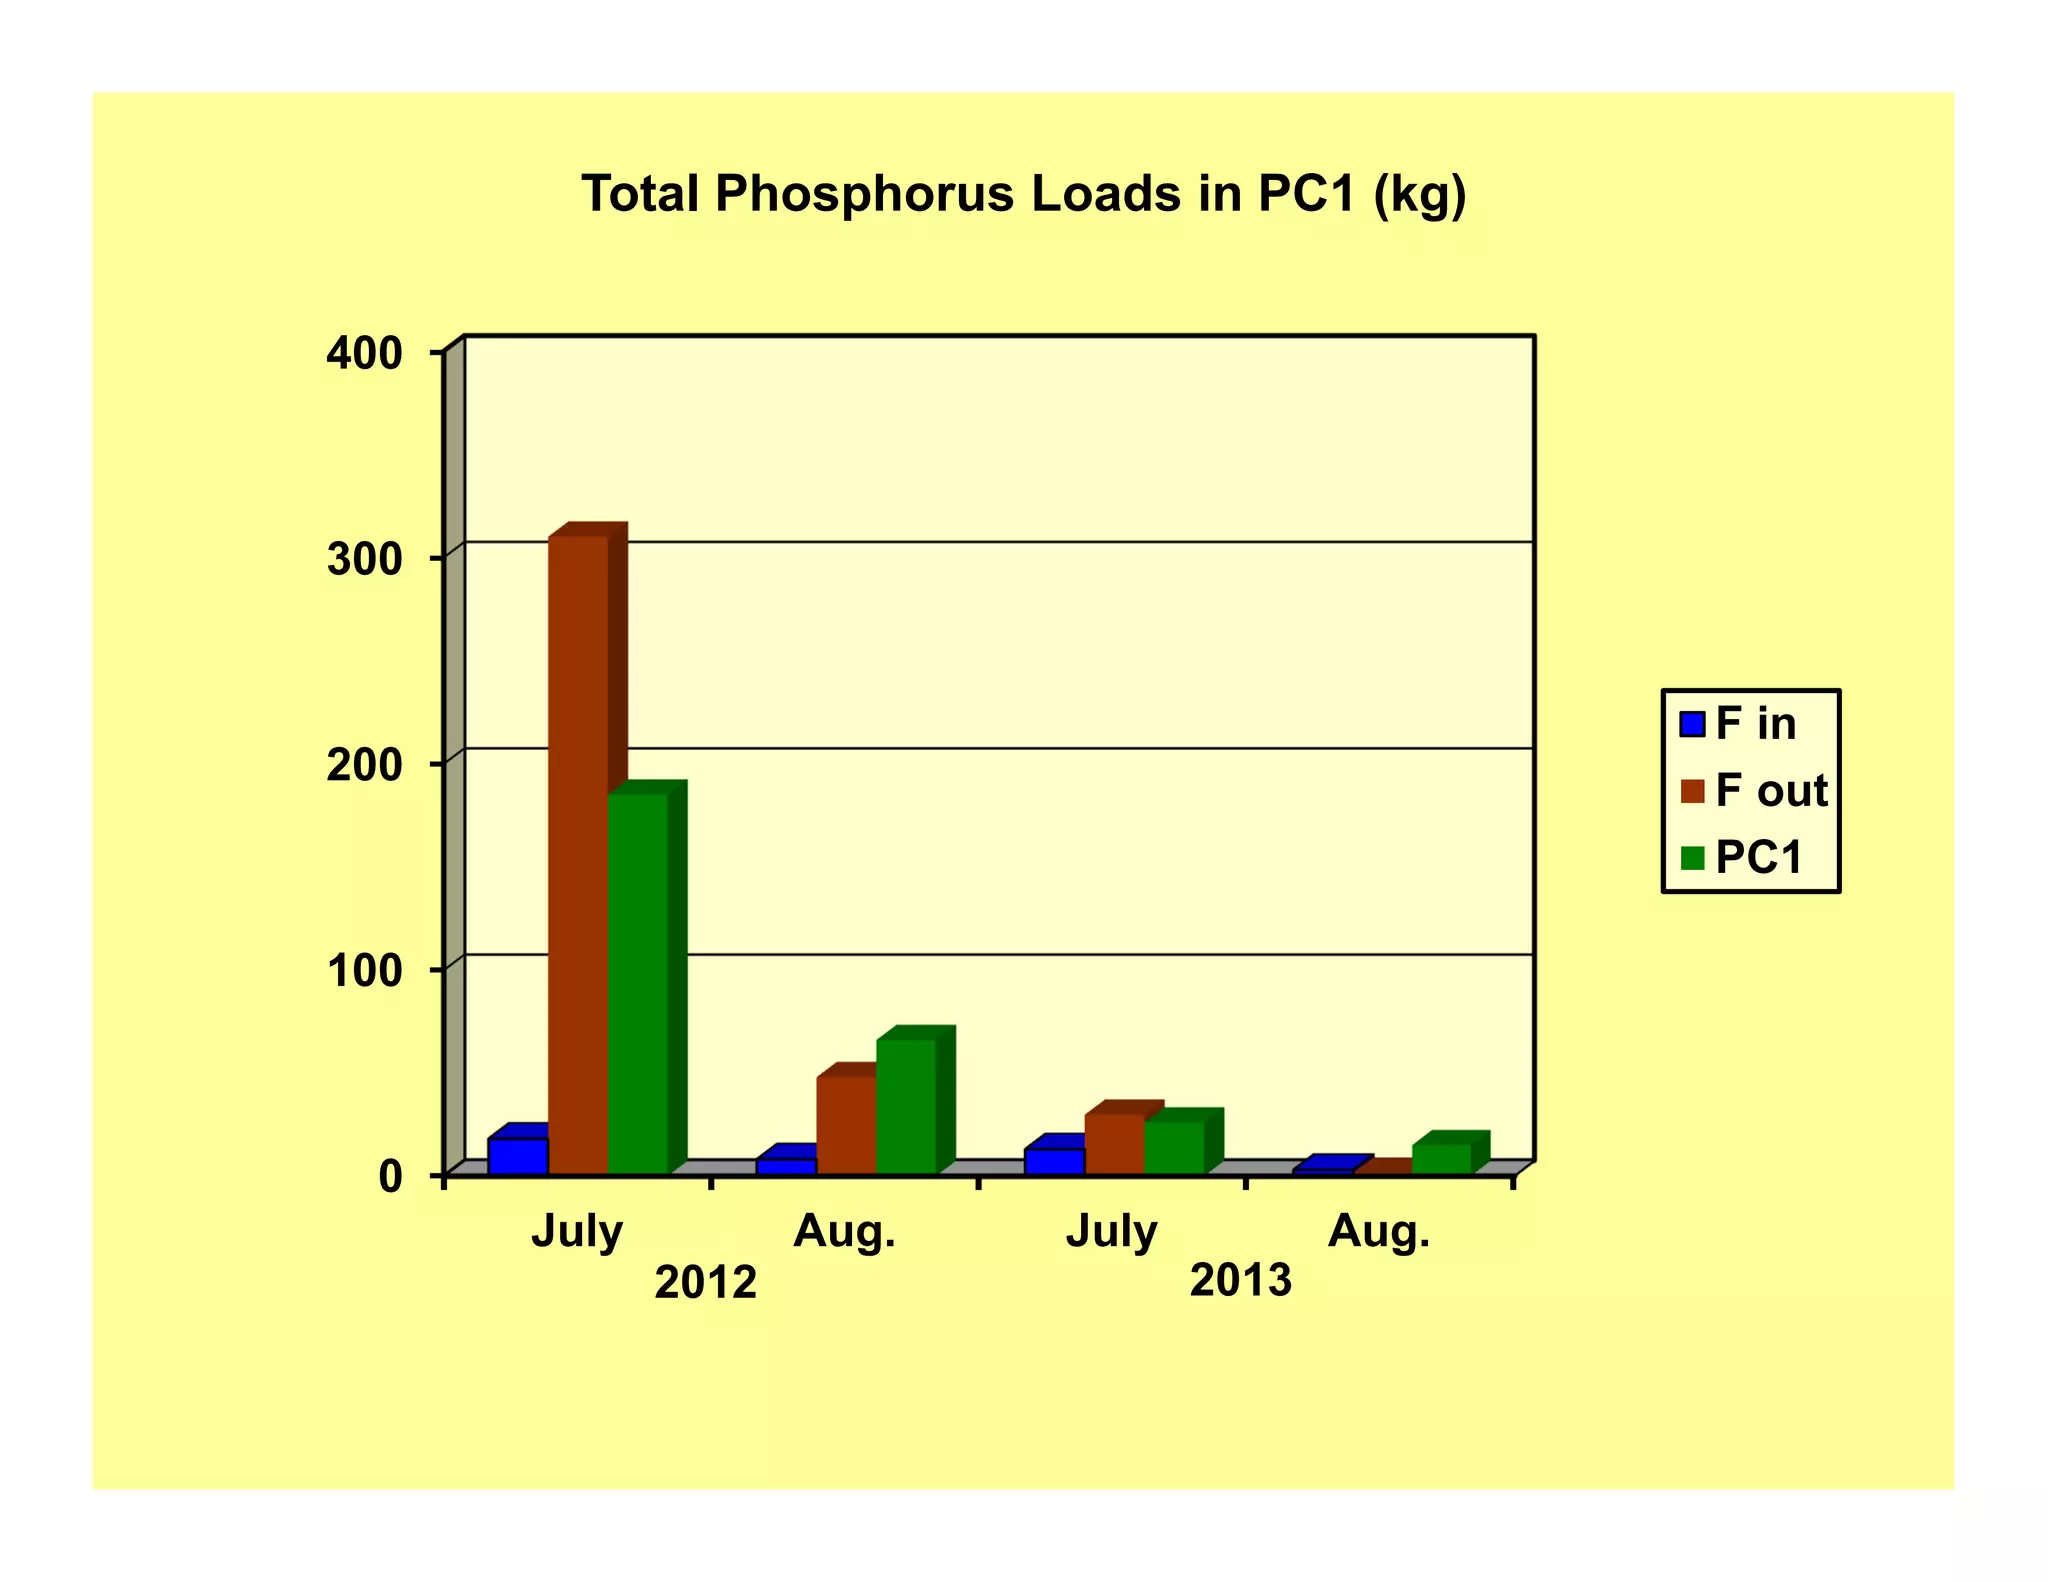
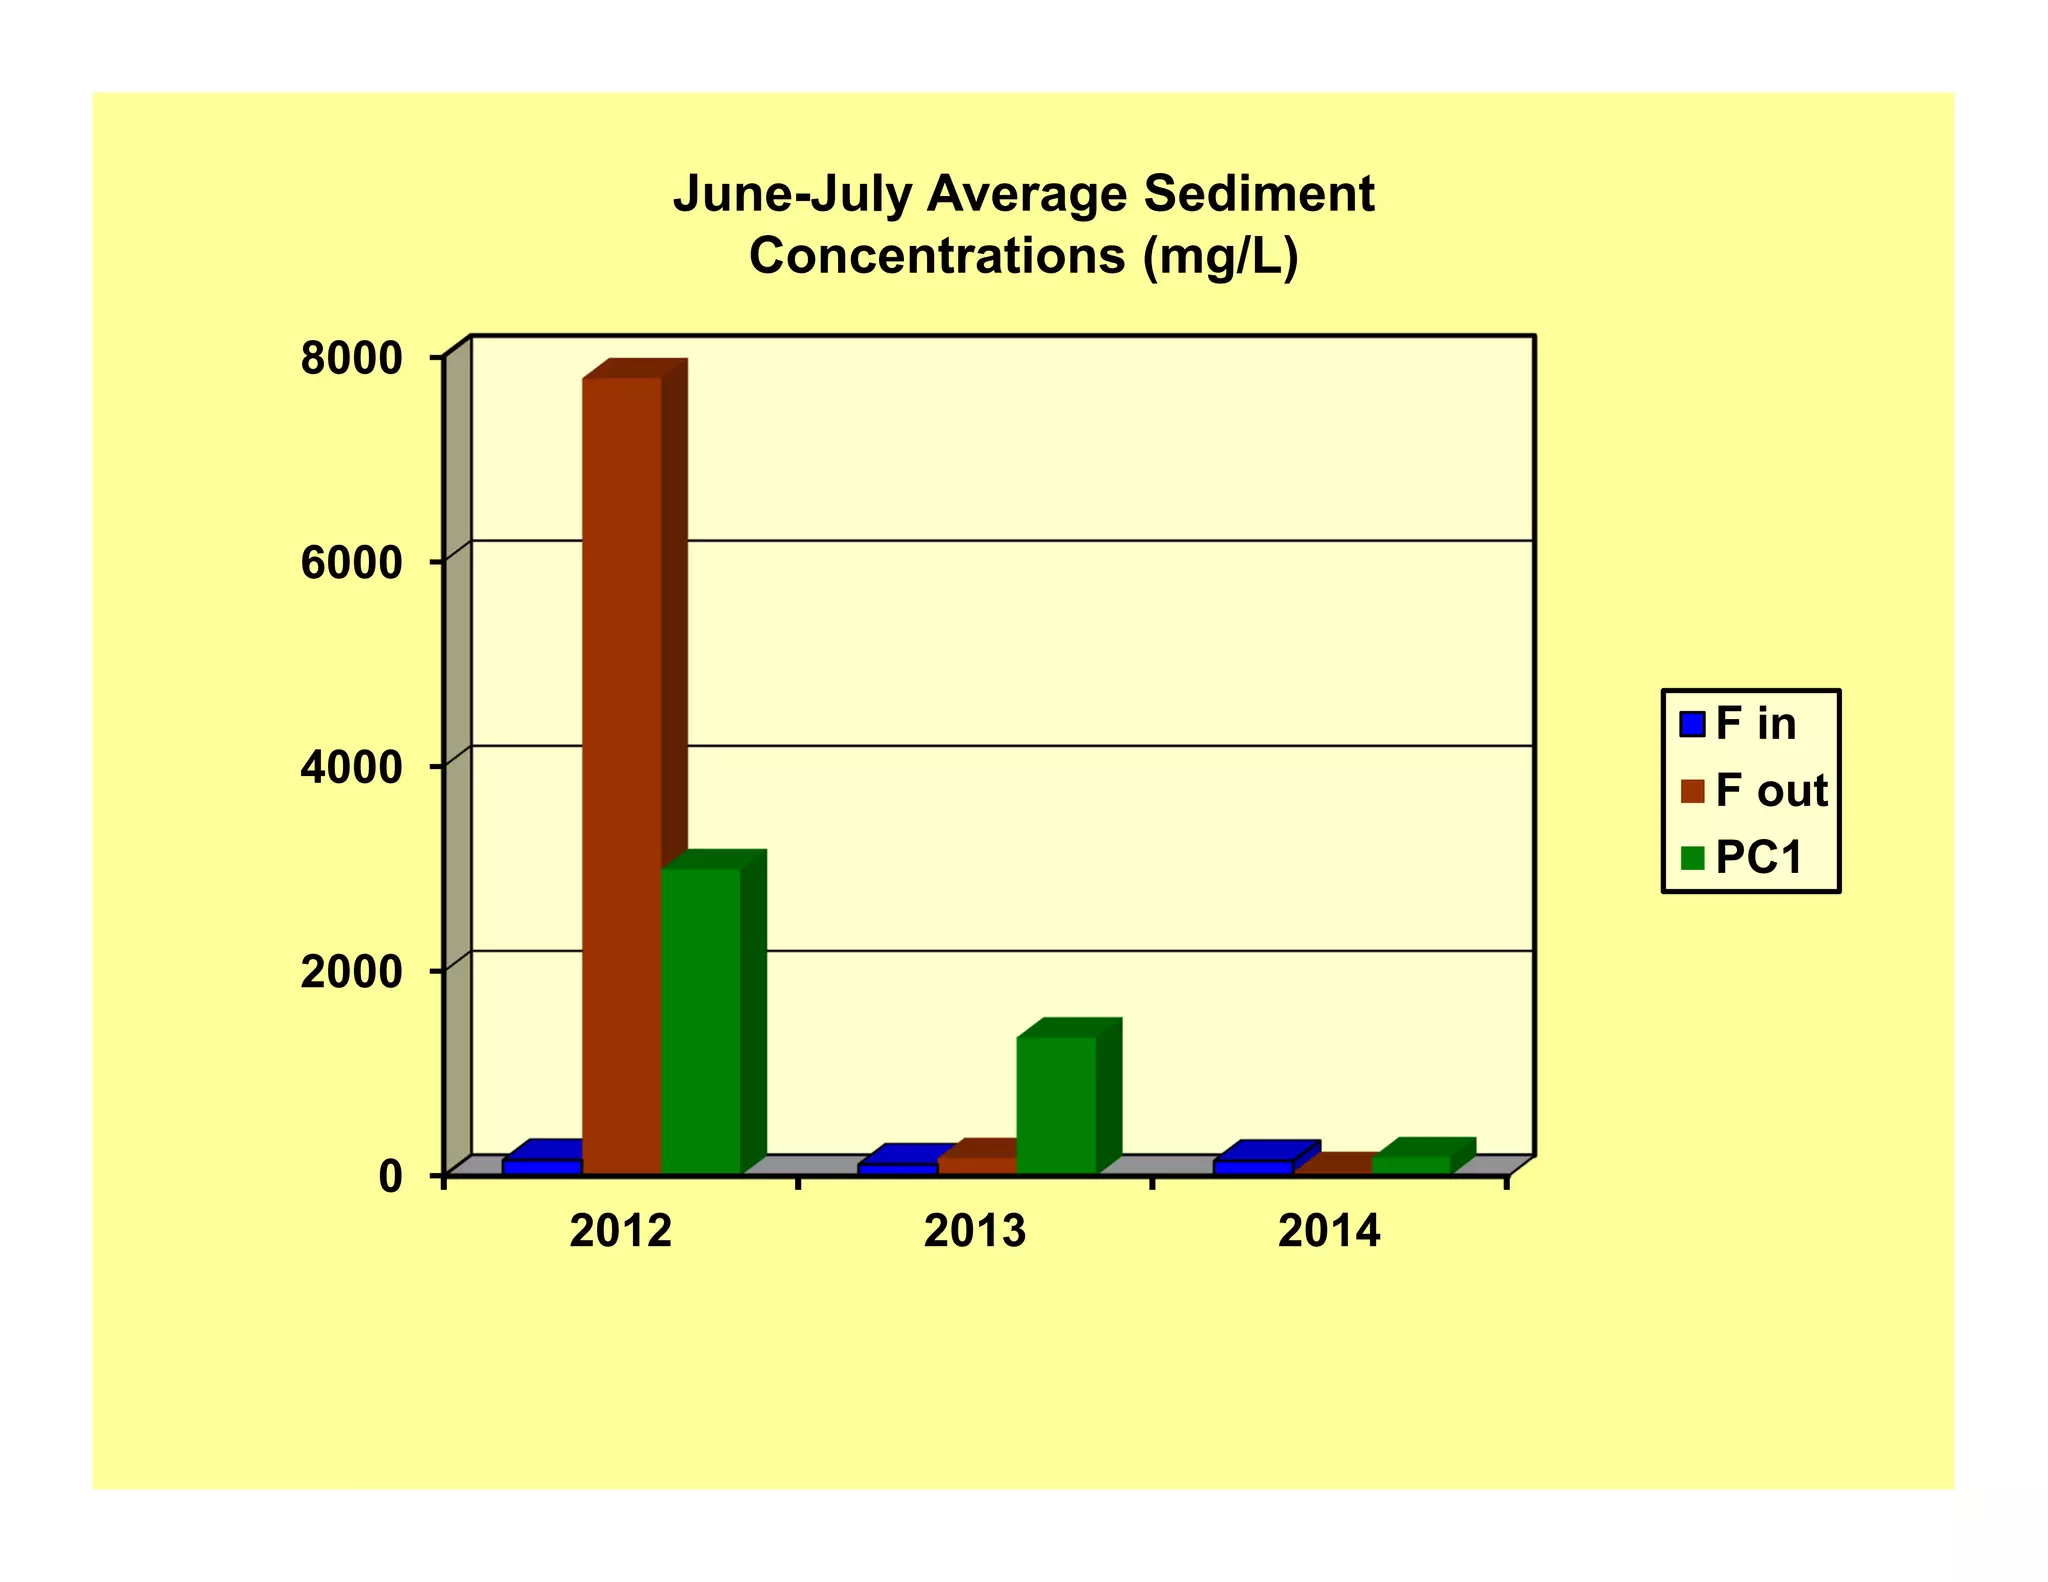
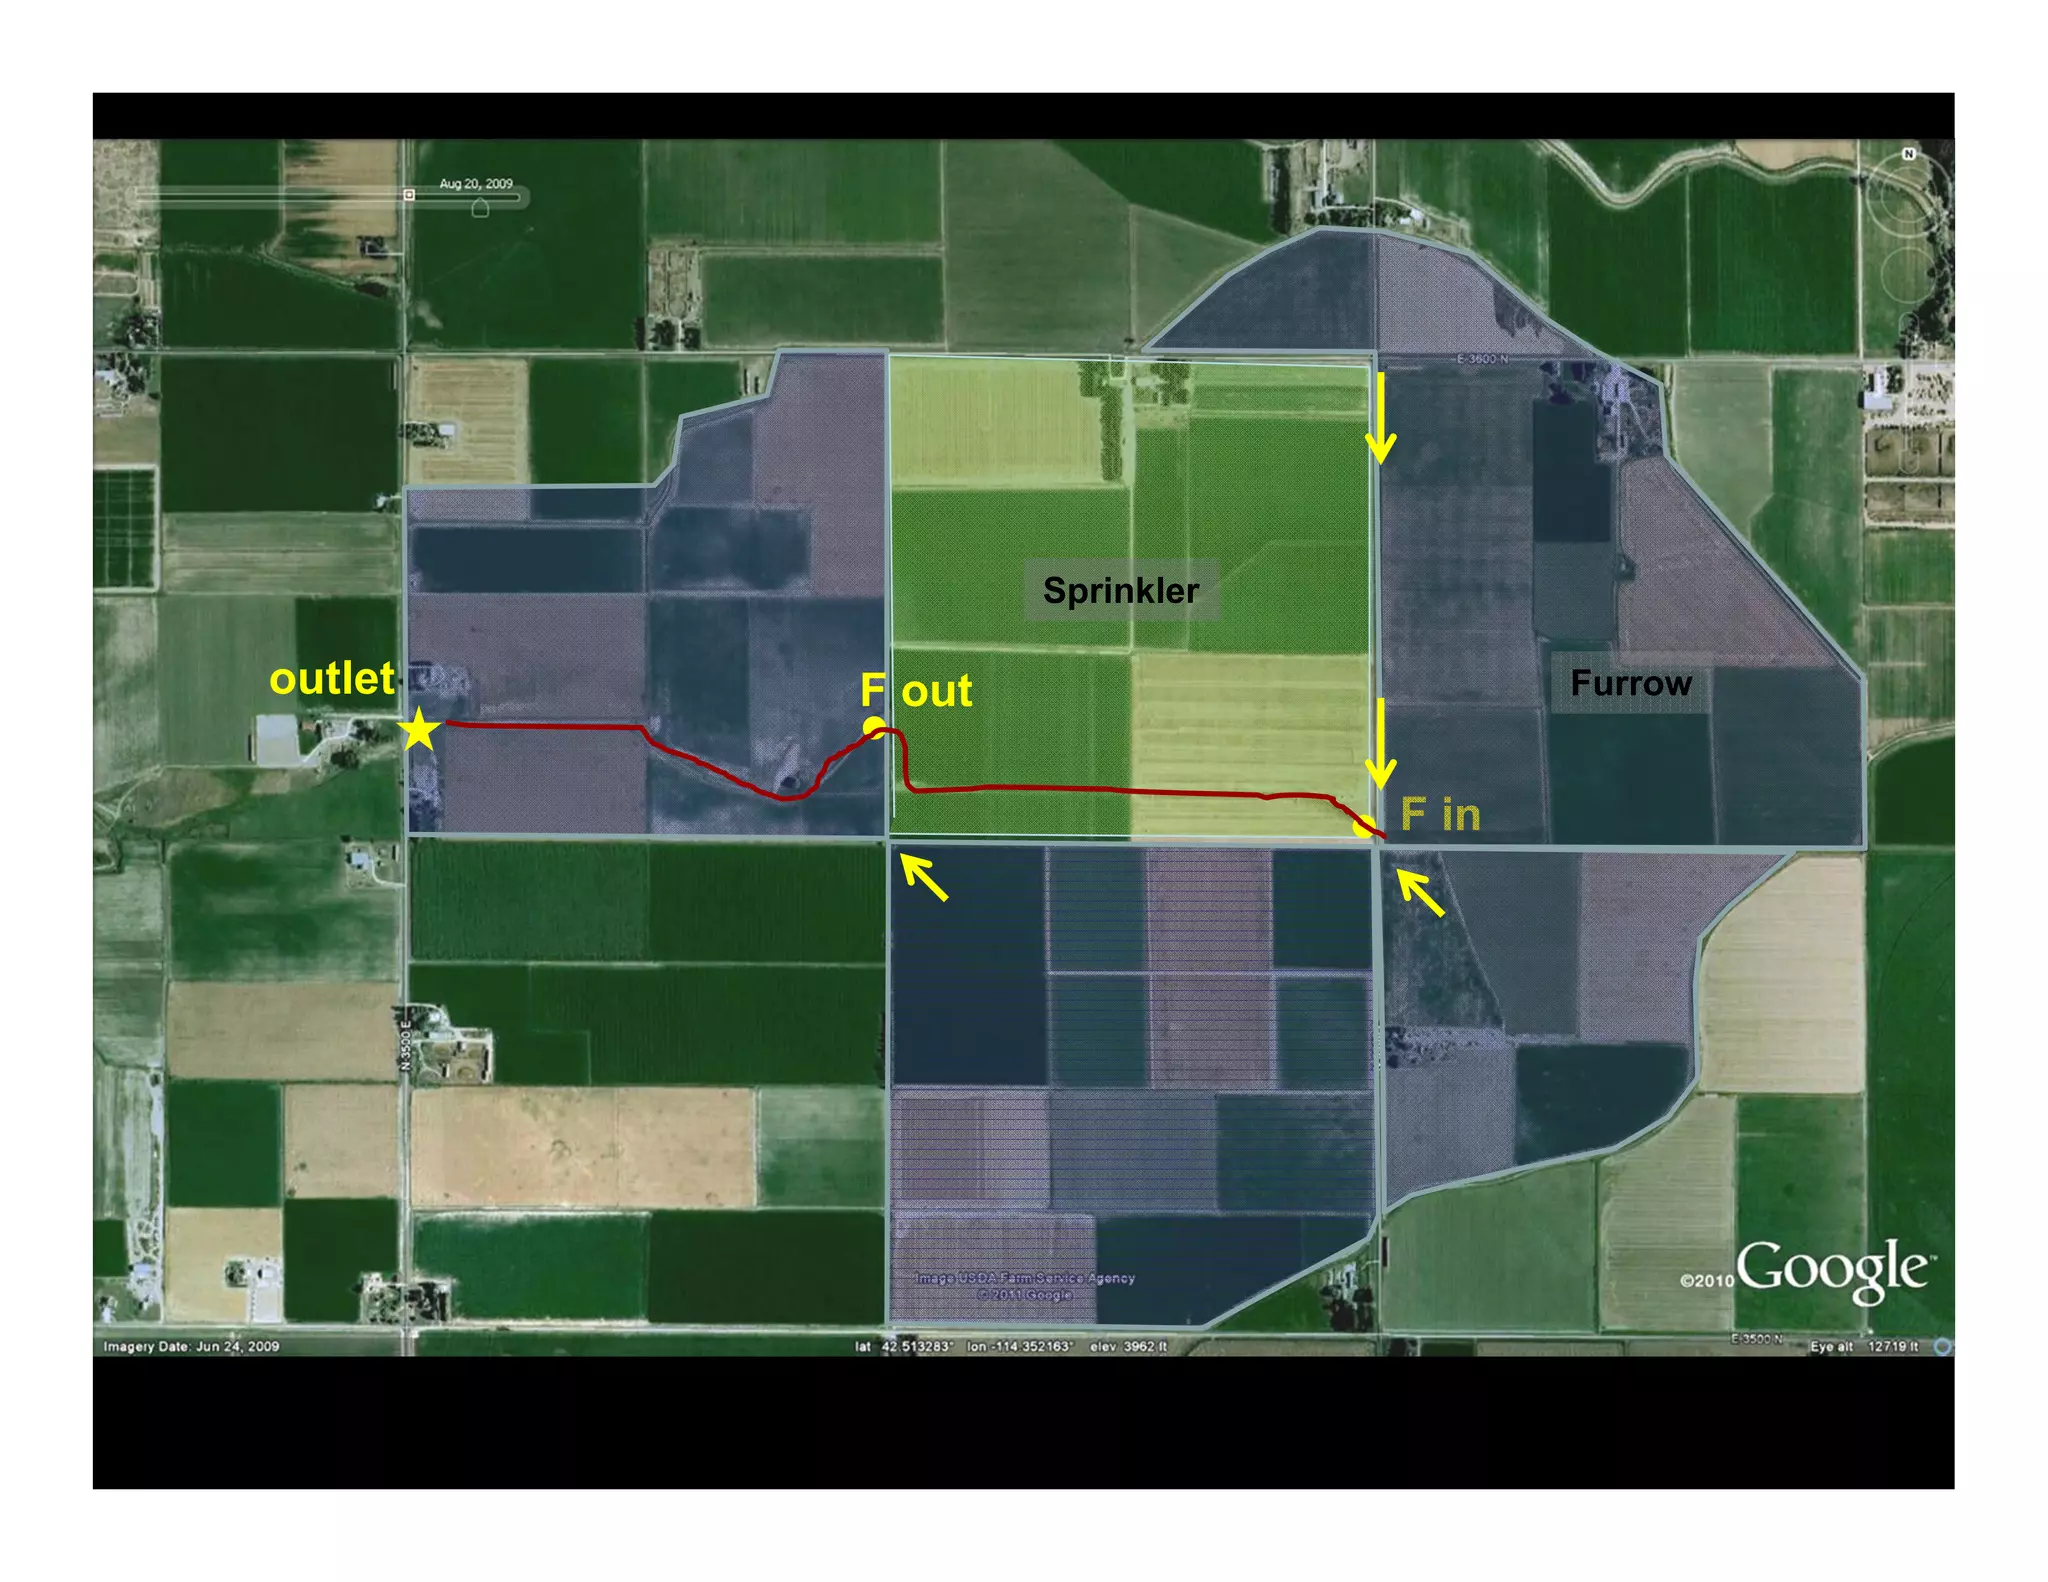

The document discusses water quality improvement in the Upper Snake Rock Watershed in Idaho from converting irrigation systems from surface to sprinkler irrigation. It summarizes that sediment and phosphorus loss from a farm decreased by 90% when the entire farm was converted from furrow to sprinkler irrigation. Overall, sediment loss across the watershed has dramatically decreased since the 1970s due to multiple conservation practices, though the specific amount of sprinkler irrigation within sub-watersheds did not correlate directly to sediment loss. Conversion to sprinkler irrigation appears to be an effective way to reduce sediment and phosphorus runoff.


