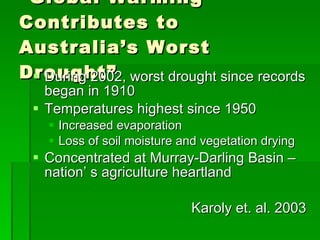
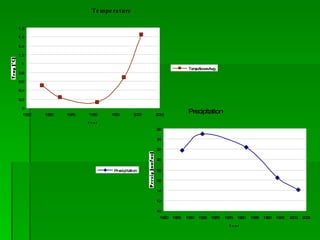
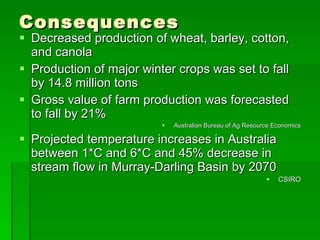
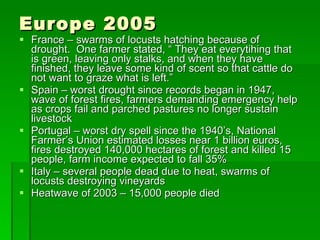
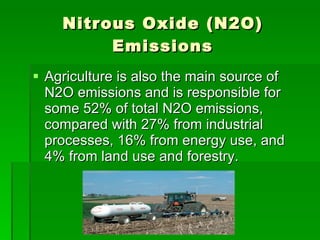
Downloaded 164 times

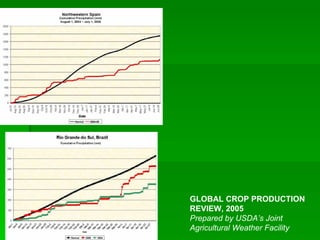
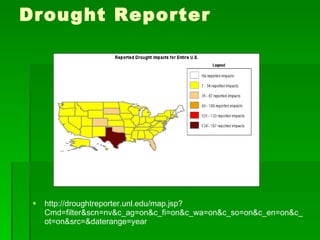
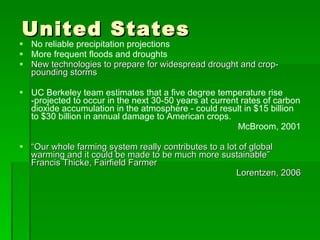
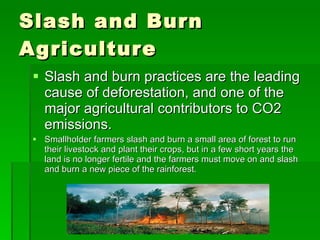
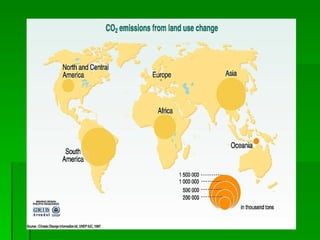

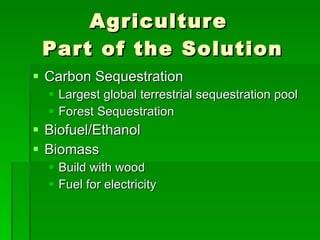
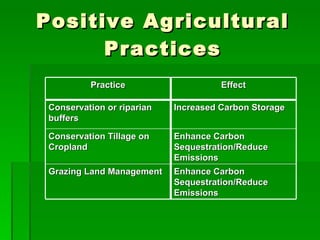
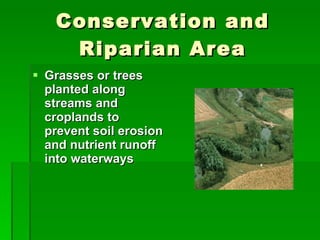
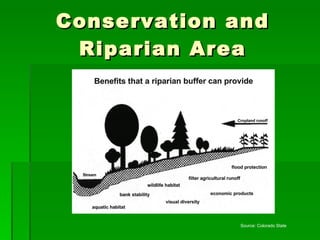
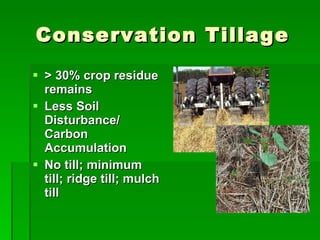
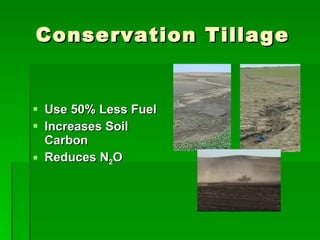
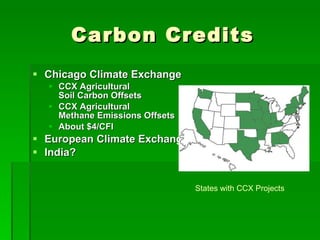

This document discusses how agriculture is both a victim and cause of global warming, as well as potential solutions. Rising temperatures and shifting precipitation patterns are negatively impacting crop yields around the world. Agriculture accounts for 9% of greenhouse gas emissions, primarily from livestock methane emissions and nitrogen fertilizer use. However, certain agricultural practices like conservation tillage, forestry, and use of biofuels can sequester carbon from the atmosphere and reduce emissions, positioning agriculture as part of the solution to climate change. Carbon markets and offsets may provide economic incentives for farmers to adopt more sustainable practices.


![Global Warming P P T [97 03]](https://cdn.slidesharecdn.com/ss_thumbnails/globalwarmingppt97-03-090408023255-phpapp02-thumbnail.jpg?width=640&height=640&fit=bounds)


![Global Warming[1]](https://cdn.slidesharecdn.com/ss_thumbnails/global-warming1-1233307039613576-1-thumbnail.jpg?width=640&height=640&fit=bounds)


