Download as PDF, PPTX


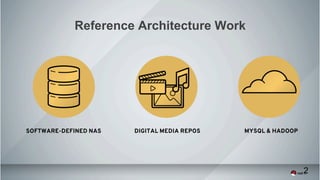
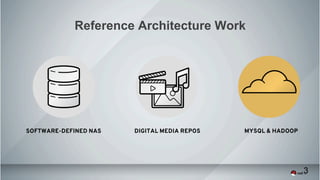
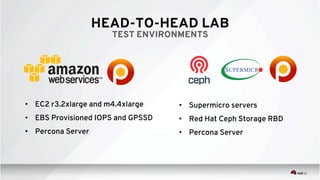

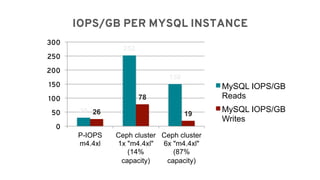
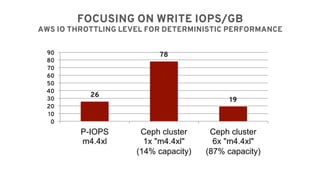
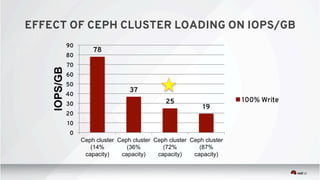
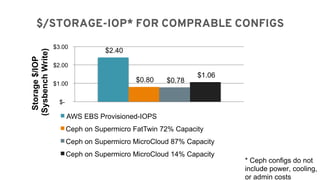
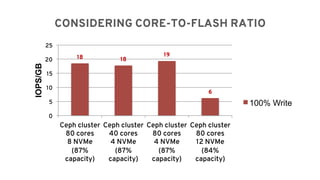
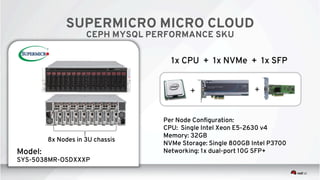
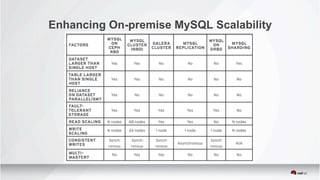
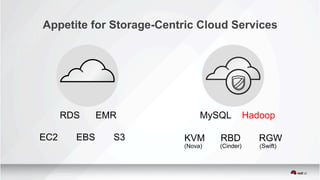
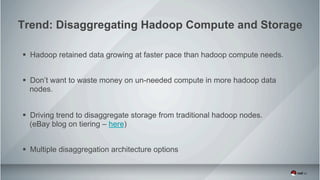
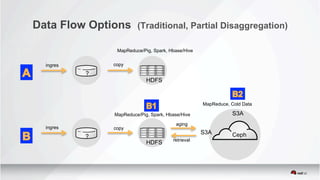
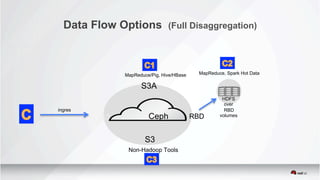
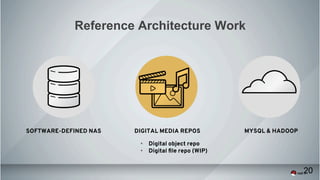

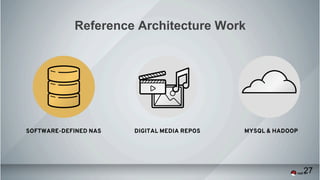


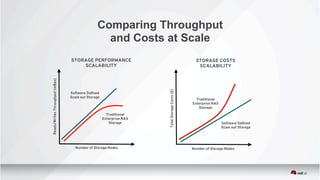


The document provides an overview and summary of Red Hat's reference architecture work including MySQL and Hadoop, software-defined NAS, and digital media repositories. It discusses trends toward disaggregating Hadoop compute and storage and various data flow options. It also summarizes performance testing Red Hat conducted comparing AWS EBS and Ceph for MySQL workloads, and analyzing factors like IOPS/GB ratios, core-to-flash ratios, and pricing. Server categories and vendor examples are defined. Comparisons of throughput and costs at scale between software-defined scale-out storage and traditional enterprise NAS solutions are also presented.