Downloaded 50 times
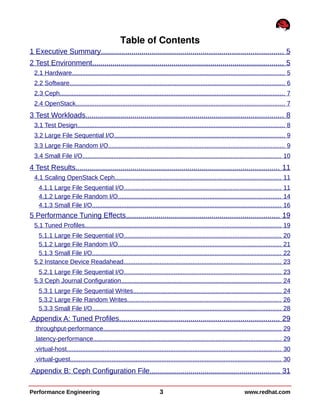

![Appendix B: Ceph Configuration File
[global]
fsid = 002196a8-0eaf-45fc-a355-45309962d06c
mon_initial_members = gprfc089
mon_host = 17.11.154.239
auth cluster required = none
auth service required = none
auth client required = none
filestore_xattr_use_omap = true
public network = 172.17.10.0/24
cluster network = 172.17.10.0/24
[client]
admin socket = /var/run/ceph/rbd-client-$pid.asok
log_file = /var/log/ceph/ceph-rbd.log
rbd cache = true
rbd cache writethrough until flush = true
[osd]
osd backfill full ratio = 0.90
#osd op threads = 8
#filestore merge threshold = 40
#filestore split multiple = 8
Performance Engineering 31 www.redhat.com](https://image.slidesharecdn.com/redhatenterpriselinuxopenstackplatformoninktankcephenterprise-150729232838-lva1-app6892/85/Red-Hat-Enterprise-Linux-OpenStack-Platform-on-Inktank-Ceph-Enterprise-31-320.jpg)
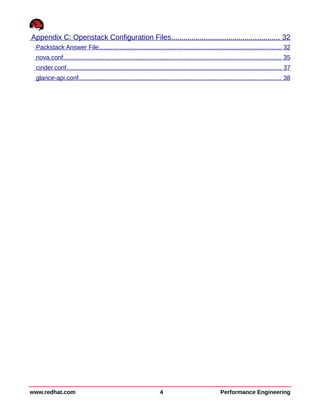
![Appendix C: Openstack Configuration Files
Packstack Answer File
[general]
CONFIG_DEBUG_MODE=n
CONFIG_SSH_KEY=/root/.ssh/id_rsa.pub
CONFIG_MYSQL_INSTALL=y
CONFIG_GLANCE_INSTALL=y
CONFIG_CINDER_INSTALL=y
CONFIG_NOVA_INSTALL=n
CONFIG_NEUTRON_INSTALL=y
CONFIG_HORIZON_INSTALL=y
CONFIG_SWIFT_INSTALL=n
CONFIG_CEILOMETER_INSTALL=y
CONFIG_HEAT_INSTALL=n
CONFIG_CLIENT_INSTALL=y
CONFIG_NTP_SERVERS=17.11.159.254,17.11.255.2,17.11.255.3
CONFIG_NAGIOS_INSTALL=n
EXCLUDE_SERVERS=
CONFIG_MYSQL_HOST=17.11.154.120
CONFIG_MYSQL_USER=root
CONFIG_MYSQL_PW=password
CONFIG_QPID_HOST=17.11.154.120
CONFIG_QPID_ENABLE_SSL=n
CONFIG_QPID_ENABLE_AUTH=n
CONFIG_QPID_NSS_CERTDB_PW=password
CONFIG_QPID_SSL_PORT=5671
CONFIG_QPID_SSL_CERT_FILE=/etc/pki/tls/certs/qpid_selfcert.pem
CONFIG_QPID_SSL_KEY_FILE=/etc/pki/tls/private/qpid_selfkey.pem
CONFIG_QPID_SSL_SELF_SIGNED=y
CONFIG_QPID_AUTH_USER=qpid_user
CONFIG_QPID_AUTH_PASSWORD=password
CONFIG_KEYSTONE_HOST=17.11.154.120
CONFIG_KEYSTONE_DB_PW=password
CONFIG_KEYSTONE_ADMIN_TOKEN=9a4d45dc558742099f8011b5ba8d7869
CONFIG_KEYSTONE_ADMIN_PW=password
CONFIG_KEYSTONE_DEMO_PW=password
CONFIG_KEYSTONE_TOKEN_FORMAT=PKI
CONFIG_GLANCE_HOST=17.11.154.120
CONFIG_GLANCE_DB_PW=password
CONFIG_GLANCE_KS_PW=password
CONFIG_CINDER_HOST=17.11.154.120
CONFIG_CINDER_DB_PW=password
CONFIG_CINDER_KS_PW=password
CONFIG_CINDER_VOLUMES_CREATE=n
CONFIG_CINDER_VOLUMES_SIZE=20G
CONFIG_CINDER_NFS_MOUNTS=
CONFIG_NOVA_API_HOST=17.11.154.120
CONFIG_NOVA_CERT_HOST=17.11.154.120
CONFIG_NOVA_VNCPROXY_HOST=17.11.154.120
www.redhat.com 32 Performance Engineering](https://image.slidesharecdn.com/redhatenterpriselinuxopenstackplatformoninktankcephenterprise-150729232838-lva1-app6892/85/Red-Hat-Enterprise-Linux-OpenStack-Platform-on-Inktank-Ceph-Enterprise-32-320.jpg)
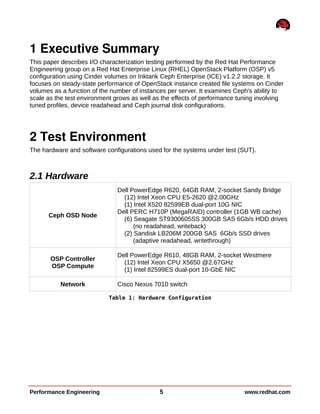
![nova.conf
[DEFAULT]
rabbit_host=17.11.154.120
rabbit_port=5672
rabbit_hosts=17.11.154.120:5672
rabbit_userid=guest
rabbit_password=password
rabbit_virtual_host=/
rabbit_ha_queues=False
rpc_backend=nova.openstack.common.rpc.impl_kombu
state_path=/var/lib/nova
quota_instances=160
quota_cores=160
quota_ram=1200000
enabled_apis=ec2,osapi_compute,metadata
ec2_listen=0.0.0.0
osapi_compute_listen=0.0.0.0
osapi_compute_workers=24
metadata_listen=0.0.0.0
service_down_time=60
rootwrap_config=/etc/nova/rootwrap.conf
auth_strategy=keystone
use_forwarded_for=False
service_neutron_metadata_proxy=True
neutron_metadata_proxy_shared_secret=password
neutron_default_tenant_id=default
novncproxy_host=0.0.0.0
novncproxy_port=6080
glance_api_servers=17.11.154.120:9292
network_api_class=nova.network.neutronv2.api.API
metadata_host=17.11.154.120
neutron_url=http://17.11.154.120:9696
neutron_url_timeout=30
neutron_admin_username=neutron
neutron_admin_password=password
neutron_admin_tenant_name=services
neutron_region_name=RegionOne
neutron_admin_auth_url=http://17.11.154.120:35357/v2.0
neutron_auth_strategy=keystone
neutron_ovs_bridge=br-int
neutron_extension_sync_interval=600
security_group_api=neutron
lock_path=/var/lib/nova/tmp
debug=true
verbose=True
log_dir=/var/log/nova
use_syslog=False
cpu_allocation_ratio=16.0
ram_allocation_ratio=1.5
scheduler_default_filters=RetryFilter,AvailabilityZoneFilter,RamFilter,Compu
teFilter,ComputeCapabilitiesFilter,ImagePropertiesFilter,CoreFilter
firewall_driver=nova.virt.firewall.NoopFirewallDriver
volume_api_class=nova.volume.cinder.API
Performance Engineering 35 www.redhat.com](https://image.slidesharecdn.com/redhatenterpriselinuxopenstackplatformoninktankcephenterprise-150729232838-lva1-app6892/85/Red-Hat-Enterprise-Linux-OpenStack-Platform-on-Inktank-Ceph-Enterprise-35-320.jpg)
![sql_connection=mysql://nova:password@17.11.154.120/nova
image_service=nova.image.glance.GlanceImageService
libvirt_vif_driver=nova.virt.libvirt.vif.LibvirtGenericVIFDriver
osapi_volume_listen=0.0.0.0
libvirt_use_virtio_for_bridges=True
[baremetal]
use_file_injection=true
[keystone_authtoken]
auth_host=17.11.154.120
auth_port=35357
auth_protocol=http
auth_uri=http://17.11.154.120:5000/
admin_user=nova
admin_password=password
admin_tenant_name=services
[libvirt]
libvirt_images_type=rbd
libvirt_images_rbd_pool=volumes
libvirt_images_rbd_ceph_conf=/etc/ceph/ceph.conf
rbd_user=cinder
rbd_secret_uuid=575b15f2-b2b1-48d0-9df9-29dea74333e8
inject_password=false
inject_key=false
inject_partition=-2
www.redhat.com 36 Performance Engineering](https://image.slidesharecdn.com/redhatenterpriselinuxopenstackplatformoninktankcephenterprise-150729232838-lva1-app6892/85/Red-Hat-Enterprise-Linux-OpenStack-Platform-on-Inktank-Ceph-Enterprise-36-320.jpg)
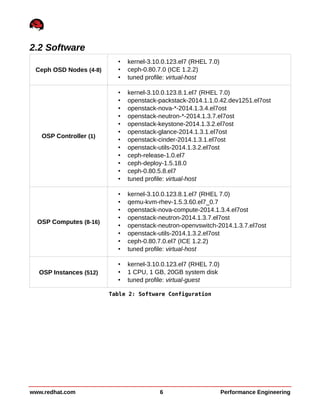
![cinder.conf
[DEFAULT]
rabbit_host=17.11.154.120
rabbit_port=5672
rabbit_hosts=17.11.154.120:5672
rabbit_userid=guest
rabbit_password=password
rabbit_virtual_host=/
rabbit_ha_queues=False
notification_driver=cinder.openstack.common.notifier.rpc_notifier
rpc_backend=cinder.openstack.common.rpc.impl_kombu
control_exchange=openstack
quota_volumes=160
quota_gigabytes=6400
osapi_volume_listen=0.0.0.0
backup_ceph_conf=/etc/ceph/ceph.conf
backup_ceph_user=cinder-backup
backup_ceph_chunk_size=134217728
backup_ceph_pool=backups
backup_ceph_stripe_unit=0
backup_ceph_stripe_count=0
restore_discard_excess_bytes=true
backup_driver=cinder.backup.drivers.ceph
api_paste_config=/etc/cinder/api-paste.ini
glance_host=17.11.154.120
glance_api_version=2
auth_strategy=keystone
debug=False
verbose=True
log_dir=/var/log/cinder
use_syslog=False
iscsi_ip_address=17.11.154.120
iscsi_helper=lioadm
volume_group=cinder-volumes
rbd_pool=volumes
rbd_user=cinder
rbd_ceph_conf=/etc/ceph/ceph.conf
rbd_flatten_volume_from_snapshot=false
rbd_secret_uuid=575b15f2-b2b1-48d0-9df9-29dea74333e8
rbd_max_clone_depth=5
rbd_store_chunk_size = 4
rados_connect_timeout = -1
glance_api_version = 2
volume_driver=cinder.volume.drivers.rbd.RBDDriver
sql_connection=mysql://cinder:password@17.11.154.120/cinder
sql_idle_timeout=3600
Performance Engineering 37 www.redhat.com](https://image.slidesharecdn.com/redhatenterpriselinuxopenstackplatformoninktankcephenterprise-150729232838-lva1-app6892/85/Red-Hat-Enterprise-Linux-OpenStack-Platform-on-Inktank-Ceph-Enterprise-37-320.jpg)
![glance-api.conf
[DEFAULT]
verbose=True
debug=True
default_store=rbd
bind_host=0.0.0.0
bind_port=9292
log_file=/var/log/glance/api.log
backlog=4096
workers=24
show_image_direct_url=True
use_syslog=False
registry_host=0.0.0.0
registry_port=9191
notifier_strategy = rabbit
rabbit_host=17.11.154.120
rabbit_port=5672
rabbit_use_ssl=False
rabbit_userid=guest
rabbit_password=password
rabbit_virtual_host=/
rabbit_notification_exchange=glance
rabbit_notification_topic=notifications
rabbit_durable_queues=False
filesystem_store_datadir=/var/lib/glance/images/
rbd_store_ceph_conf = /etc/ceph/ceph.conf
rbd_store_user=glance
rbd_store_pool=images
rbd_store_chunk_size = 8
sql_connection=mysql://glance:<password>@17.11.154.120/glance
sql_idle_timeout=3600
[keystone_authtoken]
auth_host=17.11.154.120
auth_port=35357
auth_protocol=http
admin_tenant_name=services
admin_user=glance
admin_password=password
auth_uri=http://17.11.154.120:5000/
[paste_deploy]
flavor=keystone
www.redhat.com 38 Performance Engineering](https://image.slidesharecdn.com/redhatenterpriselinuxopenstackplatformoninktankcephenterprise-150729232838-lva1-app6892/85/Red-Hat-Enterprise-Linux-OpenStack-Platform-on-Inktank-Ceph-Enterprise-38-320.jpg)

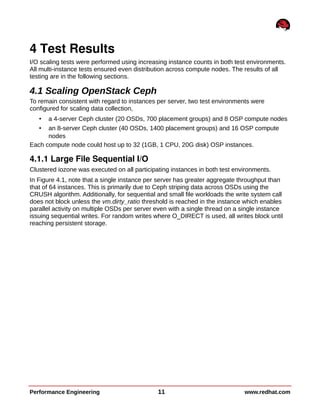
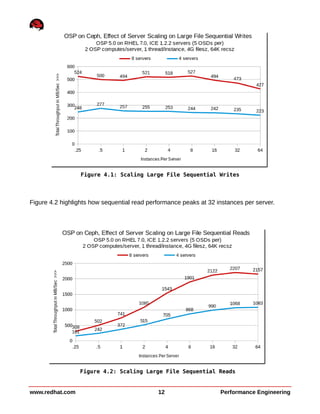
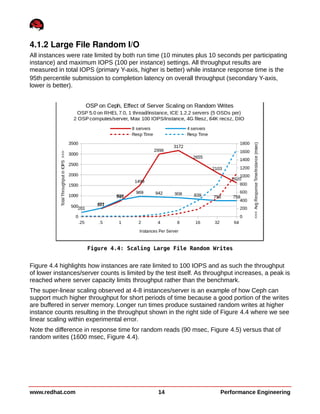
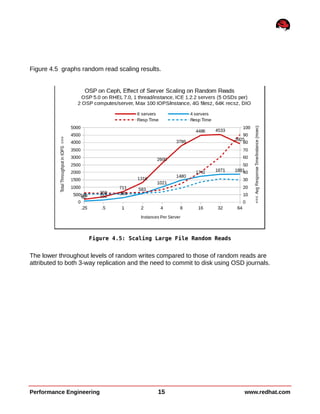
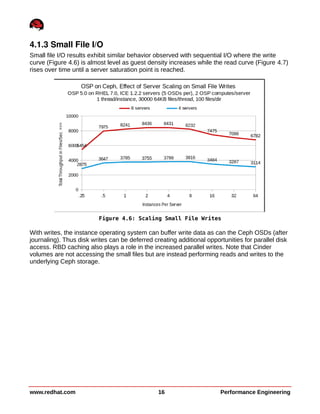
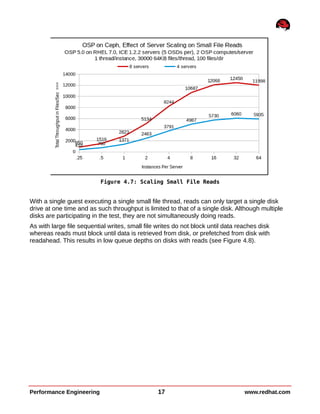
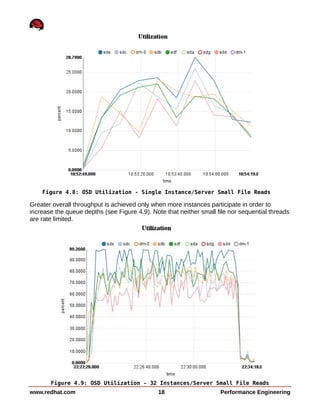
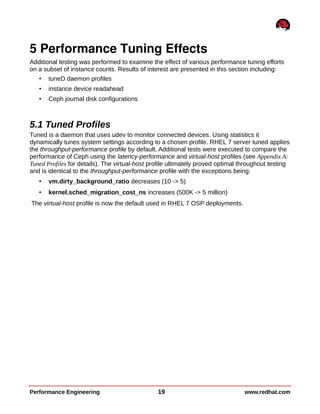
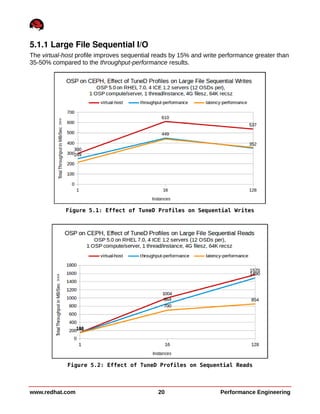
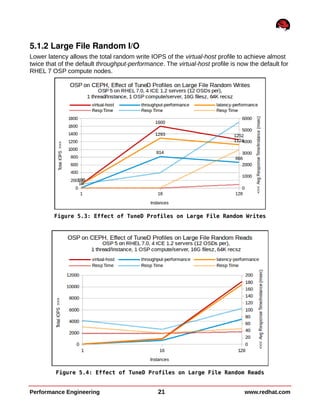
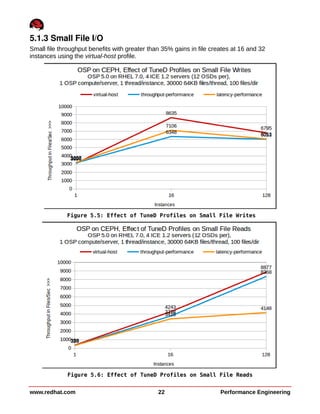
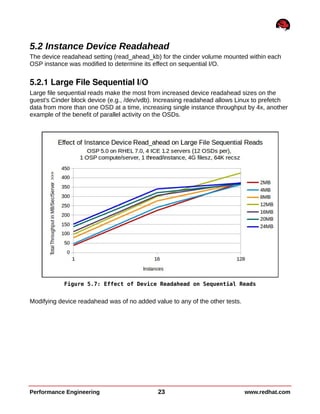
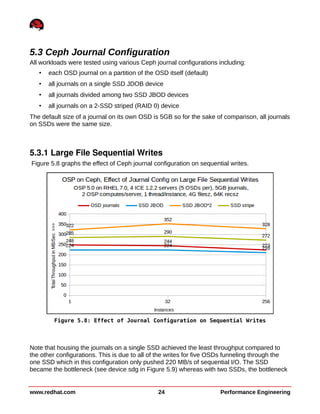
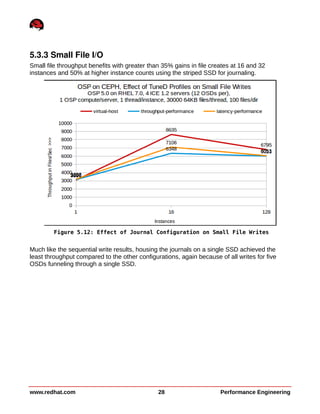
This document summarizes performance testing of OpenStack with Cinder volumes on Ceph storage. It tested scaling performance with increasing instance counts on a 4-node and 8-node Ceph cluster. Key findings include: - Large file sequential write performance peaked with a single instance per server due to data striping across OSDs. Read performance peaked at 32 instances per server. - Large file random I/O performance scaled linearly with increasing instances up to the maximum tested (512 instances). - Small file operations showed good scaling up to 32 instances per server for creates and reads, but lower performance for renames and deletes. - Performance tuning like tuned profiles, device readahead, and Ceph journal configuration improved both