Downloaded 490 times


![13
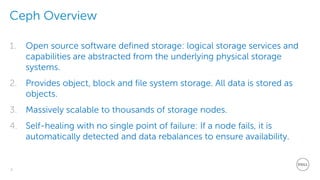
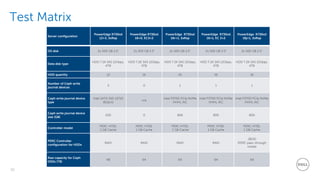
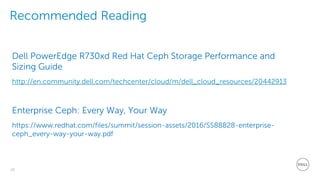
Storage node configurations tested
OSD to Journal
Ratio [drives]
12+3 16+0 16+1
OSD node
configuration
12+3 16+0 16+1
HDDs 12 16 16
HDD RAID mode Single-disk RAID0 Single-disk RAID0 Single-disk RAID0 / HBA mode
SATA SSDs 3 0 0
SSD RAID mode JBOD JBOD JBOD
NVMe SSDs 0 0 1
Network 1x 10 GbE Front-End
1x 10 GbE Back-End
1x 10 GbE Front-End
1x 10 GbE Back-End
1x 10 GbE Front-End
1x 10 GbE Back-End](https://image.slidesharecdn.com/ceph-perf-sizing-guide-160914153529/85/Ceph-Performance-and-Sizing-Guide-13-320.jpg)


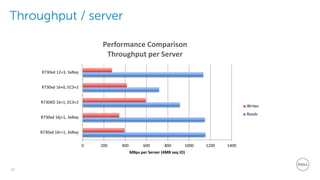
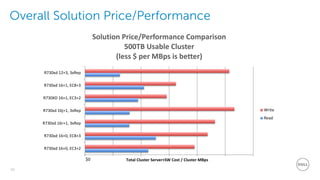
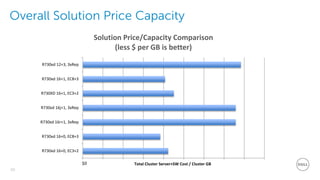
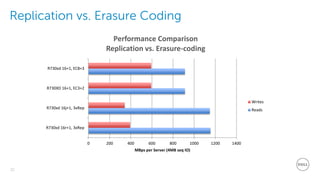

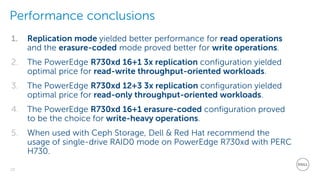


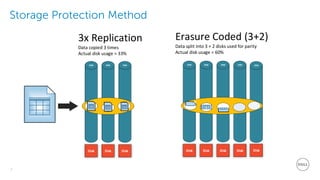
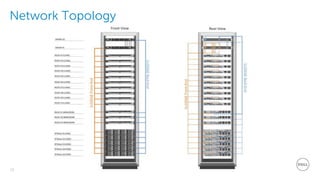
The Red Hat Ceph Performance & Sizing Guide provides an overview of Ceph, its architecture, and data storage methods while detailing test methodologies and results. Key findings emphasize the performance outcomes of various configurations, including the advantages of replication and erasure coding for different workloads. Recommendations for sizing and configuration are included to optimize performance and cost efficiency in storage solutions.


![[OpenInfra Days Korea 2018] Day 2 - CEPH 운영자를 위한 Object Storage Performance T...](https://cdn.slidesharecdn.com/ss_thumbnails/openinfradayobjectstorageperformancefinal2-180704062033-thumbnail.jpg?width=640&height=640&fit=bounds)


![[232] 성능어디까지쥐어짜봤니 송태웅](https://cdn.slidesharecdn.com/ss_thumbnails/232-161025013504-thumbnail.jpg?width=640&height=640&fit=bounds)