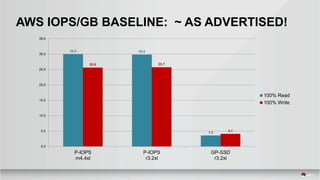
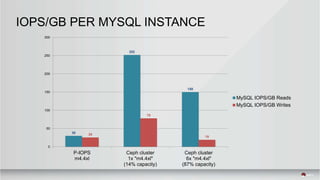
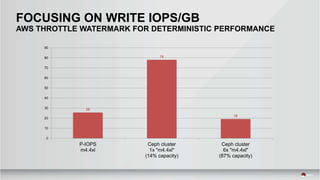
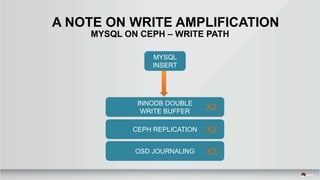
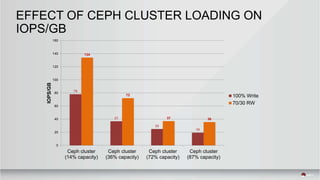
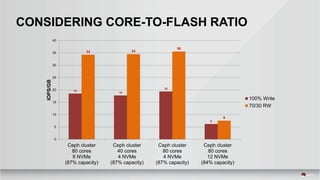
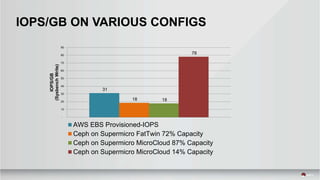
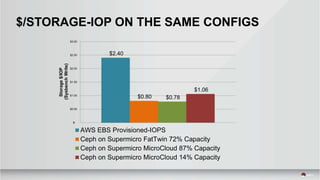
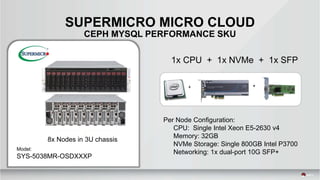
PERFORMANCE AND SIZING
SOFTWARE DEFINED STORAGE
Kyle Bader
Red Hat Storage Day, Los Angeles
August 2016
$> whois kyle bader
Senior Solution Architect
Red Hat
DATA CHALLENGES
Exponential growth in digital content increases pressure on
capacity, scalability, and cost.
The need for access to data from anywhere, anytime, on
any device requires unprecedented agility.
Modern services require the flexibility to store data on-
premises or in the cloud.
Growing content requires advanced data protection that
ensures integrity & high availability at very large scale.
1
2
3
4
Traditional Storage
Complex proprietary silos
Open, Software-Defined Storage
Standardized, unified, open platforms
Custom GUI
Proprietary Software
Proprietary
Hardware
Standard
Computers
and Disks
Standard
Hardware
OpenSource
Software
Ceph Gluster +++
Control Plane (API, GUI)
ADMIN USER
THE FUTURE OF STORAGE
ADMIN
USER
ADMIN
USER
ADMIN
USER
Custom GUI
Proprietary Software
Proprietary
Hardware
Custom GUI
Proprietary Software
Proprietary
Hardware
FLEXIBILITY IS CRUCIAL
Server-based storage uses software and standard hardware to provide services
traditionally provided by single-purpose storage appliances, providing increased
agility and efficiency.
DISTRIBUTED CLUSTER OF
SERVERS
MEDIA MEDIA MEDIA MEDIA MEDIA MEDIA MEDIA
APPLIANCE
MEDIA MEDIA
APPLIANCE
MEDIA MEDIA
APPLIANCE
MEDIA MEDIA
USER USER USER
SERVER-BASED STORAGE
USER USER USER
STORAGE APPLIANCE
COMPUTE
NODE + + + +
+
STORAGE
NODE
COMPUTE
NODE + + + +
+ + + +
+
+
+
+
+
+
+
+
VIRTUALIZED STORAGE SCALES BETTER
STANDARD SAN/NAS IS ON THE DECLINE
Server-based storage is “will account for over 60%
of shipments long term.”
“By 2016, server-based storage solutions will lower
storage hardware costs by 50% or more.”
Gartner: “IT Leaders Can Benefit From Disruptive Innovation in the Storage Industry”
Credit Suisse Storage Update, September 3, 2015
Changing workloads drive the need for
flexible, economical server-based storage.
WW DEPLOYED CAPACITY (TB)
2010 2011 2012 2013 2014 2015
(est)
2016
(est)
Source: IDC
0%
60%
20%
40%
80%
100
%
Internal CapacityExternal
Capacity
STORAGE ORCHESTRATION
Storage orchestration is the ability to provision, grow, shrink, and decommission
storage resources on-demand and programmatically, providing increased control
and integration of storage into a software-defined data center.
WEB CONSOLE
A browser interface designed for
managing distributed storage
API
A full API for automation and
integration with outside systems
COMMAND LINE
A robust, scriptable command-line
interface for expert operators
PROVISION INSTALL CONFIGURE TUNE MONITOR
Full lifecycle management for distributed, software-defined data services
A RISING TIDE
“By 2020, between 70-80% of unstructured data will
be held on lower-cost storage managed by SDS”
“By 2019, 70% of existing storage array products
will also be available as software only versions”
Innovation Insight: Separating Hype From Hope for Software-Defined Storage
2013 2014 2015 2016 2017 2018 2019
$1,349M
$1,195
M
$1,029M
$859M
$706M
$592M
SDS-P MARKET SIZE BY SEGMENT
$457M
Block Storage
File Storage
Object Storage
Hyperconverged
Source: IDC
Software-Defined Storage is leading a
shift in the global storage industry, with
far-reaching effects.
THE BALANCE
Inflexible
Expensive at large scale
Durable
Convenient
Flexible
Economical at large scale
Durable
Powerful
Appliances are suitable for small-
scale, workloads, but they do not scale
economically.
Software-defined storage has a
learning curve, but bring performance
and economy at petabyte scale.
THE ROBUSTNESS OF SOFTWARE
Software is more flexible than hardware
Software can do things hardware appliances can’t. SDS brings the
flexibility of software to the enterprise storage world.
• Can be deployed on bare metal, inside containers, inside VMs, or
in the public cloud.
• Can deploy on a single server, or thousands, and can be
upgraded and reconfigured on the fly.
• Grows and shrinks programmatically to meet changing demands
BUILDING ON PROVEN HARDWARE
Hardware is hard, and we got you covered
Tested software defined storage solutions, for repeatable success.
• Ceph Hardware Configuration Guide
• Ceph Hardware Selection Guide
• Ceph Performance and Sizing Guide - Supermicro
• Ceph Performance and Sizing Guide - Quanta QCT
OPTIMIZATION CRITERIA
IOPS
Optimized
Throughput
Optimized
Capacity
Optimized
• Lowest cost per IO
• Highest IOPS
• Meet minimum fault domain
requirement
• Lowest cost per unit of throughput
• Highest throughput
• Highest throughput per watt/BTU
• Meet minimum fault domain
requirement
• Lowest cost per TB
• Lowest watt/BTU per TB
• Meet minimum fault domain
requirement
• Typically block storage
• Replication
• MySQL for OpenStack tenants
• Block and object storage
• Replication or erasure coded
• Active performance storage for video,
audio, and images
• Streaming media
• Typically object storage
• Erasure coding dominant
• Media archives
• Data lake
• Shared, elastic storage pool
• Dynamic DB placement
• Flexible volume resizing
• Live instance migration
• Backup to object pool
• Read replicas via copy-on-write snapshots
MySQL ON CEPH STORAGE CLOUD
OPS EFFICIENCY
MYSQL-ON-CEPH PRIVATE CLOUD
FIDELITY TO A MYSQL-ON-AWS EXPERIENCE
• Hybrid cloud requires public/private cloud commonalities
• Developers want DevOps consistency
• Elastic block storage, Ceph RBD vs. AWS EBS
• Elastic object storage, Ceph RGW vs. AWS S3
• Users want deterministic performance
HEAD-TO-HEAD
PERFORMANCE
30 IOPS/GB: AWS EBS P-IOPS TARGET
HEAD-TO-HEAD LAB
TEST ENVIRONMENTS
• EC2 r3.2xlarge and m4.4xlarge
• EBS Provisioned IOPS and GPSSD
• Percona Server
• Supermicro servers
• Red Hat Ceph Storage RBD
• Percona Server
OSD Storage Server Systems
5x SuperStorage SSG-6028R-OSDXXX
Dual Intel Xeon E5-2650v3 (10x core)
32GB SDRAM DDR3
2x 80GB boot drives
4x 800GB Intel DC P3700 (hot-swap U.2 NVMe)
1x dual port 10GbE network adaptors AOC-STGN-i2S
8x Seagate 6TB 7200 RPM SAS (unused in this lab)
Mellanox 40GbE network adaptor(unused in this lab)
MySQL Client Systems
12x Super Server 2UTwin2 nodes
Dual Intel Xeon E5-2670v2
(cpuset limited to 8 or 16 vCPUs)
64GB SDRAM DDR3
Storage Server Software:
Red Hat Ceph Storage 1.3.2
Red Hat Enterprise Linux 7.2
Percona Server
5x OSD Nodes 12x Client Nodes
Shared10GSFP+Networking
Monitor Nodes
SUPERMICRO CEPH
LAB ENVIRONMENT
7996 7956
950
1680 1687
267
0
1000
2000
3000
4000
5000
6000
7000
8000
9000
P-IOPS
m4.4xl
P-IOPS
r3.2xl
GP-SSD
r3.2xl
100% Read
100% Write
SYSBENCH BASELINE ON AWS EC2 + EBS
7996
67144
40031
1680
5677
1258
20053
4752
0
10000
20000
30000
40000
50000
60000
70000
80000
P-IOPS
m4.4xl
Ceph cluster
1x "m4.4xl"
(14% capacity)
Ceph cluster
6x "m4.4xl"
(87% capacity)
100% Read
100% write
70/30 RW
SYSBENCH REQUESTS PER MYSQL INSTANCE
CONVERTING SYSBENCH REQUESTS TO
IOPS READ PATH
X% FROM INNODB BUFFER POOL
IOPS = (READ REQUESTS – X%)
SYSBENCH READ
CONVERTING SYSBENCH REQUESTS TO
IOPS WRITE PATH
SYSBENCH WRITE
1X READ
X% FROM INNODB BUFFER POOL
IOPS = (READ REQ – X%)
LOG, DOUBLE WRITE BUFFER
IOPS = (WRITE REQ * 2.3)
1X WRITE
30.0 29.8
3.6
25.6 25.7
4.1
0.0
5.0
10.0
15.0
20.0
25.0
30.0
35.0
P-IOPS
m4.4xl
P-IOPS
r3.2xl
GP-SSD
r3.2xl
100% Read
100% Write
AWS IOPS/GB BASELINE: ~ AS ADVERTISED!
IOPS/GB PER MYSQL INSTANCE
30
252
150
26
78
19
0
50
100
150
200
250
300
P-IOPS
m4.4xl
Ceph cluster
1x "m4.4xl"
(14% capacity)
Ceph cluster
6x "m4.4xl"
(87% capacity)
MySQL IOPS/GB Reads
MySQL IOPS/GB Writes
FOCUSING ON WRITE IOPS/GB
AWS THROTTLE WATERMARK FOR DETERMINISTIC PERFORMANCE
26
78
19
0
10
20
30
40
50
60
70
80
90
P-IOPS
m4.4xl
Ceph cluster
1x "m4.4xl"
(14% capacity)
Ceph cluster
6x "m4.4xl"
(87% capacity)
A NOTE ON WRITE AMPLIFICATION
MYSQL ON CEPH – WRITE PATH
INNODB DOUBLE
WRITE BUFFER
CEPH REPLICATION
OSD JOURNALING
MYSQL
INSERT
X2
X2
X2
EFFECT OF CEPH CLUSTER LOADING ON
IOPS/GB
78
37
25
19
134
72
37 36
0
20
40
60
80
100
120
140
160
Ceph cluster
(14% capacity)
Ceph cluster
(36% capacity)
Ceph cluster
(72% capacity)
Ceph cluster
(87% capacity)
IOPS/GB
100% Write
70/30 RW
18
18
19
6
34 34
36
8
0
5
10
15
20
25
30
35
40
Ceph cluster
80 cores
8 NVMe
(87% capacity)
Ceph cluster
40 cores
4 NVMe
(87% capacity)
Ceph cluster
80 cores
4 NVMe
(87% capacity)
Ceph cluster
80 cores
12 NVMe
(84% capacity)
IOPS/GB
100% Write
70/30 RW
CONSIDERING CORE-TO-FLASH RATIO
HEAD-TO-HEAD
PERFORMANCE
30 IOPS/GB: AWS EBS P-IOPS TARGET
25 IOPS/GB: CEPH 72% CLUSTER CAPACITY (WRITES)
78 IOPS/GB: CEPH 14% CLUSTER CAPACITY (WRITES)
HEAD-TO-HEAD
PRICE/PERFORMANCE
$2.50: TARGET AWS EBS P-IOPS STORAGE PER IOP
IOPS/GB ON VARIOUS CONFIGS
31
18 18
78
-
10
20
30
40
50
60
70
80
90
IOPS/GB
(SysbenchWrite)
AWS EBS Provisioned-IOPS
Ceph on Supermicro FatTwin 72% Capacity
Ceph on Supermicro MicroCloud 87% Capacity
Ceph on Supermicro MicroCloud 14% Capacity
$/STORAGE-IOP ON THE SAME CONFIGS
$2.40
$0.80 $0.78
$1.06
$-
$0.50
$1.00
$1.50
$2.00
$2.50
$3.00
Storage$/IOP
(SysbenchWrite)
AWS EBS Provisioned-IOPS
Ceph on Supermicro FatTwin 72% Capacity
Ceph on Supermicro MicroCloud 87% Capacity
Ceph on Supermicro MicroCloud 14% Capacity
HEAD-TO-HEAD
PRICE/PERFORMANCE
$2.50: TARGET AWS P-IOPS $/IOP (EBS ONLY)
$0.78: CEPH ON SUPERMICRO MICRO CLOUD CLUSTER
8x Nodes in 3U chassis
Model:
SYS-5038MR-OSDXXXP
Per Node Configuration:
CPU: Single Intel Xeon E5-2630 v4
Memory: 32GB
NVMe Storage: Single 800GB Intel P3700
Networking: 1x dual-port 10G SFP+
+ +
1x CPU + 1x NVMe + 1x SFP
SUPERMICRO MICRO CLOUD
CEPH MYSQL PERFORMANCE SKU
Red Hat Storage Day LA - Performance and Sizing Software Defined Storage

Red Hat Storage Day LA - Performance and Sizing Software Defined Storage

  • 1.
    PERFORMANCE AND SIZING SOFTWAREDEFINED STORAGE Kyle Bader Red Hat Storage Day, Los Angeles August 2016
  • 2.
    $> whois kylebader Senior Solution Architect Red Hat
  • 3.
    DATA CHALLENGES Exponential growthin digital content increases pressure on capacity, scalability, and cost. The need for access to data from anywhere, anytime, on any device requires unprecedented agility. Modern services require the flexibility to store data on- premises or in the cloud. Growing content requires advanced data protection that ensures integrity & high availability at very large scale. 1 2 3 4
  • 4.
    Traditional Storage Complex proprietarysilos Open, Software-Defined Storage Standardized, unified, open platforms Custom GUI Proprietary Software Proprietary Hardware Standard Computers and Disks Standard Hardware OpenSource Software Ceph Gluster +++ Control Plane (API, GUI) ADMIN USER THE FUTURE OF STORAGE ADMIN USER ADMIN USER ADMIN USER Custom GUI Proprietary Software Proprietary Hardware Custom GUI Proprietary Software Proprietary Hardware
  • 5.
  • 6.
    Server-based storage usessoftware and standard hardware to provide services traditionally provided by single-purpose storage appliances, providing increased agility and efficiency. DISTRIBUTED CLUSTER OF SERVERS MEDIA MEDIA MEDIA MEDIA MEDIA MEDIA MEDIA APPLIANCE MEDIA MEDIA APPLIANCE MEDIA MEDIA APPLIANCE MEDIA MEDIA USER USER USER SERVER-BASED STORAGE USER USER USER
  • 7.
    STORAGE APPLIANCE COMPUTE NODE ++ + + + STORAGE NODE COMPUTE NODE + + + + + + + + + + + + + + + + VIRTUALIZED STORAGE SCALES BETTER
  • 8.
    STANDARD SAN/NAS ISON THE DECLINE Server-based storage is “will account for over 60% of shipments long term.” “By 2016, server-based storage solutions will lower storage hardware costs by 50% or more.” Gartner: “IT Leaders Can Benefit From Disruptive Innovation in the Storage Industry” Credit Suisse Storage Update, September 3, 2015 Changing workloads drive the need for flexible, economical server-based storage. WW DEPLOYED CAPACITY (TB) 2010 2011 2012 2013 2014 2015 (est) 2016 (est) Source: IDC 0% 60% 20% 40% 80% 100 % Internal CapacityExternal Capacity
  • 9.
    STORAGE ORCHESTRATION Storage orchestrationis the ability to provision, grow, shrink, and decommission storage resources on-demand and programmatically, providing increased control and integration of storage into a software-defined data center. WEB CONSOLE A browser interface designed for managing distributed storage API A full API for automation and integration with outside systems COMMAND LINE A robust, scriptable command-line interface for expert operators PROVISION INSTALL CONFIGURE TUNE MONITOR Full lifecycle management for distributed, software-defined data services
  • 10.
    A RISING TIDE “By2020, between 70-80% of unstructured data will be held on lower-cost storage managed by SDS” “By 2019, 70% of existing storage array products will also be available as software only versions” Innovation Insight: Separating Hype From Hope for Software-Defined Storage Innovation Insight: Separating Hype From Hope for Software-Defined Storage 2013 2014 2015 2016 2017 2018 2019 $1,349M $1,195 M $1,029M $859M $706M $592M SDS-P MARKET SIZE BY SEGMENT $457M Block Storage File Storage Object Storage Hyperconverged Source: IDC Software-Defined Storage is leading a shift in the global storage industry, with far-reaching effects.
  • 11.
    THE BALANCE Inflexible Expensive atlarge scale Durable Convenient Flexible Economical at large scale Durable Powerful Appliances are suitable for small- scale, workloads, but they do not scale economically. Software-defined storage has a learning curve, but bring performance and economy at petabyte scale.
  • 12.
    THE ROBUSTNESS OFSOFTWARE Software is more flexible than hardware Software can do things hardware appliances can’t. SDS brings the flexibility of software to the enterprise storage world. • Can be deployed on bare metal, inside containers, inside VMs, or in the public cloud. • Can deploy on a single server, or thousands, and can be upgraded and reconfigured on the fly. • Grows and shrinks programmatically to meet changing demands
  • 13.
    BUILDING ON PROVENHARDWARE Hardware is hard, and we got you covered Tested software defined storage solutions, for repeatable success. • Ceph Hardware Configuration Guide • Ceph Hardware Selection Guide • Ceph Performance and Sizing Guide - Supermicro • Ceph Performance and Sizing Guide - Quanta QCT
  • 14.
    OPTIMIZATION CRITERIA IOPS Optimized Throughput Optimized Capacity Optimized • Lowestcost per IO • Highest IOPS • Meet minimum fault domain requirement • Lowest cost per unit of throughput • Highest throughput • Highest throughput per watt/BTU • Meet minimum fault domain requirement • Lowest cost per TB • Lowest watt/BTU per TB • Meet minimum fault domain requirement • Typically block storage • Replication • MySQL for OpenStack tenants • Block and object storage • Replication or erasure coded • Active performance storage for video, audio, and images • Streaming media • Typically object storage • Erasure coding dominant • Media archives • Data lake
  • 17.
    • Shared, elasticstorage pool • Dynamic DB placement • Flexible volume resizing • Live instance migration • Backup to object pool • Read replicas via copy-on-write snapshots MySQL ON CEPH STORAGE CLOUD OPS EFFICIENCY
  • 18.
    MYSQL-ON-CEPH PRIVATE CLOUD FIDELITYTO A MYSQL-ON-AWS EXPERIENCE • Hybrid cloud requires public/private cloud commonalities • Developers want DevOps consistency • Elastic block storage, Ceph RBD vs. AWS EBS • Elastic object storage, Ceph RGW vs. AWS S3 • Users want deterministic performance
  • 19.
  • 20.
    HEAD-TO-HEAD LAB TEST ENVIRONMENTS •EC2 r3.2xlarge and m4.4xlarge • EBS Provisioned IOPS and GPSSD • Percona Server • Supermicro servers • Red Hat Ceph Storage RBD • Percona Server
  • 21.
    OSD Storage ServerSystems 5x SuperStorage SSG-6028R-OSDXXX Dual Intel Xeon E5-2650v3 (10x core) 32GB SDRAM DDR3 2x 80GB boot drives 4x 800GB Intel DC P3700 (hot-swap U.2 NVMe) 1x dual port 10GbE network adaptors AOC-STGN-i2S 8x Seagate 6TB 7200 RPM SAS (unused in this lab) Mellanox 40GbE network adaptor(unused in this lab) MySQL Client Systems 12x Super Server 2UTwin2 nodes Dual Intel Xeon E5-2670v2 (cpuset limited to 8 or 16 vCPUs) 64GB SDRAM DDR3 Storage Server Software: Red Hat Ceph Storage 1.3.2 Red Hat Enterprise Linux 7.2 Percona Server 5x OSD Nodes 12x Client Nodes Shared10GSFP+Networking Monitor Nodes SUPERMICRO CEPH LAB ENVIRONMENT
  • 22.
  • 23.
    7996 67144 40031 1680 5677 1258 20053 4752 0 10000 20000 30000 40000 50000 60000 70000 80000 P-IOPS m4.4xl Ceph cluster 1x "m4.4xl" (14%capacity) Ceph cluster 6x "m4.4xl" (87% capacity) 100% Read 100% write 70/30 RW SYSBENCH REQUESTS PER MYSQL INSTANCE
  • 24.
    CONVERTING SYSBENCH REQUESTSTO IOPS READ PATH X% FROM INNODB BUFFER POOL IOPS = (READ REQUESTS – X%) SYSBENCH READ
  • 25.
    CONVERTING SYSBENCH REQUESTSTO IOPS WRITE PATH SYSBENCH WRITE 1X READ X% FROM INNODB BUFFER POOL IOPS = (READ REQ – X%) LOG, DOUBLE WRITE BUFFER IOPS = (WRITE REQ * 2.3) 1X WRITE
  • 26.
  • 27.
    IOPS/GB PER MYSQLINSTANCE 30 252 150 26 78 19 0 50 100 150 200 250 300 P-IOPS m4.4xl Ceph cluster 1x "m4.4xl" (14% capacity) Ceph cluster 6x "m4.4xl" (87% capacity) MySQL IOPS/GB Reads MySQL IOPS/GB Writes
  • 28.
    FOCUSING ON WRITEIOPS/GB AWS THROTTLE WATERMARK FOR DETERMINISTIC PERFORMANCE 26 78 19 0 10 20 30 40 50 60 70 80 90 P-IOPS m4.4xl Ceph cluster 1x "m4.4xl" (14% capacity) Ceph cluster 6x "m4.4xl" (87% capacity)
  • 29.
    A NOTE ONWRITE AMPLIFICATION MYSQL ON CEPH – WRITE PATH INNODB DOUBLE WRITE BUFFER CEPH REPLICATION OSD JOURNALING MYSQL INSERT X2 X2 X2
  • 30.
    EFFECT OF CEPHCLUSTER LOADING ON IOPS/GB 78 37 25 19 134 72 37 36 0 20 40 60 80 100 120 140 160 Ceph cluster (14% capacity) Ceph cluster (36% capacity) Ceph cluster (72% capacity) Ceph cluster (87% capacity) IOPS/GB 100% Write 70/30 RW
  • 31.
    18 18 19 6 34 34 36 8 0 5 10 15 20 25 30 35 40 Ceph cluster 80cores 8 NVMe (87% capacity) Ceph cluster 40 cores 4 NVMe (87% capacity) Ceph cluster 80 cores 4 NVMe (87% capacity) Ceph cluster 80 cores 12 NVMe (84% capacity) IOPS/GB 100% Write 70/30 RW CONSIDERING CORE-TO-FLASH RATIO
  • 32.
    HEAD-TO-HEAD PERFORMANCE 30 IOPS/GB: AWSEBS P-IOPS TARGET 25 IOPS/GB: CEPH 72% CLUSTER CAPACITY (WRITES) 78 IOPS/GB: CEPH 14% CLUSTER CAPACITY (WRITES)
  • 34.
  • 35.
    IOPS/GB ON VARIOUSCONFIGS 31 18 18 78 - 10 20 30 40 50 60 70 80 90 IOPS/GB (SysbenchWrite) AWS EBS Provisioned-IOPS Ceph on Supermicro FatTwin 72% Capacity Ceph on Supermicro MicroCloud 87% Capacity Ceph on Supermicro MicroCloud 14% Capacity
  • 36.
    $/STORAGE-IOP ON THESAME CONFIGS $2.40 $0.80 $0.78 $1.06 $- $0.50 $1.00 $1.50 $2.00 $2.50 $3.00 Storage$/IOP (SysbenchWrite) AWS EBS Provisioned-IOPS Ceph on Supermicro FatTwin 72% Capacity Ceph on Supermicro MicroCloud 87% Capacity Ceph on Supermicro MicroCloud 14% Capacity
  • 37.
    HEAD-TO-HEAD PRICE/PERFORMANCE $2.50: TARGET AWSP-IOPS $/IOP (EBS ONLY) $0.78: CEPH ON SUPERMICRO MICRO CLOUD CLUSTER
  • 39.
    8x Nodes in3U chassis Model: SYS-5038MR-OSDXXXP Per Node Configuration: CPU: Single Intel Xeon E5-2630 v4 Memory: 32GB NVMe Storage: Single 800GB Intel P3700 Networking: 1x dual-port 10G SFP+ + + 1x CPU + 1x NVMe + 1x SFP SUPERMICRO MICRO CLOUD CEPH MYSQL PERFORMANCE SKU

Editor's Notes