The document summarizes a customer spotlight on the deployment of Ceph at Target, detailing the initial challenges faced with performance, reliability, and user perception after the October 2014 rollout. Acknowledging issues such as high latency and hardware limitations, the document emphasizes the importance of suitable hardware choices, rigorous monitoring, and effective communication in overcoming these obstacles. The current state shows significant improvements with upgraded hardware and user feedback, alongside plans for future enhancements and broader application of Ceph solutions.


![require 'rubygems'
require 'dogapi'
api_key = “XXXXXXXXXXXXXXXXXXXXXXXX"
dosd = `ceph osd tree | grep down | wc -l`
host = `hostname`
if host.include?("ttb")
envname = "dev"
elsif host.include?("ttc")
envname = "prod-ttc"
else
envname = "prod-tte”
end
dog = Dogapi::Client.new(api_key)
dog.emit_point("ceph.osd_down", dosd, :tags => ["env:#{envname}","app:ceph"])
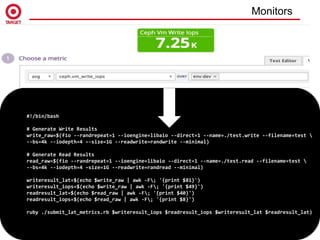
Monitors](https://image.slidesharecdn.com/targetstorageday-160418151357/85/Ceph-Deployment-at-Target-Customer-Spotlight-14-320.jpg)
![Tune to your workload!
• This is unique to your specific workloads
But… in general.....
Neuter the default recovery priority
[osd]
osd_max_backfills = 1
osd_recovery_priority = 1
osd_client_op_priority = 63
osd_recovery_max_active = 1
osd_recovery_max_single_start = 1
Limit the impact of deep scrubing
osd_scrub_max_interval = 1209600
osd_scrub_min_interval = 604800
osd_scrub_sleep = .05
osd_snap_trim_sleep = .05
osd_scrub_chunk_max = 5
osd_scrub_chunk_min = 1
osd_deep_scrub_stride = 1048576
osd_deep_scrub_interval = 2592000
Tuning](https://image.slidesharecdn.com/targetstorageday-160418151357/85/Ceph-Deployment-at-Target-Customer-Spotlight-16-320.jpg)


![Getting Started with Apache Spark: Big Data Made Simple [Free Meetup]](https://cdn.slidesharecdn.com/ss_thumbnails/apachesparkgettingstarted-260203175547-8361bcc3-thumbnail.jpg?width=640&height=640&fit=bounds)


