Downloaded 72 times

![• Problem
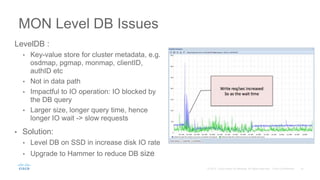
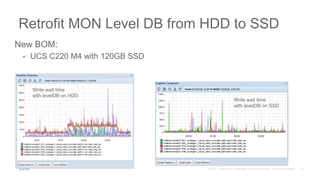
• Election Storm & LevelDB inflation
• Solutions
• Upgrade to 1.2.3 to fix election storm
• Upgrade to 1.3.2 to fix levelDB inflation
• Configuration change
Hardening MON Cluster with Hammer and
Tuning
[mon]
mon_lease = 20 (default = 5)
mon_lease_renew_interval = 12 (default 3)
mon_lease_ack_timeout = 40 (default 10)
mon_accept_timeout = 40 (default 10)
[client]
mon_client_hunt_interval = 40 (defaiult 3)](https://image.slidesharecdn.com/rh-storage-seattle-10-18-2016-161018230557/85/Red-Hat-Storage-Day-Seattle-Stabilizing-Petabyte-Ceph-Cluster-in-OpenStack-Cloud-17-320.jpg)


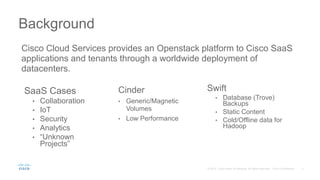
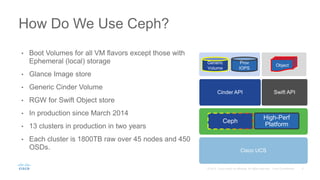
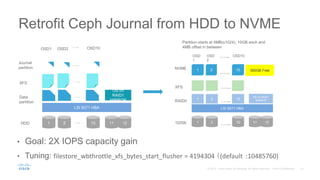
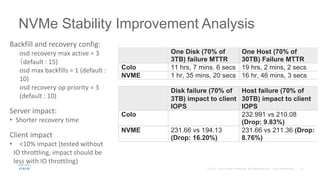
Cisco uses Ceph for storage in its OpenStack cloud platform. The initial Ceph cluster design used HDDs which caused stability issues as the cluster grew to petabytes in size. Improvements included throttling client IO, upgrading Ceph versions, moving MON metadata to SSDs, and retrofitting journals to NVMe SSDs. These steps stabilized performance and reduced recovery times. Lessons included having clear stability goals and automating testing to prevent technical debt from shortcuts.