Download as PDF, PPTX


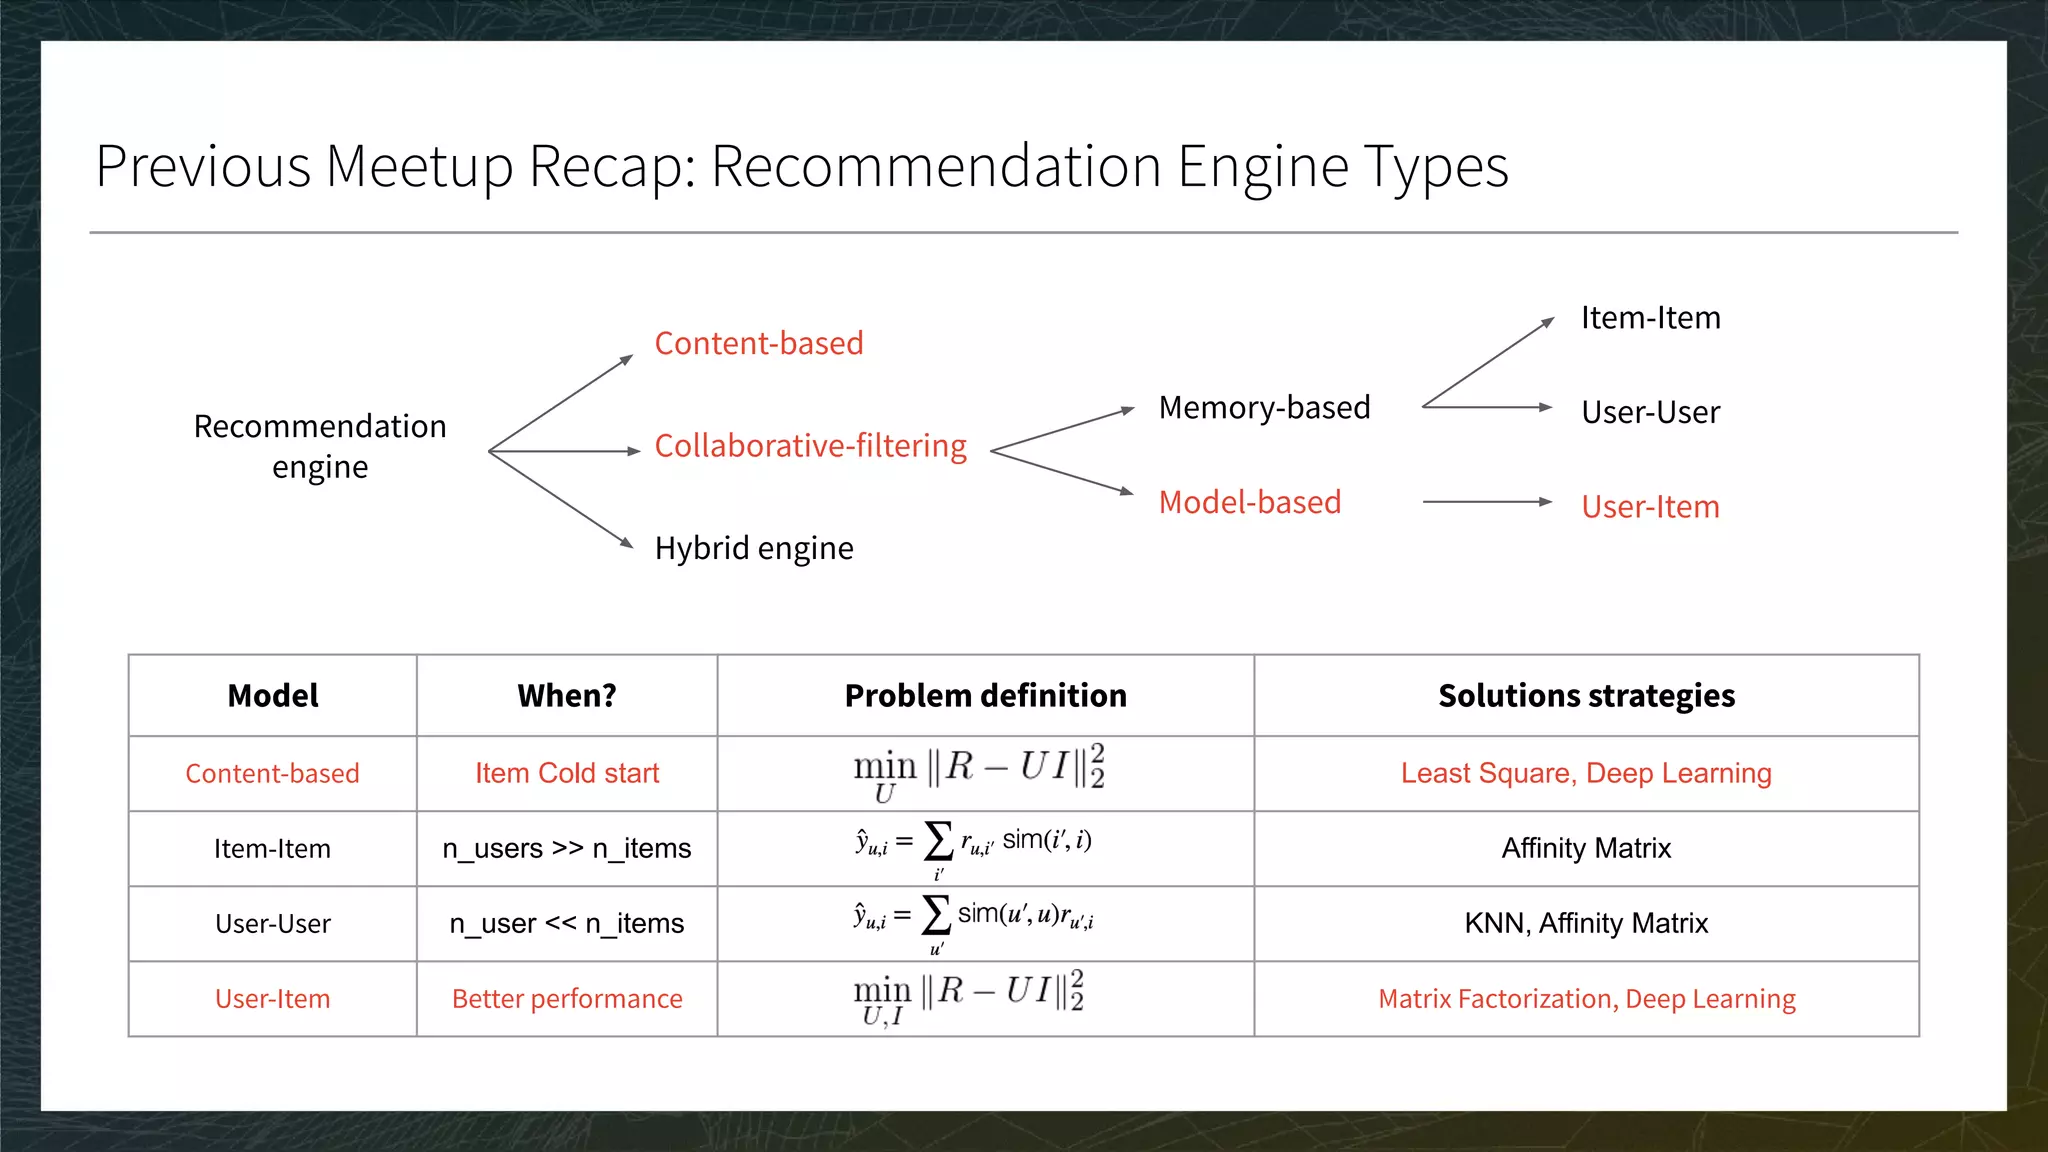


![Ranking 3/3
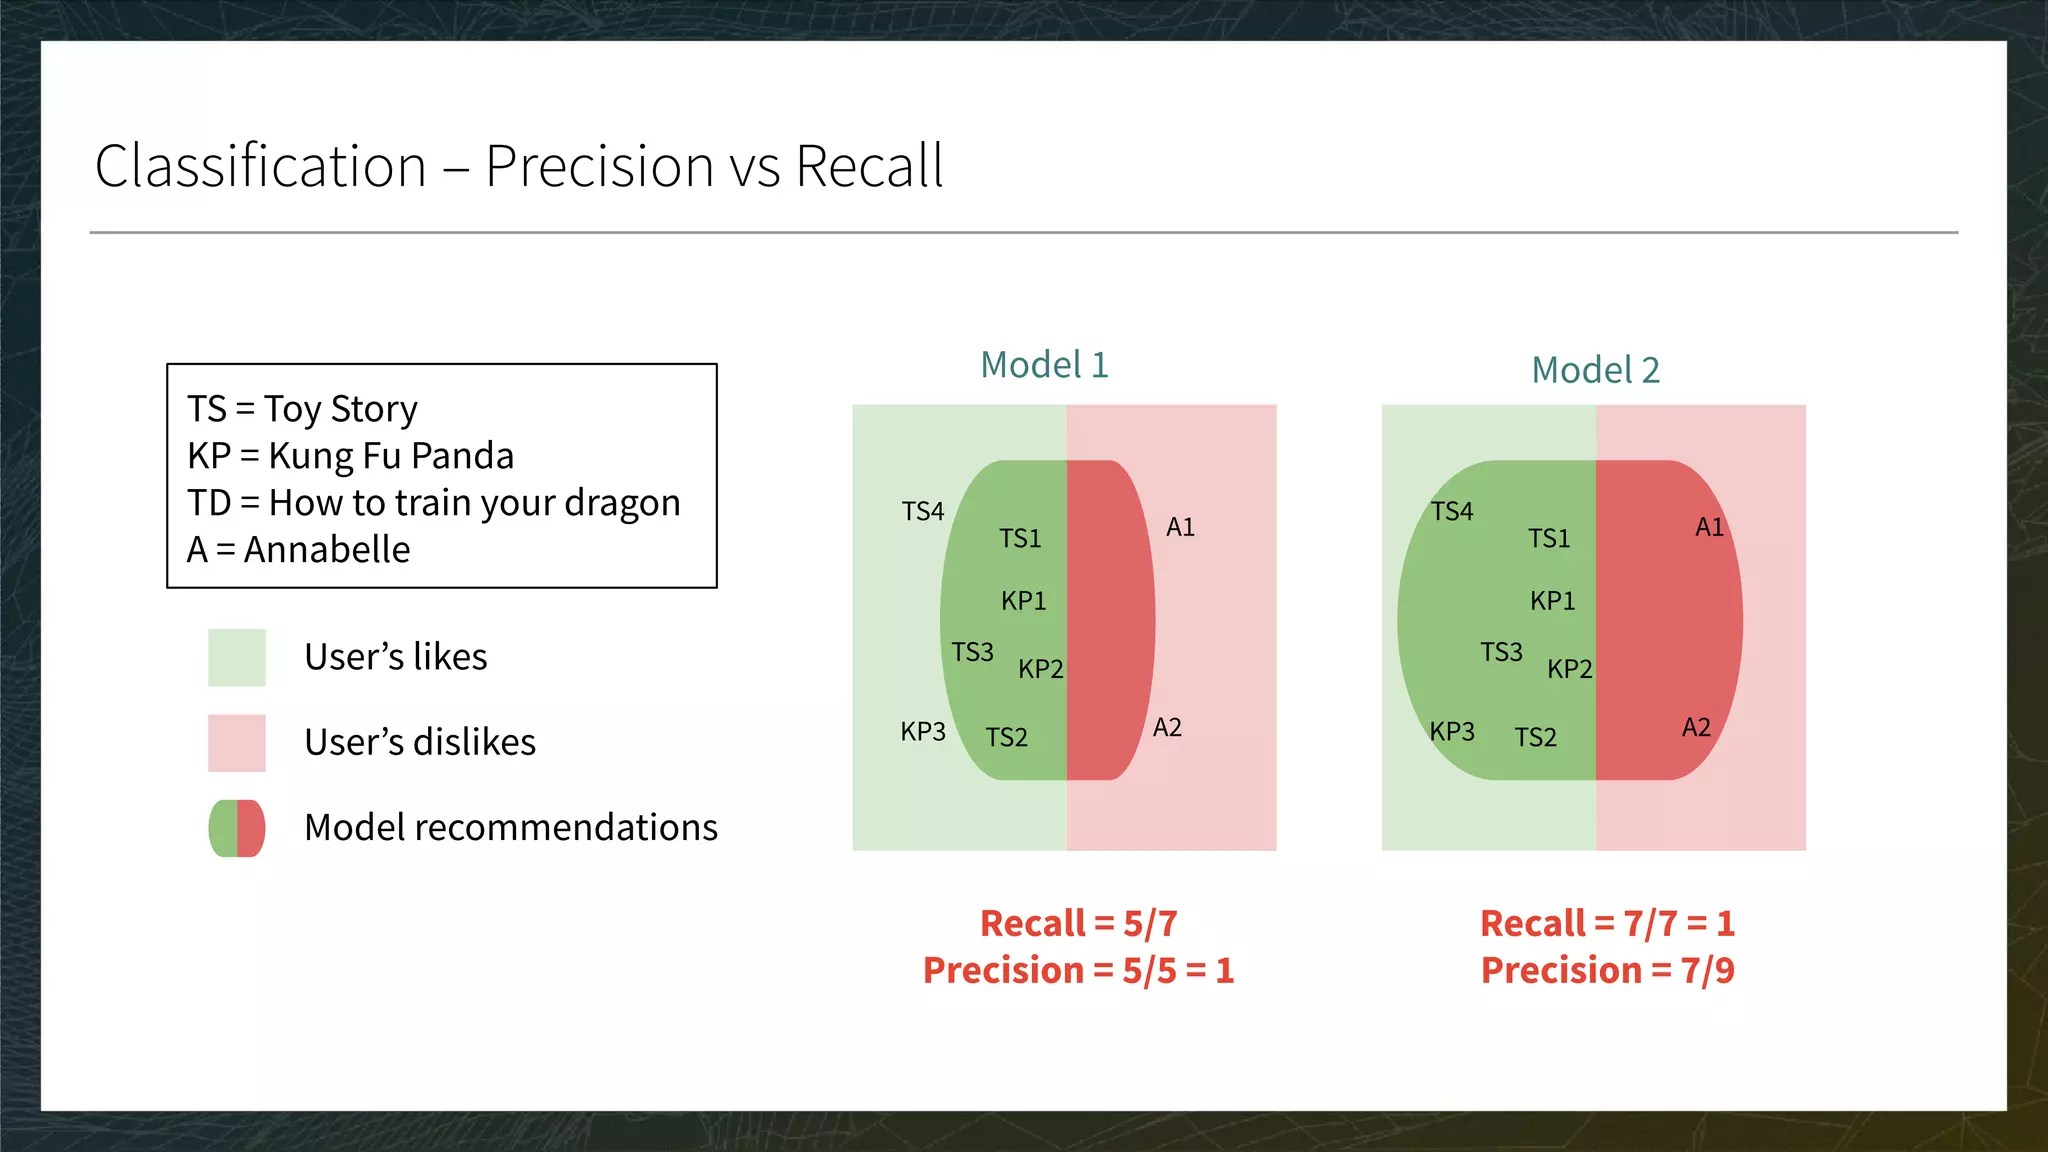
CG, DCG, and nDCG
● CG: Sum the true ratings of the Top K items predicted for each user
● DCG: Weight by position in Top K; nDCG: Normalize in [0, 1]
● A perfect score is 1 if the ranking of the prediction is the same as the ranking of the true ratings
● The bigger the score the better
Movie
Toy Story 1 1 0.9
Toy Story 2 0.9 0.7
Kung Fu Panda 1 0.7 0.1
Kung Fu Panda 2 0.6 -0.1
Annabelle 1 -0.2 0.4
K = 3
TOP K = ?
CG = ?
DCG = ?](https://image.slidesharecdn.com/3-modelevaluation-191029174133/75/Recommender-Systems-from-A-to-Z-Model-Evaluation-41-2048.jpg)
![Ranking 3/3
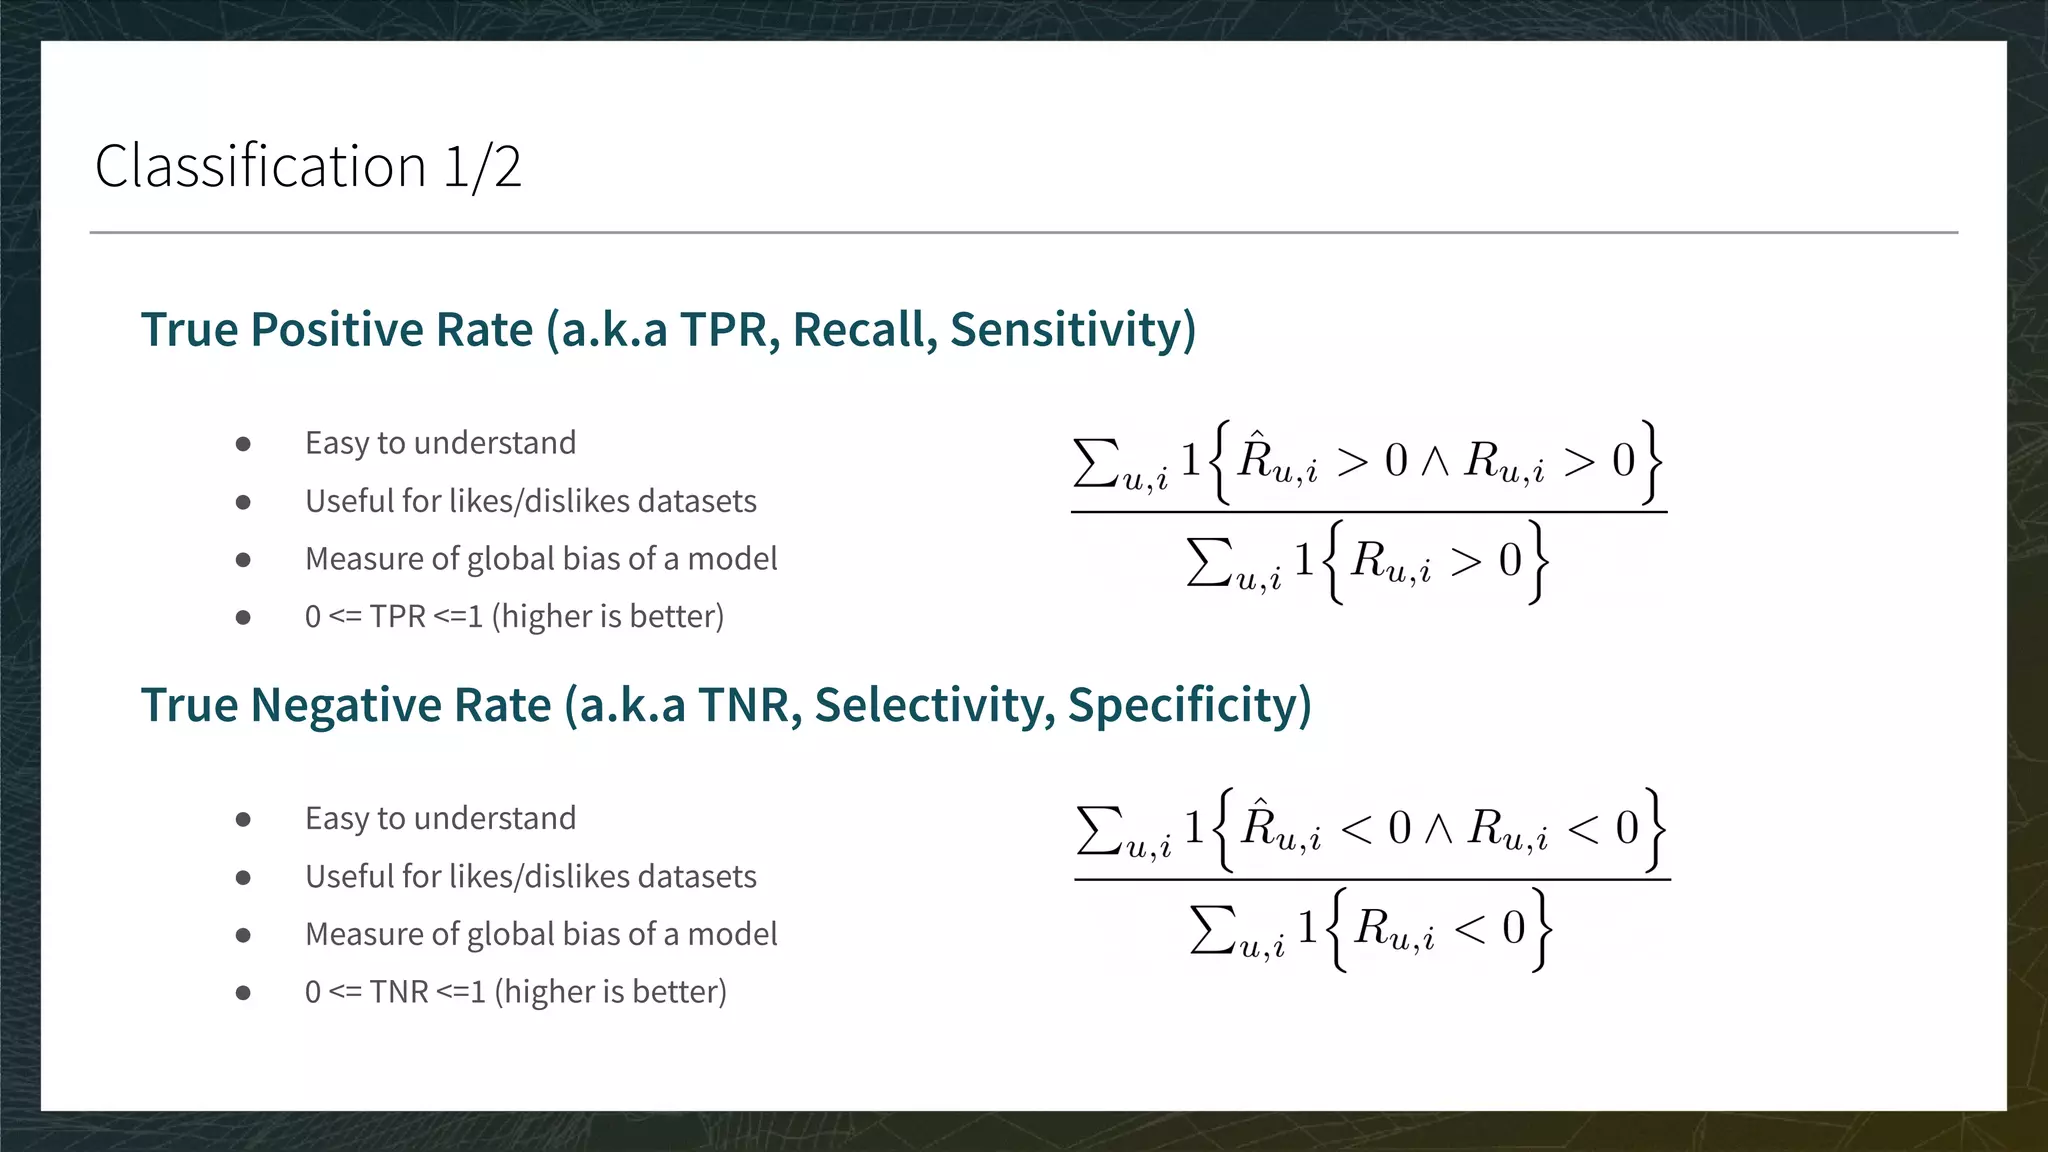
CG, DCG, and nDCG
● CG: Sum the true ratings of the Top K items predicted for each user
● DCG: Weight by position in Top K; nDCG: Normalize in [0, 1]
● A perfect nDCG is 1 if the ranking of the prediction is the same as the ranking of the true ratings
● The bigger the score the better
Movie
Toy Story 1 1 0.9
Toy Story 2 0.9 0.7
Kung Fu Panda 1 0.7 0.1
Kung Fu Panda 2 0.6 -0.1
Annabelle 1 -0.2 0.4
K = 3
TOP K = {TS1, TS2, A1}
CG = 1.0 + 0.9 - 0.2
DCG = 1/1 + 0.9/2 - 0.2/3
top 1
top 2
top 3](https://image.slidesharecdn.com/3-modelevaluation-191029174133/75/Recommender-Systems-from-A-to-Z-Model-Evaluation-42-2048.jpg)
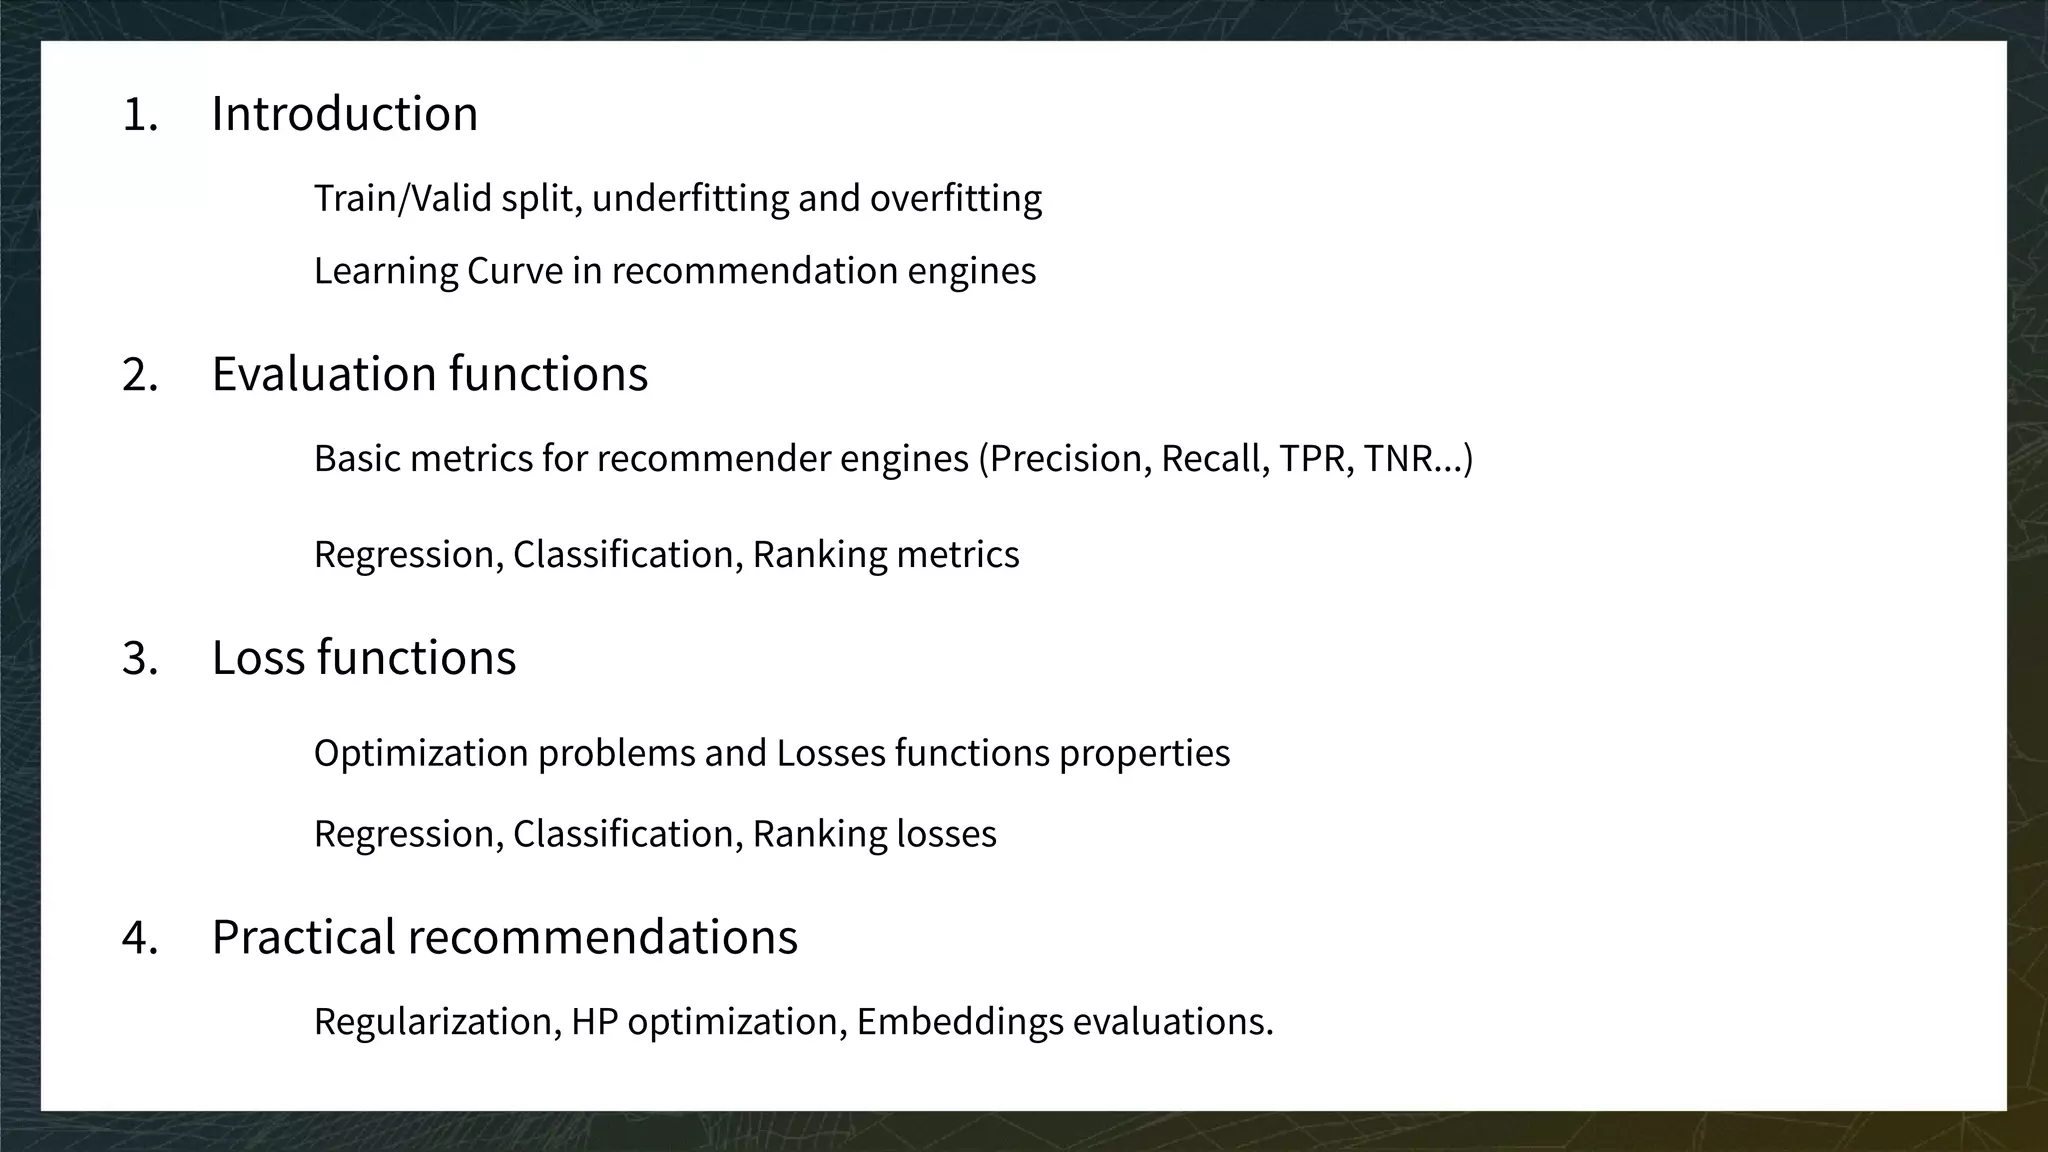
![Ranking 3/3
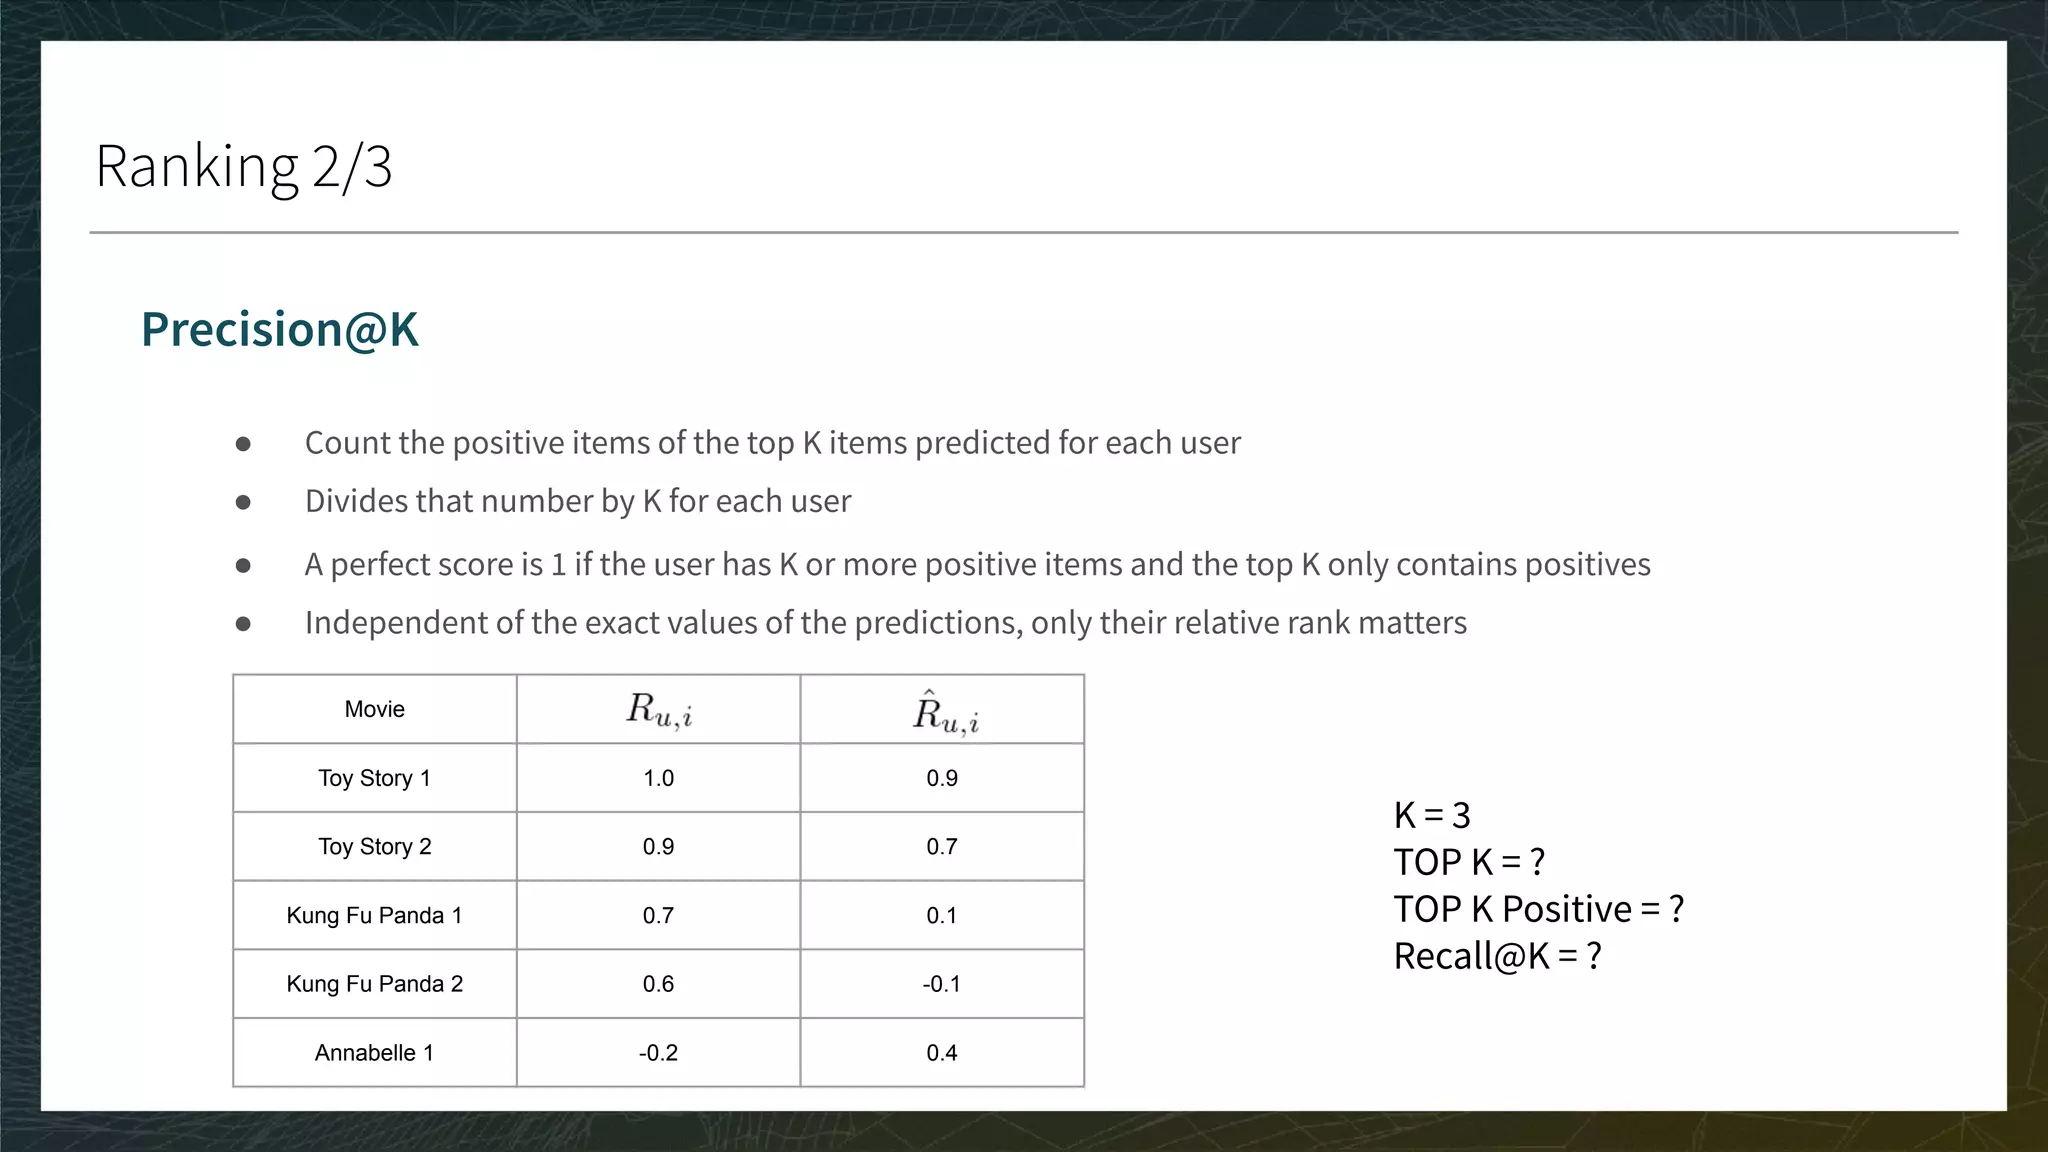
CG, DCG, and nDCG
● CG: Sum the true ratings of the Top K items predicted for each user
● DCG: Weight by position in Top K; nDCG: Normalize in [0, 1]
● A perfect nDCG is 1 if the ranking of the prediction is the same as the ranking of the true ratings](https://image.slidesharecdn.com/3-modelevaluation-191029174133/75/Recommender-Systems-from-A-to-Z-Model-Evaluation-43-2048.jpg)


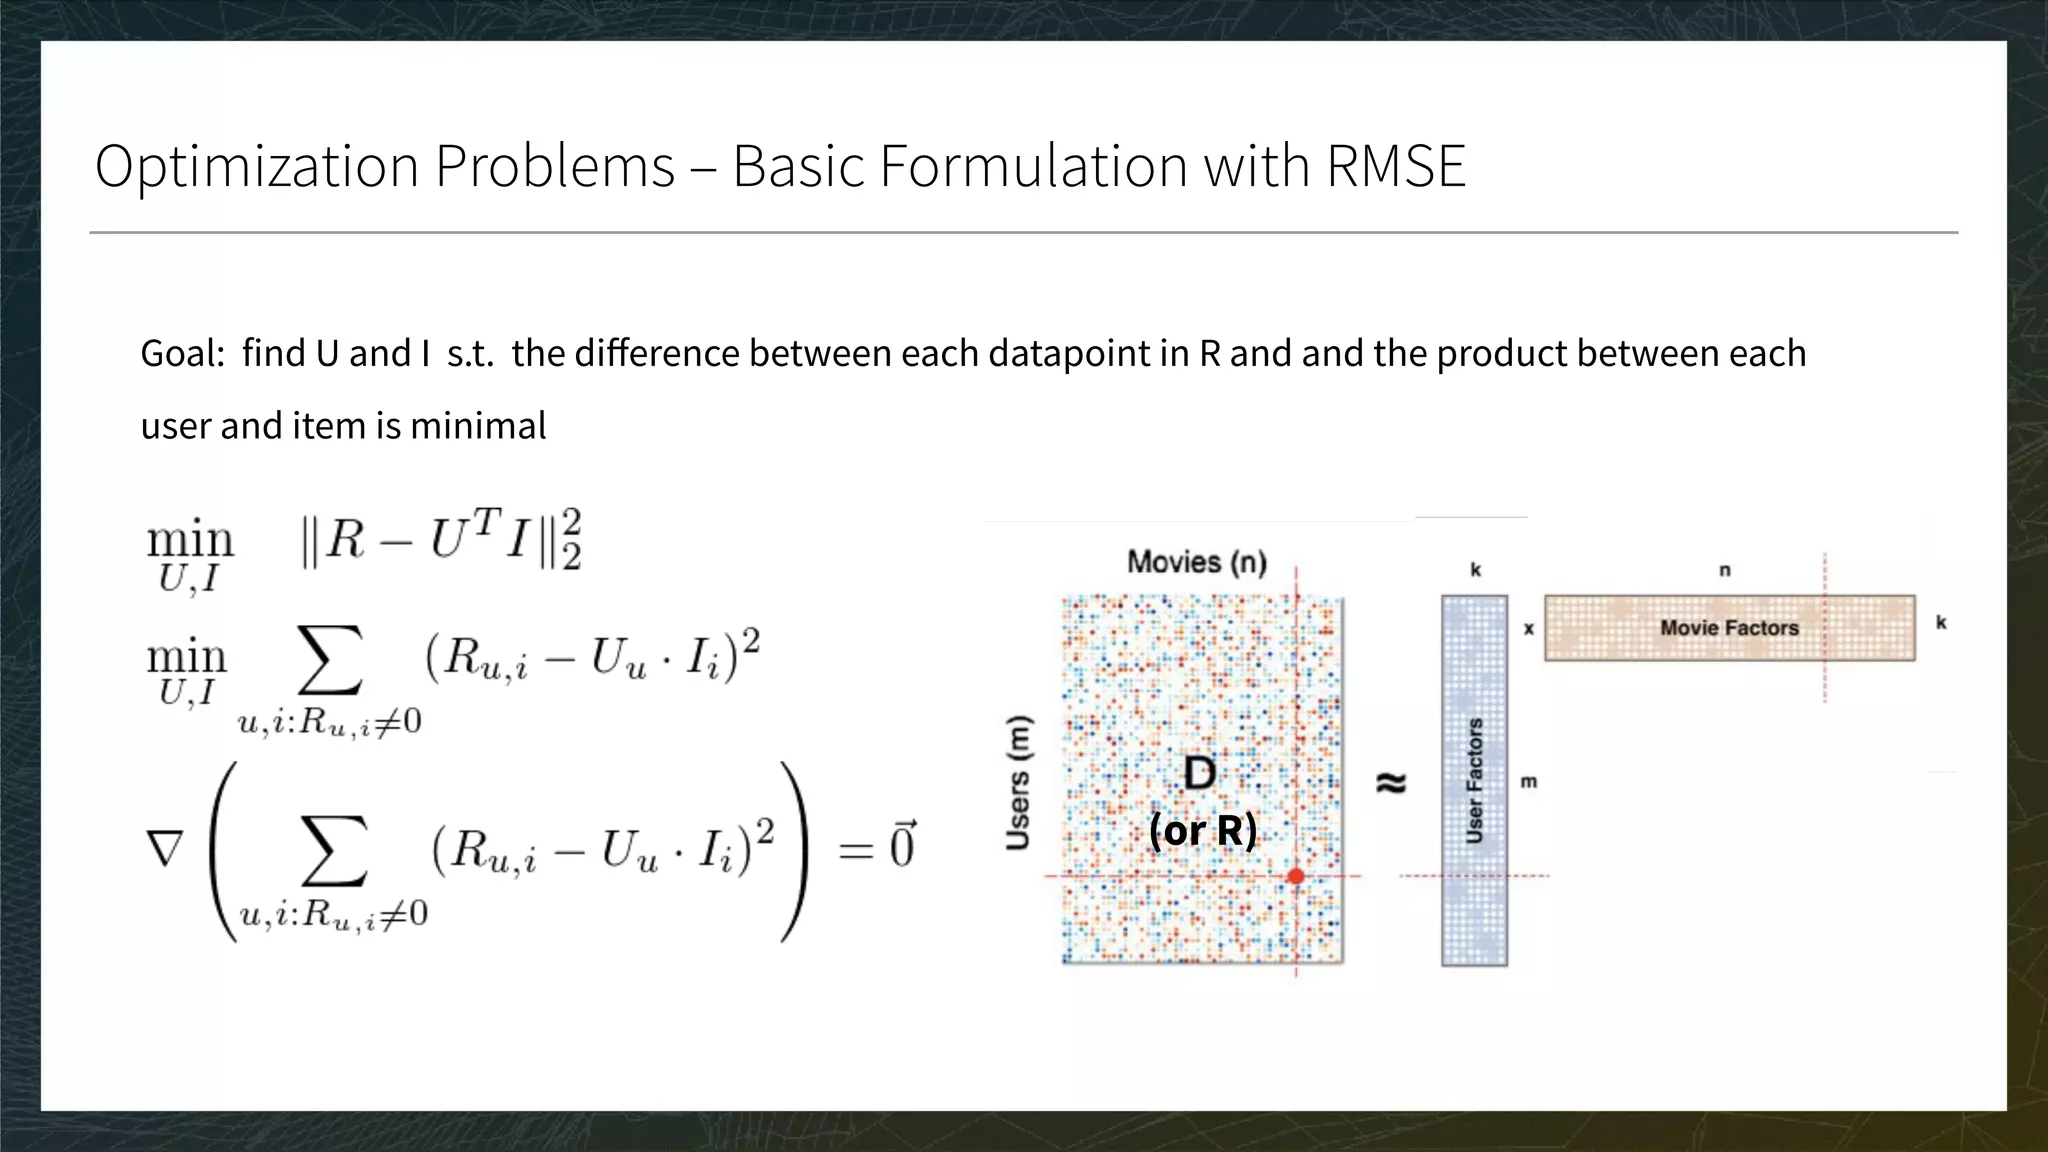


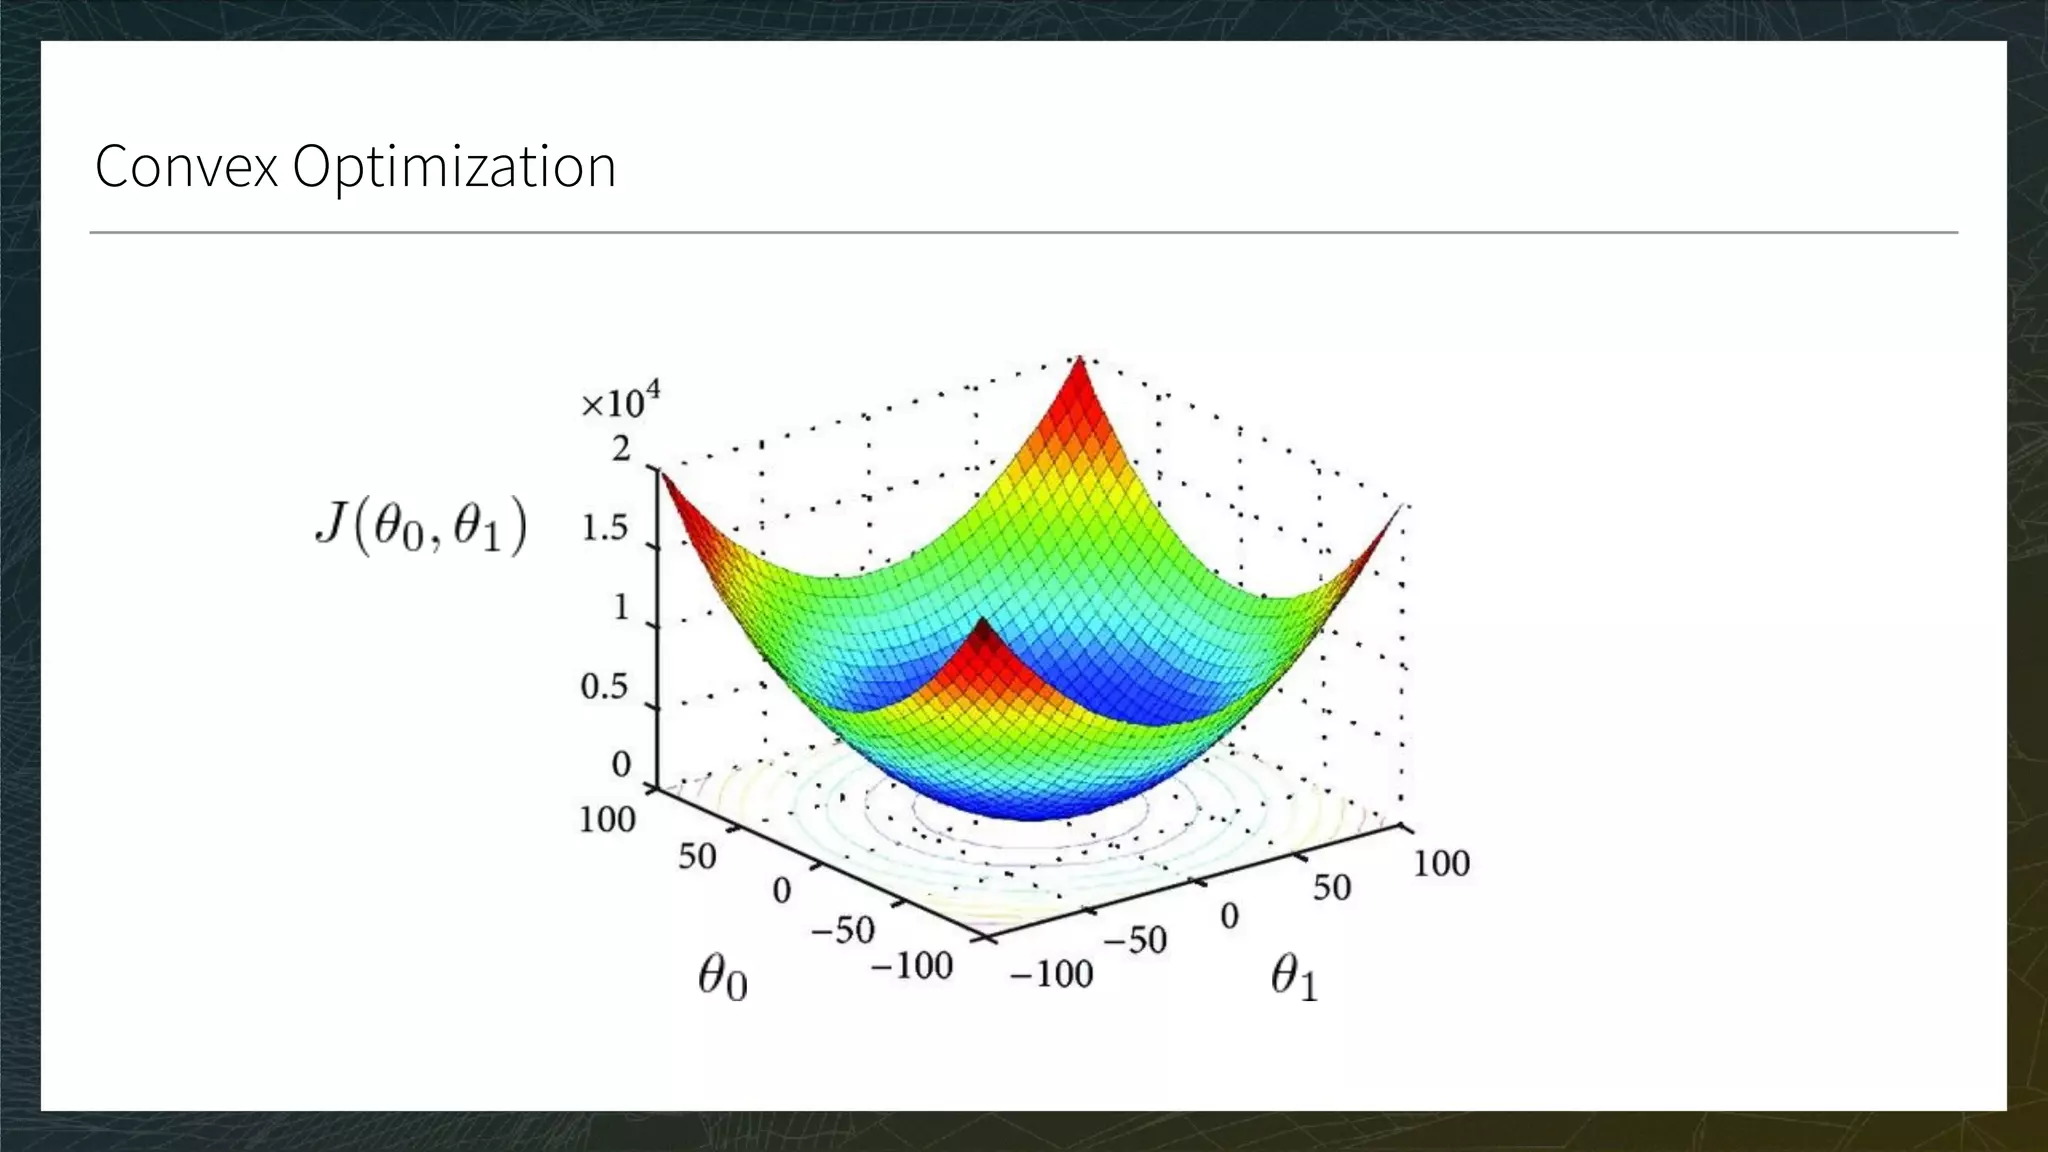

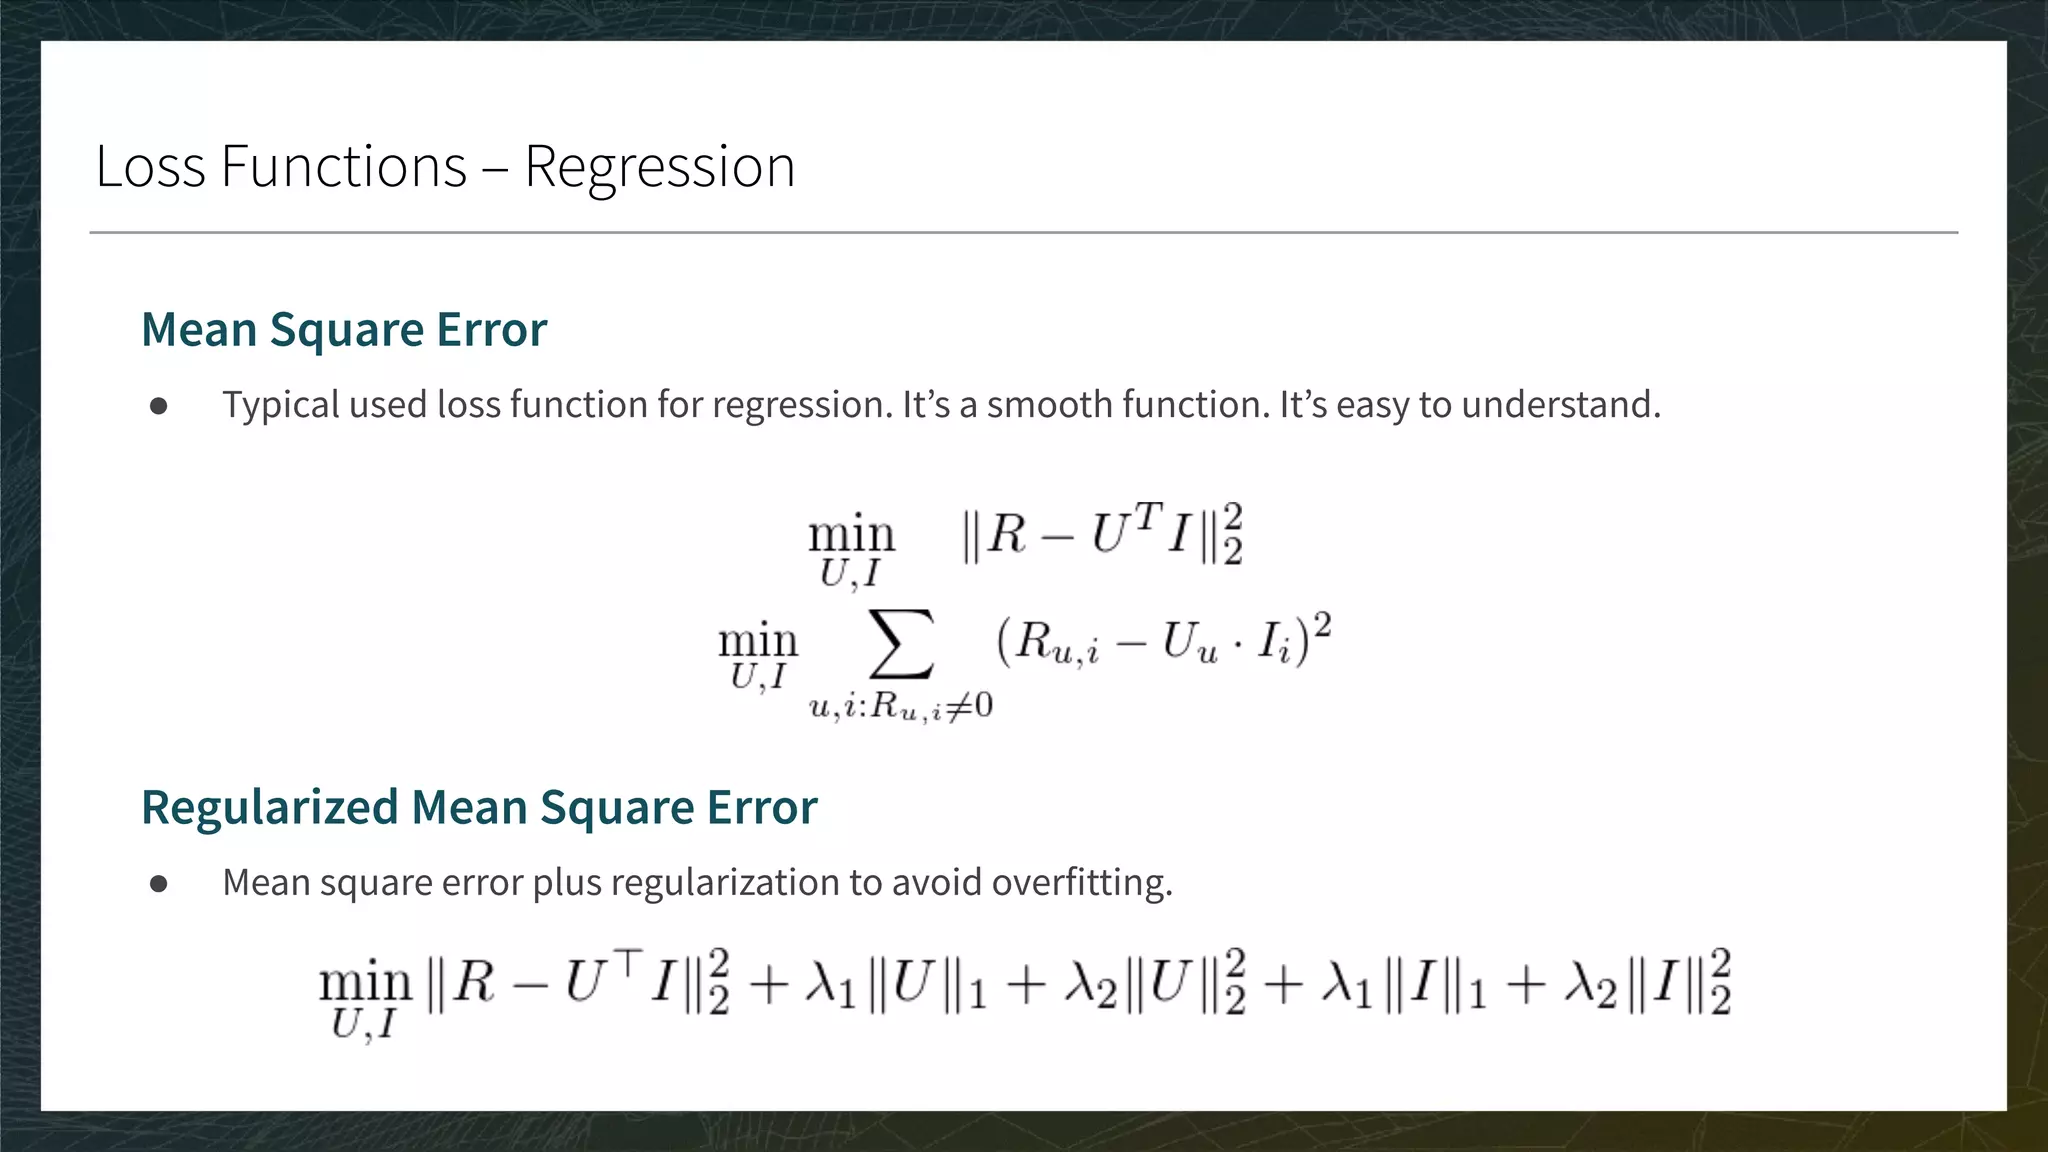


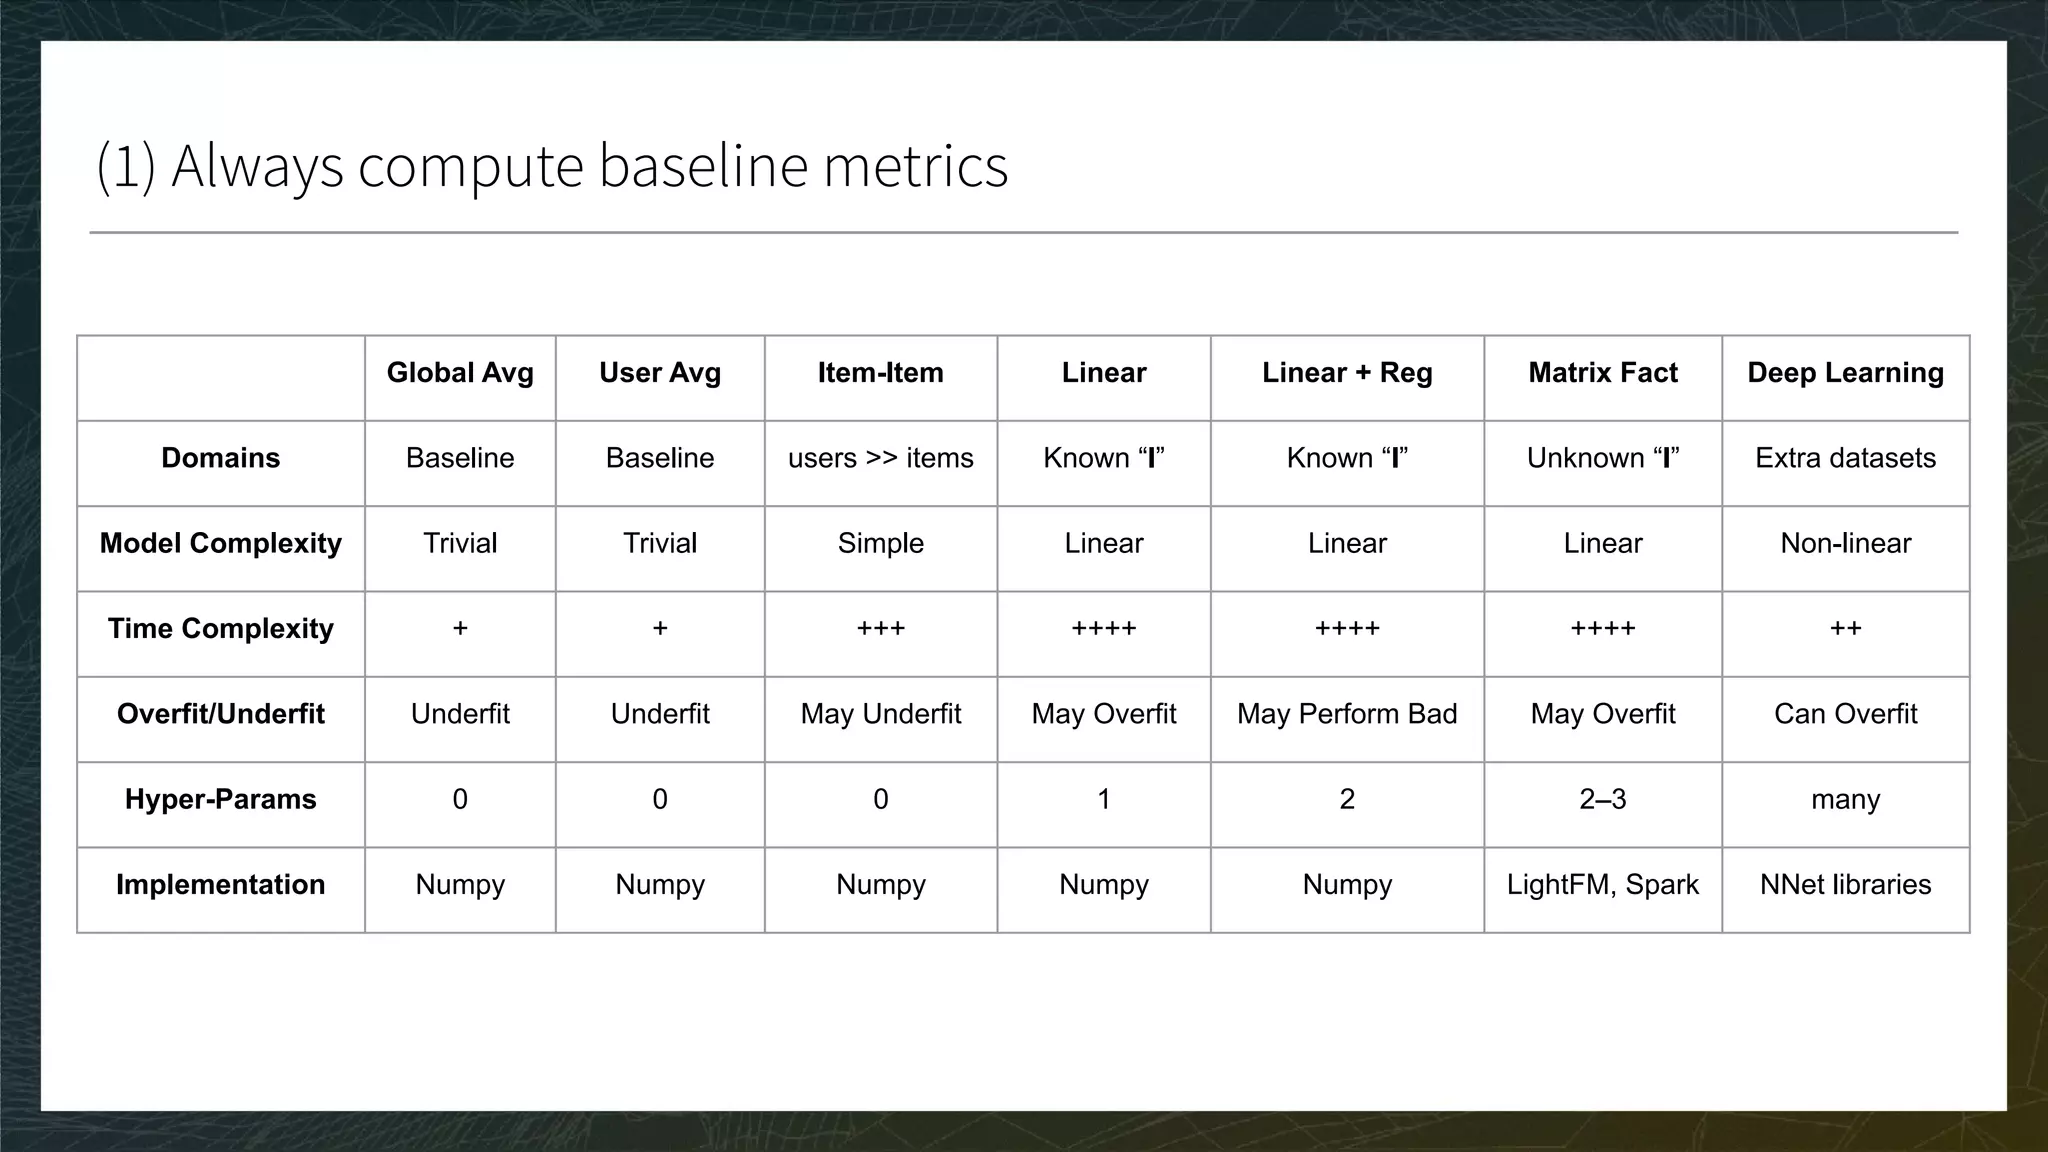


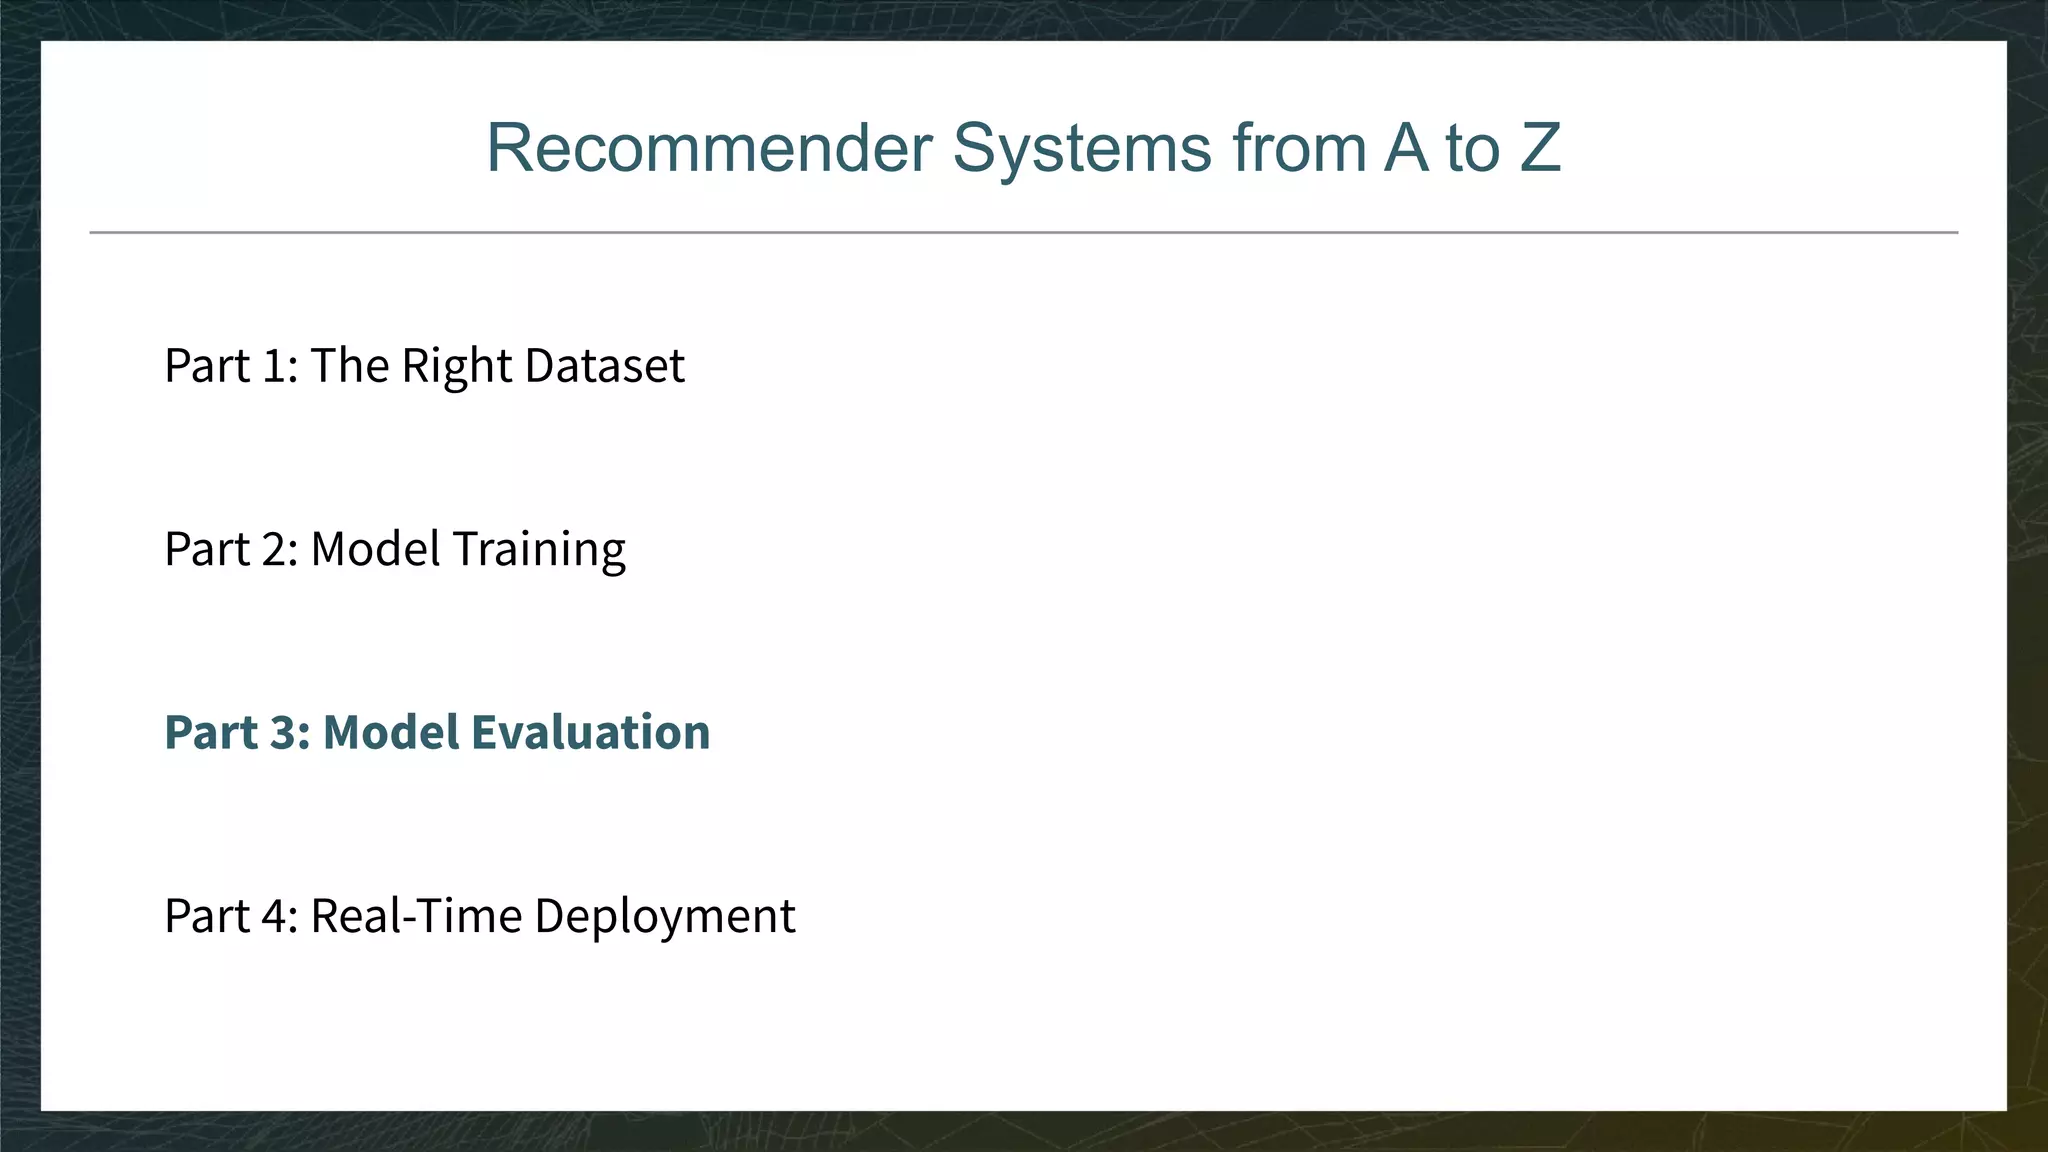
The document outlines the process of building recommender systems, covering key areas such as dataset selection, model training, evaluation metrics, and deployment. It details various loss functions and optimization strategies, alongside practical recommendations for addressing overfitting and hyperparameter optimization. Additionally, it emphasizes the importance of user feedback and comparing different model performances using multiple metrics.