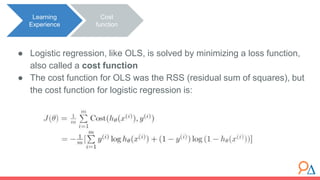
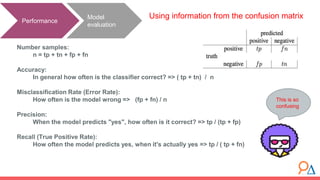
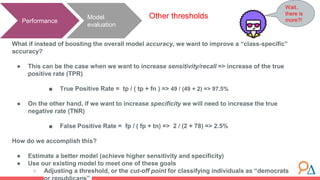
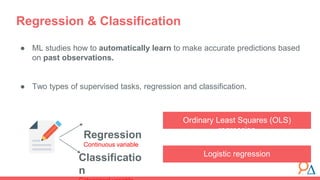
Logistic regression is a machine learning classification algorithm used to predict the probability of a categorical dependent variable given one or more independent variables. It uses a logit link function to transform the probability values into odds ratios between 0 and infinity. The model is trained by minimizing a cost function called logistic loss using gradient descent optimization. Model performance is evaluated using metrics like accuracy, precision, recall, and the confusion matrix, and can be optimized by adjusting the probability threshold for classifications.


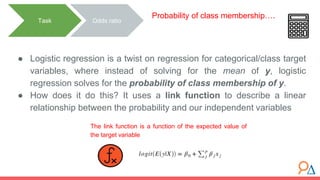
![● There is a problem with this new equation: we want to estimate a
probability instead of a real number.
○ We need y to fall in the range [-infinity, infinity] for the regression to be
valid!
● Here is where the logit “link function” comes to our rescue!!
Task
Dilemma
using OLS
y to fall in the range [ -infinity, infinity ]
Estimate the probability instead of a real
number!!!](https://image.slidesharecdn.com/lecture3-231022053031-ecc5f722/85/Lecture-3-1_-Logistic-Regression-pptx-13-320.jpg)


![● If we put the odds ratio in place of the probability in the regression
equation, the range of odds ratio, our predicted value, is now
restricted to be in the range [0, infinity]
● And graphically will look like this:
Task Odds ratio
….. hmm something is missing ….
Modify regression equation…](https://image.slidesharecdn.com/lecture3-231022053031-ecc5f722/85/Lecture-3-1_-Logistic-Regression-pptx-17-320.jpg)