This document discusses recommendation systems and provides examples of different types of recommendation approaches. It introduces collaborative filtering and content-based filtering as the main recommendation techniques. For collaborative filtering, it provides an example of item-based collaborative filtering using the R programming language on a Last.fm music dataset. Content-based filtering recommends items based on their properties and features. Hybrid systems combine collaborative and content-based filtering to generate recommendations.


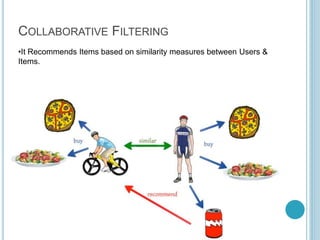


![The data set contains information about users and
which song they have listened to on Last.FM.
# Read data from Last.FM frequency matrix
data<-read.csv(file.choose())
head(data[,c(1,3:8)])
#drop Column user
data.content <- (data[,!(names(data) %in% c("user"))])
R CODE FOR ITEM BASED COLLABORATIVE
FILTERING](https://image.slidesharecdn.com/recommendationsystemppt-200904115731/85/Recommendation-System-15-320.jpg)

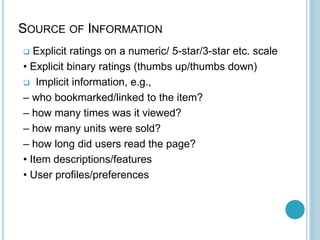
![Head(data.content.similarity)
will now put similarities between items
Lets fill in those empty spaces with cosine similarities
Loop through the columns
for(i in 1:ncol(data.content)) {
# Loop through the columns for each column
for(j in 1:ncol(data.content)) {
# Fill in placeholder with cosine similarities
data.content.similarity[i,j] <-
getCosine(as.matrix(data.content[i]),as.matrix(data.content[j]))
}
}
data.content.similarity <- as.data.frame(data.content.similarity)](https://image.slidesharecdn.com/recommendationsystemppt-200904115731/85/Recommendation-System-17-320.jpg)
![# Get the top 10 neighbours for each and convert data frame to matrix form
data.content.neighbours matrix(NA,
nrow=ncol(data.content.similarity),ncol=11,
dimnames=list(colnames(data.content.similarity)))
#Then we need to find the neighbours. This is another loop but runs much
faster
for(i in 1:ncol(data.content))
{
data.content.neighbours[i,]
(t(head(n=11,rownames(data.content.similarity[order
(data.content.similarity[,i],decreasing=TRUE),][i]))))
}
we use t() to rotate the similarity matrix since the neighbour one is shaped
differently](https://image.slidesharecdn.com/recommendationsystemppt-200904115731/85/Recommendation-System-18-320.jpg)


![[Final]collaborative filtering and recommender systems](https://cdn.slidesharecdn.com/ss_thumbnails/finalcollaborativefilteringandrecommendersystems-141103044224-conversion-gate01-thumbnail.jpg?width=640&height=640&fit=bounds)


![[系列活動] 人工智慧與機器學習在推薦系統上的應用](https://cdn.slidesharecdn.com/ss_thumbnails/merged-161217165734-thumbnail.jpg?width=640&height=640&fit=bounds)


