This document describes the development of a geographic application called @SCHOOL to provide information on preschool and primary school locations in Flanders, Belgium. The application combines open source programs Google Docs and ESRI ArcGIS Online to allow centralized updating of school data and real-time access for users. It was first developed for preschools in Ghent and is now being expanded to include all primary schools in Flanders. The tool helps parents access relevant school details and identify the closest schools to any given address. Feedback from users in Ghent has been positive and local authorities are also finding it useful for education planning and policy support.
![2 BACKGROUND
2.1 Micro-planning
2.1.1 School mapping
In micro-planning, cooperation between citizens and organizations is constructed in order to assess,
prioritize and document the needs of the local community. This form of planning was initially designed
to be used in developing countries and is based on regular and intensive meetings. School mapping
(SM) is a normative approach to micro-planning school locations. Additionally, SM is also used to
examine the equitability of resource distribution in and between schools and guaranty the efficiency
after large-scale redevelopment of the schooling system [1]. SM consists of the use of different forms
of technical data in order to influence the physical and social context of the analysis [2].
2.1.2 The local and decentralized level
Because SM is defined as a form of micro-planning, it is expected to work on the subnational or
decentralized level. In the application of SM-processes it is desirable that decentralized actors and
organizations cooperate with centralized decision supporting services and work with centralized data.
This interaction between decentralized and centralized units should lead to a creative cooperation
while maintaining responsibilities on all levels. If difficulties occur in preserving power relations on both
levels, the negative result will mainly affect the decentralized level. This leads to one of the most
frequent functional challenges of SM as a micro level process: decentralized actors seem to have an
inevitable dependency towards the centralized policies, services or resources. Therefore, important
decision making processes are mainly made on the centralized level instead of on the local,
decentralized level, leading to discontinuities and eventually explicit local inequalities [2]. As a result,
school mapping should not be a one shot activity for data collection purposes only, but it should be an
ongoing process of analysis, assessment and action [3].
2.2 Geographic Information Systems
2.2.1 The use of Geographic Information Systems in educational planning
A GIS is an extremely efficient decision supporting tool for spatial analysis [4]. In comparison to other
disciplines, such as archaeology [5] or spatial planning [6], the use of GIS for policy and planning for
education is a fairly recent phenomenon. Important studies in this research area are carried out for the
International Institute for Educational Planning (IIEP) or the United Nations Educational, Scientific and
Cultural Organization (UNESCO), but they are limited [7,8]. Until now, a normative inclusion of GIS as
a consistent component of educational policy and micro-planning is not reached. A breakthrough in
the use of GIS is not expected, except when GIS can profile themselves as cost-efficient and easy to
use tools or when they are recognized as clearly superior techniques in comparison to the methods
that are now commonly used in planning. Yet, research in the usage of public participation GIS
(PPGIS) and further adaptation towards educational micro-planning is becoming more popular [2].
2.2.2 Centralized data management versus decentralized use
An important issue when applying GIS is found in the centralized-decentralized relation between data
and users. A lot of data needed for spatial analysis is centrally managed, while the GIS analyses are
mainly applied on the local and decentralized level. Making the data publicly available also leads to
discussion, especially in developing countries. The eventual success of a project depends on how
local governments deal with the results and in what way the data is held up-to-date [9]. New
developments in making data publicly available are an indicator for the growing importance of
decentralized structures and the increasing role central data providers play. Because of the growing
focus on networks and connectivity, it is possible to manage data centrally while making it available to
a large amount of users [10]. For example, the application of open source programs is an interesting
development in light of this discussion.
3 PHASES
In a preliminary stage, research of relevant literature as well as an exploration of the policies at hand
was required. Therefore, cooperation between the University of Ghent and the Department Data-](https://image.slidesharecdn.com/rapporttheuseofgeographicalapplicationsformicro-planningschoollocations-theschoolappforpreschoolsing-140514035957-phpapp01/75/Rapport-the-use-of-geographical-applications-for-micro-planning-school-locations-the-school-app-for-preschools-in-ghent-belgium-2-2048.jpg)
![Analysis & GIS of the city of Ghent was established. The research project itself consisted of two main
phases.
3.1.1 @SCHOOL for the city of Ghent
In the first phase, an application was created that allowed the users to retrieve relevant information for
all nursery schools in Ghent such as address, capacity, website, etc. In addition to its informational
purpose, a possibility of spatially analyzing the data was added. By marking the home location (or any
other location), the user can explore at what distances the surrounding schools are located based
upon their catchment area, thus pinpointing the school closest to the location (Fig. 1). This information
is crucial when taking into account the accessibility to preschools that citizens have, especially for low
income households with a reduced mobility [11]. For these school catchment areas, the network
distance was used, based upon the 100, 200, 500, 1000 and 2000 meter walking distance to school.
Figure 1: geographical application @SCHOOL; pop-up with information concerning the distance to a
certain school
For Ghent, the geographical application is available since June 2013 on the website for enrolment
(https://meldjeaan.gent.be/). As a result parents already had direct access to information concerning
the schools during the period of enrolment for the school year 2013-2014. Citizens could use the
application to determine the school that is located in the direct environment of for example the location
of employment or the location of pre- or after school day care. The primary goal in the development of
the geographical application was its user-friendly interface; the application had to be very easy to use,
intuitive and had to be accessible for poorly-educated parents or internet illiterates. In addition,
because of its central management, a coherent dataset was made available online to be used by local
educational services.
3.1.2 @SCHOOL for the region of Flanders
For the second phase, all geographical locations of the primary schools in Flanders were collected,
thus making the application generally applicable for all families in Flanders. This extended dataset
containing all geographical information will further be completed by adding all relevant information,
school by school. For this, the geographical application is promoted in the city of Ghent, in order to
create an awareness of the benefit of using the application in the city’s educational planning as well as
locally by the inhabitants.](https://image.slidesharecdn.com/rapporttheuseofgeographicalapplicationsformicro-planningschoollocations-theschoolappforpreschoolsing-140514035957-phpapp01/75/Rapport-the-use-of-geographical-applications-for-micro-planning-school-locations-the-school-app-for-preschools-in-ghent-belgium-3-2048.jpg)
![Figure 3: geographical application @SCHOOL, pop-up with general information concerning a certain
school
4.1.4 Future steps
Future implementations consist of promoting the application to the public (with the help of the city of
Ghent), using the application during the period of enrolment in Ghent and extending the dataset for all
primary schools in Flanders. Therefore, all rudimentary information will be converted into detailed
information by local governments, educational services and schools, and this in a controlled
environment. Integration with existing initiatives such as the Schools of Tomorrow partnership which
covers the design, building, financing and maintenance of school facilities for the next 30 years is also
possible.
5 RESULTS
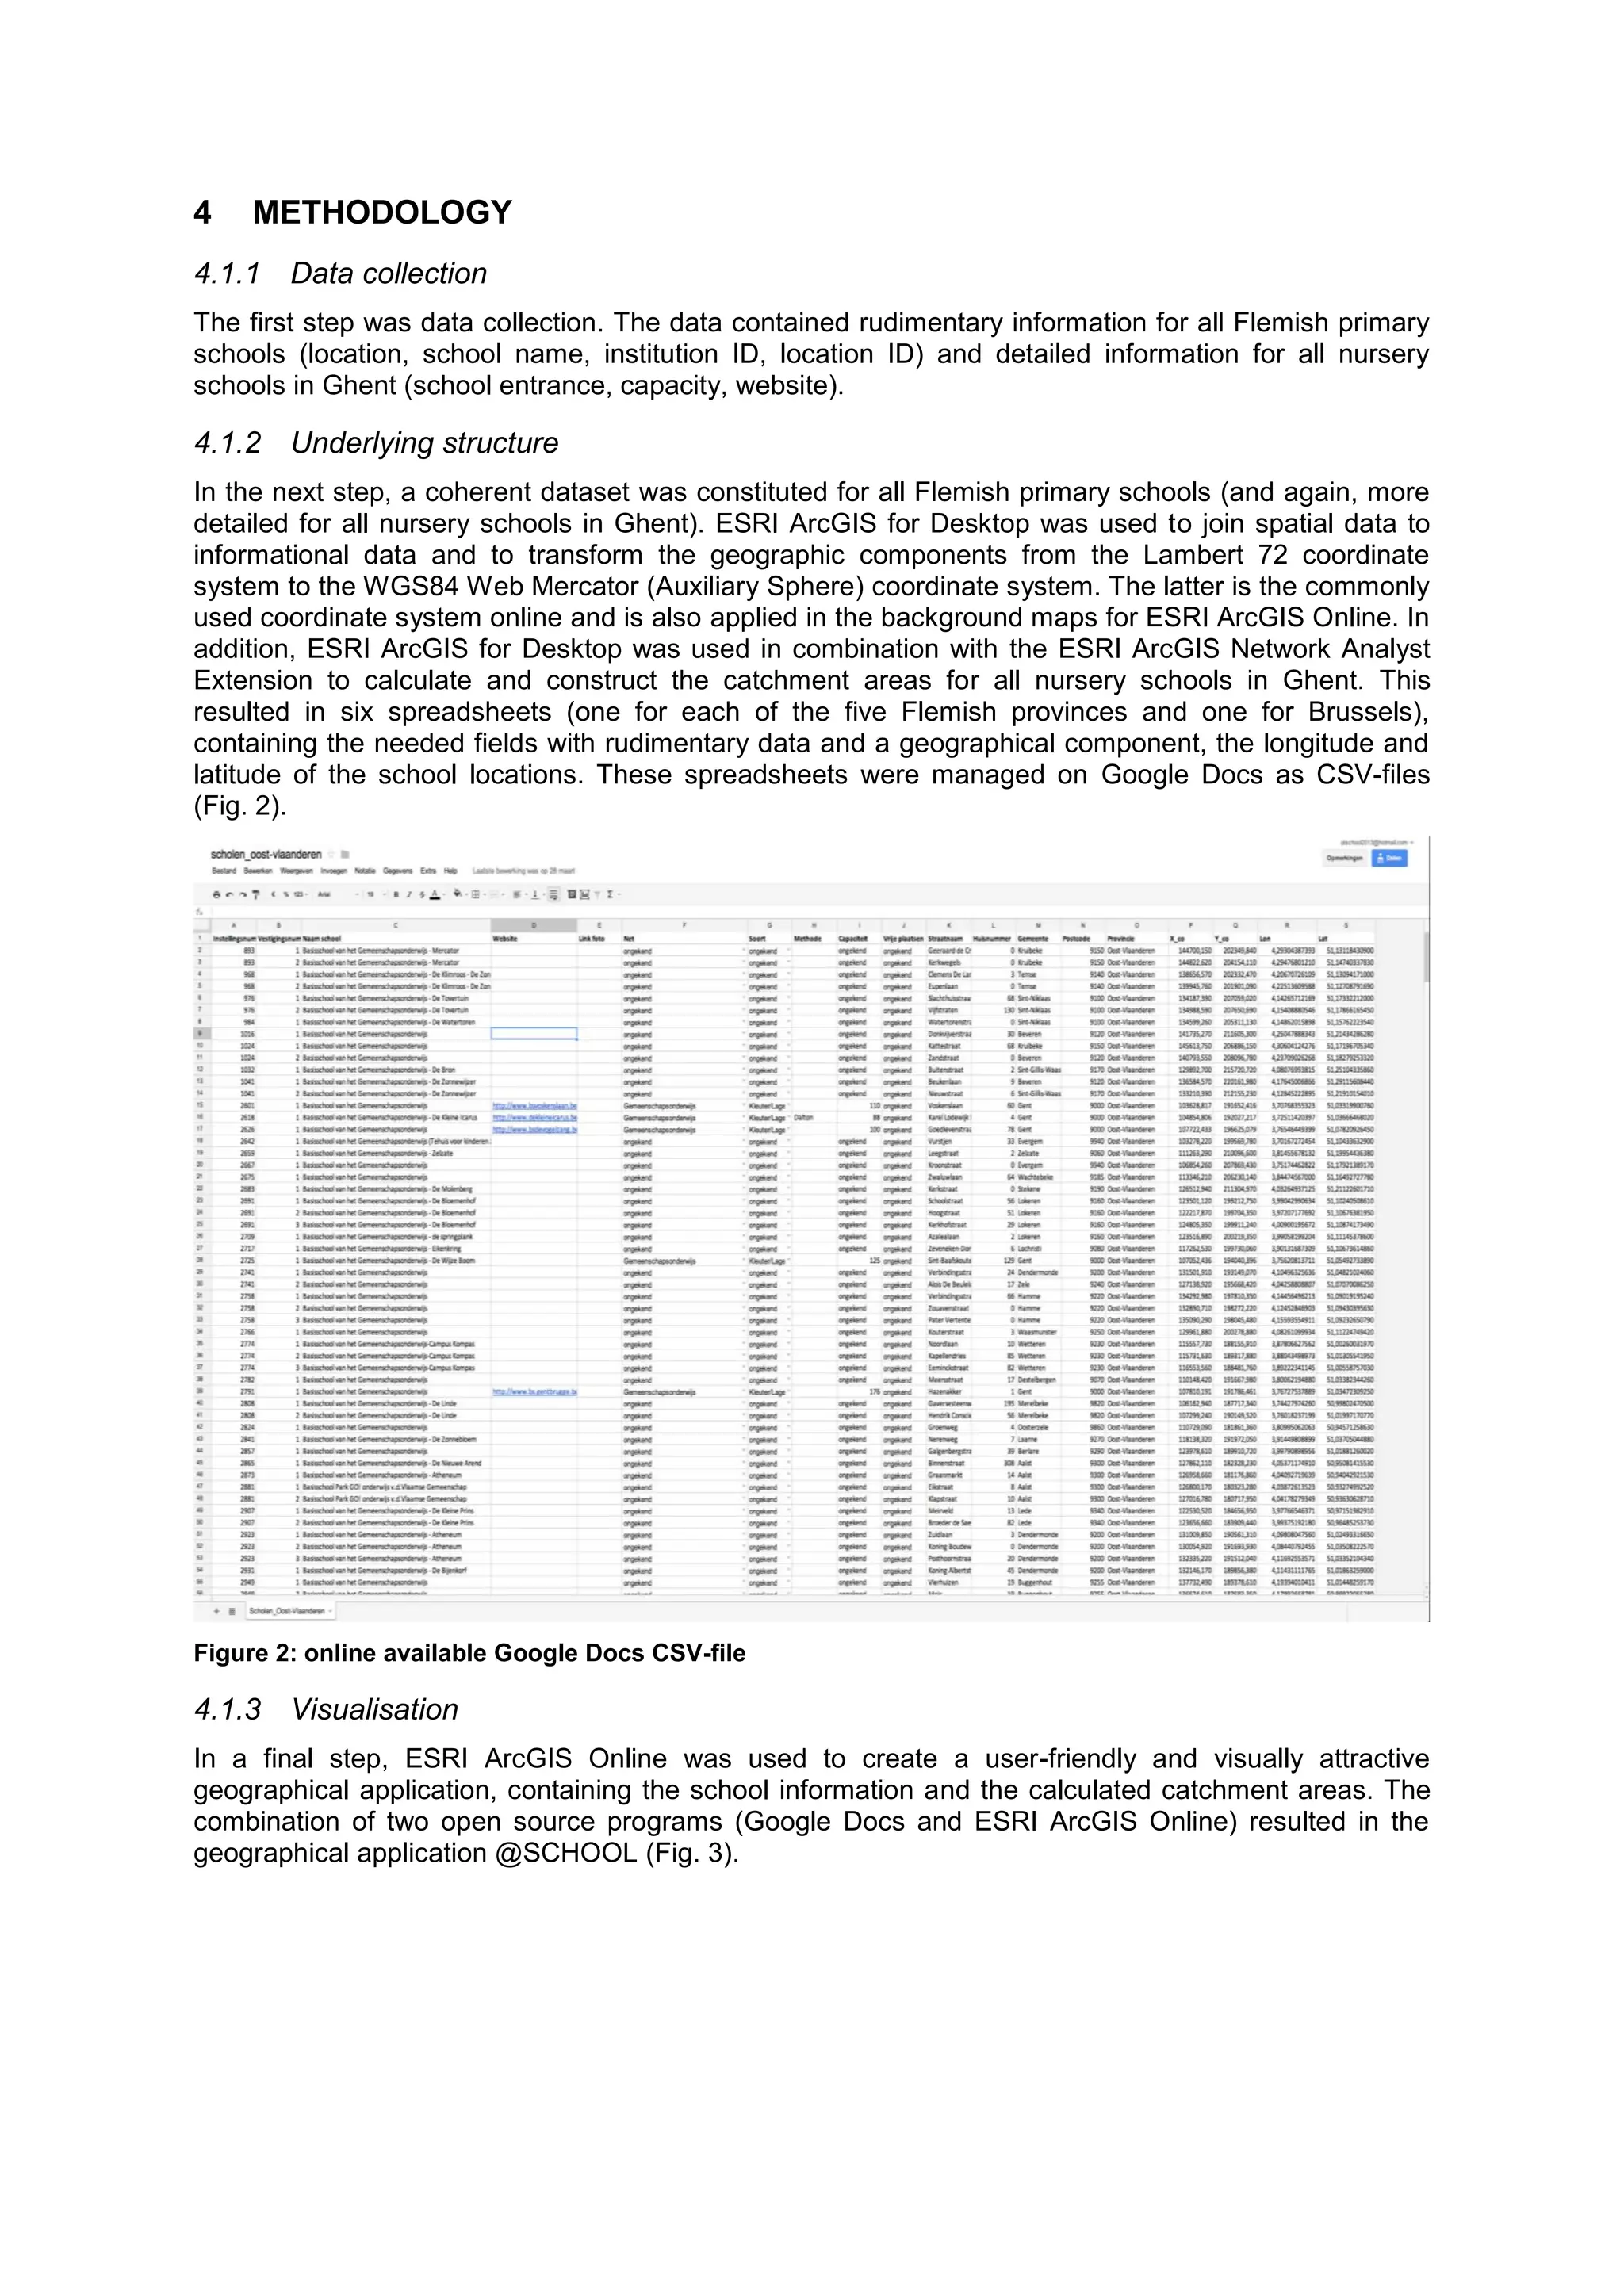
The result is a geographical web application. Two open source web application are used to join the
spreadsheets to a geographical map layout: Google Docs is applied to manage the spreadsheets and
ESRI ArcGIS Online to visualize them. The CSV spreadsheets are partially made available to the
public and thus filled in by different participants in a coherent way, thus providing an inclusive nature
by facilitating a dialogue between the different actors on different levels. A participative form of
planning can improve citizens’ quality of life (QOL) [12]. The most innovative element of the
application is found in the way it is updated: by using the CSV-files in Google Docs, the editing is
separated from the visualization. Because of this, the user is not confronted with the underlying
structure and changes are made in a controlled online environment. By providing a link to the Google
Docs in combination with a password, selected users can add data to certain fields of the existing
CSV-files (Fig. 2). Eventually, the application is updated in real-time when an original file is edited.
As such, geographical data for all schools in Flanders and Brussels was made available and the
corresponding additional information could be completed locally. This leads to a great advantage,
because elements should not be added to the application, but only extra information for existing
elements should be provided. Eventually, it is possible to provide online and real-time information
concerning the schools’ characteristics. This way, using the application will benefit the enrolment and
contribute towards a solution to an ever growing social problem. Because of the possibility to receive
information concerning the school capacity (and in extension the remaining capacity during
enrolment), frustrations as a result of the huge amount of rejections when the maximum capacity is
reached, will be reduced](https://image.slidesharecdn.com/rapporttheuseofgeographicalapplicationsformicro-planningschoollocations-theschoolappforpreschoolsing-140514035957-phpapp01/75/Rapport-the-use-of-geographical-applications-for-micro-planning-school-locations-the-school-app-for-preschools-in-ghent-belgium-5-2048.jpg)
![6 CONCLUSION
The geographical application has proven its use: young families are facing a difficult choice in enrolling
their children in the most suitable school and access to the correct information benefits everyone.
Questions such as ‘Which schools are catholic schools’ or ‘Where are the biggest schools located’ are
answered after a few simple mouse clicks. Furthermore, by entering an address in the application, the
nearest schools are visualized and the distance zone from the address to the school is given. The
application is linked to the Central Application Register (CAR or ‘Centraal Aanmeldingsregister‘),
making this information accessible to the public. That way, a micro-planning process on the
decentralized level is compiled.
By promoting the application, Ghent’s city services will improve the overall awareness of the
importance of education for the city and its inhabitants. As such, the city of Ghent acts as an activator
for extending the detailed dataset to the whole Flemish community. Eventually, the dataset will contain
detailed information for all primary schools in Flanders. This dataset is made available via online CSV-
files (managed centrally) and the open source application @SCHOOL. By promoting the use of an
online application to the target groups a continuous enhancement of the data quality and accuracy is
guaranteed, while supporting a better communication between all parties.
REFERENCES
[1] Caillods, F. O. (1983). Module I: School mapping and micro-planning concepts and processes. n
. O. Caillods, . Casselli, T. . Ch u G. orte ( ds.), Training materials in educational
planning, administration and facilities: School mapping and micro-planning in education. Paris:
IIEP/UNESCO.
[2] Hite, S. J. (2008). School Mapping and GIS in Education Micro-planning. Paris: International
Institute for Educational Planning.
[3] Galabawa, J. C. J., Agu, A. O., Miyazama, I. (2002). The impact of school mapping in the
development of education in Tanzania: an assessment of the experiences of six districts.
Evaluation and Program Planning 25(1), pp. 23-33.
[4] Esri. (2010). GIS Best Practice - GIS for INSPIRE.
[5] Kamermans, H. (2010). The Application of Predictive Modelling in Archaeology: Problems and
Possibilities, Archaeolingua, pp. 273-277.
[6] Lieshout, R. (2012). Measuring the size of an airport's catchment area. Journal of Transport
Geography 25, pp. 27-34.
[7] Mendelsohn, J. M. (1996). Education Planning and Management and the Use of Geographical
Information Systems. Paris: UNESCO Publishing - International Institute for Educational Planning.
[8] Attfield, I., & Tamiru, M. (2002). Setting up and using a Geographical Information System for
micro-planning and school mapping in Ethiopia Improving Micro-Planning in Education through a
Geographical Information System: Studies on Ethiopia and Palestine. School Mapping and Local-
Level Planning. Paris, France: United Nations Educational, Scientific, and Cultural Organization,
International Institute for Educational Planning, pp. 19-73.
[9] Mulaku, G. C., & Nyadimo, E. (2011). GIS in education planning: the Kenyan school mapping
project. Survey Review 43(323), pp. 567-578.
[10]Antrop, M., & De Maeyer, P. (2008). Theoretische concepten van GIS. Ghent: Academia Press.
[11]Deruyter, G., Fransen, K., Verrecas, N., De Maeyer, Ph. (2013). Evaluating spatial inequality in
preschools in Ghent, Belgium. 13th International Multidisciplinary Scientific Geoconference -
SGEM 2013, 16 - 22 June 2013, Conference proceedings, Volume I, Informatics Geoinformatics
Cartography and GIS, pp. 717-727.
[12]Massam, B. H. (2002). Quality of life: public planning and private living. Progress in Planning 58,
pp. 141-227.](https://image.slidesharecdn.com/rapporttheuseofgeographicalapplicationsformicro-planningschoollocations-theschoolappforpreschoolsing-140514035957-phpapp01/75/Rapport-the-use-of-geographical-applications-for-micro-planning-school-locations-the-school-app-for-preschools-in-ghent-belgium-6-2048.jpg)


![[DSC Europe 25] Bogdan Daniel Maruneac - AI - It starts with you.pptx](https://cdn.slidesharecdn.com/ss_thumbnails/odov3snhrcqs9hx5ny2n-4-251205085715-f1daacfe-thumbnail.jpg?width=640&height=640&fit=bounds)


![[DSC Europe 25] Dragana Ilic - AI for Big Data in Astronomy.pptx](https://cdn.slidesharecdn.com/ss_thumbnails/8palya86qaatvjhva1ms-2-dragana-ilic-ai-ilic-251208151906-652b819c-thumbnail.jpg?width=640&height=640&fit=bounds)

![[DSC Europe 25] Andy Cotgreave - Nothing is new in analytics.pptx](https://cdn.slidesharecdn.com/ss_thumbnails/mba4vzcurvoh5lfrd5zw-6-251205194645-341bbbbe-thumbnail.jpg?width=640&height=640&fit=bounds)
![[DSC Europe 25] Dusan Jovicic - AI Story: From on-prem to cloud and back agai...](https://cdn.slidesharecdn.com/ss_thumbnails/8kp49m6uq22ifnbwhfnk-2-251205085715-964d11a6-thumbnail.jpg?width=640&height=640&fit=bounds)

![[DSC Europe 25] Jim Sterne - Adopting Generative AI Capabilities Into the Ent...](https://cdn.slidesharecdn.com/ss_thumbnails/sxhpofuorcagxsaulkmt-3-251204082258-7e66bc48-thumbnail.jpg?width=640&height=640&fit=bounds)
![[DSC Europe 25] Goran Obradovic - The Rise of Sovereign AI: Building the Regi...](https://cdn.slidesharecdn.com/ss_thumbnails/7nw2xxixrxqdxvrb5wca-6-251205085714-ab09a2ac-thumbnail.jpg?width=640&height=640&fit=bounds)
![[DSC Europe 25] Max Talanov - Non digital NNs.pptx](https://cdn.slidesharecdn.com/ss_thumbnails/wif8tr3gtua74qvtopke-non-digital-nns-251205090438-26b0eea6-thumbnail.jpg?width=640&height=640&fit=bounds)
