Advanced spectral analysisUnit 5: RAMAN
SPECTROSCOPY
RAMAN SPECTROSCOPY
Introduction :
Raman spectroscopy was discovered by C.V. Raman in 1928.
Raman Spectroscopy(RS) deals with the scattering of light.
It is a spectroscopic technique used to observe vibration, rotational, and other low-
frequency modes in a system.
Raman spectroscopy is commonly used in chemistry to provide a fingerprint by which
molecules can be identified.
When the radiation pass through the transparent medium the species present scatter a
fraction of the beam in all direction.
Raman scattering result from the same type of quantities vibration change associated with
IR spectra.
The difference in wavelength in between the incident and scattered visible radiation
corresponds to wavelength in mid-IR region.
PRINCIPLE :
A Sample being exposed to monochromatic light, and the scattered light is analyzed by a
spectrometer. The technique is based in the inelastic scattering of the monochromatic
light, where the frequency of the incident photons changes. Initially, the photons are
absorbed by the sample and then re-emitted . the frequency of these re-emitted photons
shifts either up or down relative to the original monochromatic frequency, a phenomenon
known as the Raman effect. These shifts provide valuable information about vibrational,
and low- frequency transitions of the sample molecules.
The Raman effect relies on molecular deformations in the electric field influenced by the
molecular polarizability (α) . A laser beam can be viewed as an oscillating
Electromagnetic wave with an electric vector EEE. When this beam interacts the sample ,
it induces the electric dipole moment, causing molecular deformation. this periodic
deformation makes molecules vibrate at a characteristic frequency. therefore the
monochromatic laser beam with frequency excites the molecules, turning them into
oscillating dipoles. These dipoles then produces light at different frequencies.
1. The molecule without any Raman active modes absorbs a photon of frequency Vo. The
excited molecule comes back to its fundamental vibrational state after emitting light of
same frequency Vo, this phenomenon is described as the elastic Rayleigh scattering.
2. A Raman active molecule (in its fundamental vibrational state) absorbs a photon.
Some of the photon's energy is transmitted to molecule with frequency Vm.
Decreasing the frequency of scattered light is to Vo-Vm. This raman frequency is
known as Stokes frequency or simply “Stokes’’
SUMITH A (Reg.no. 2024153659) GITAM SCHOOL OF PHARMACY VSKP
2.
Advanced spectral analysisUnit 5: RAMAN
SPECTROSCOPY
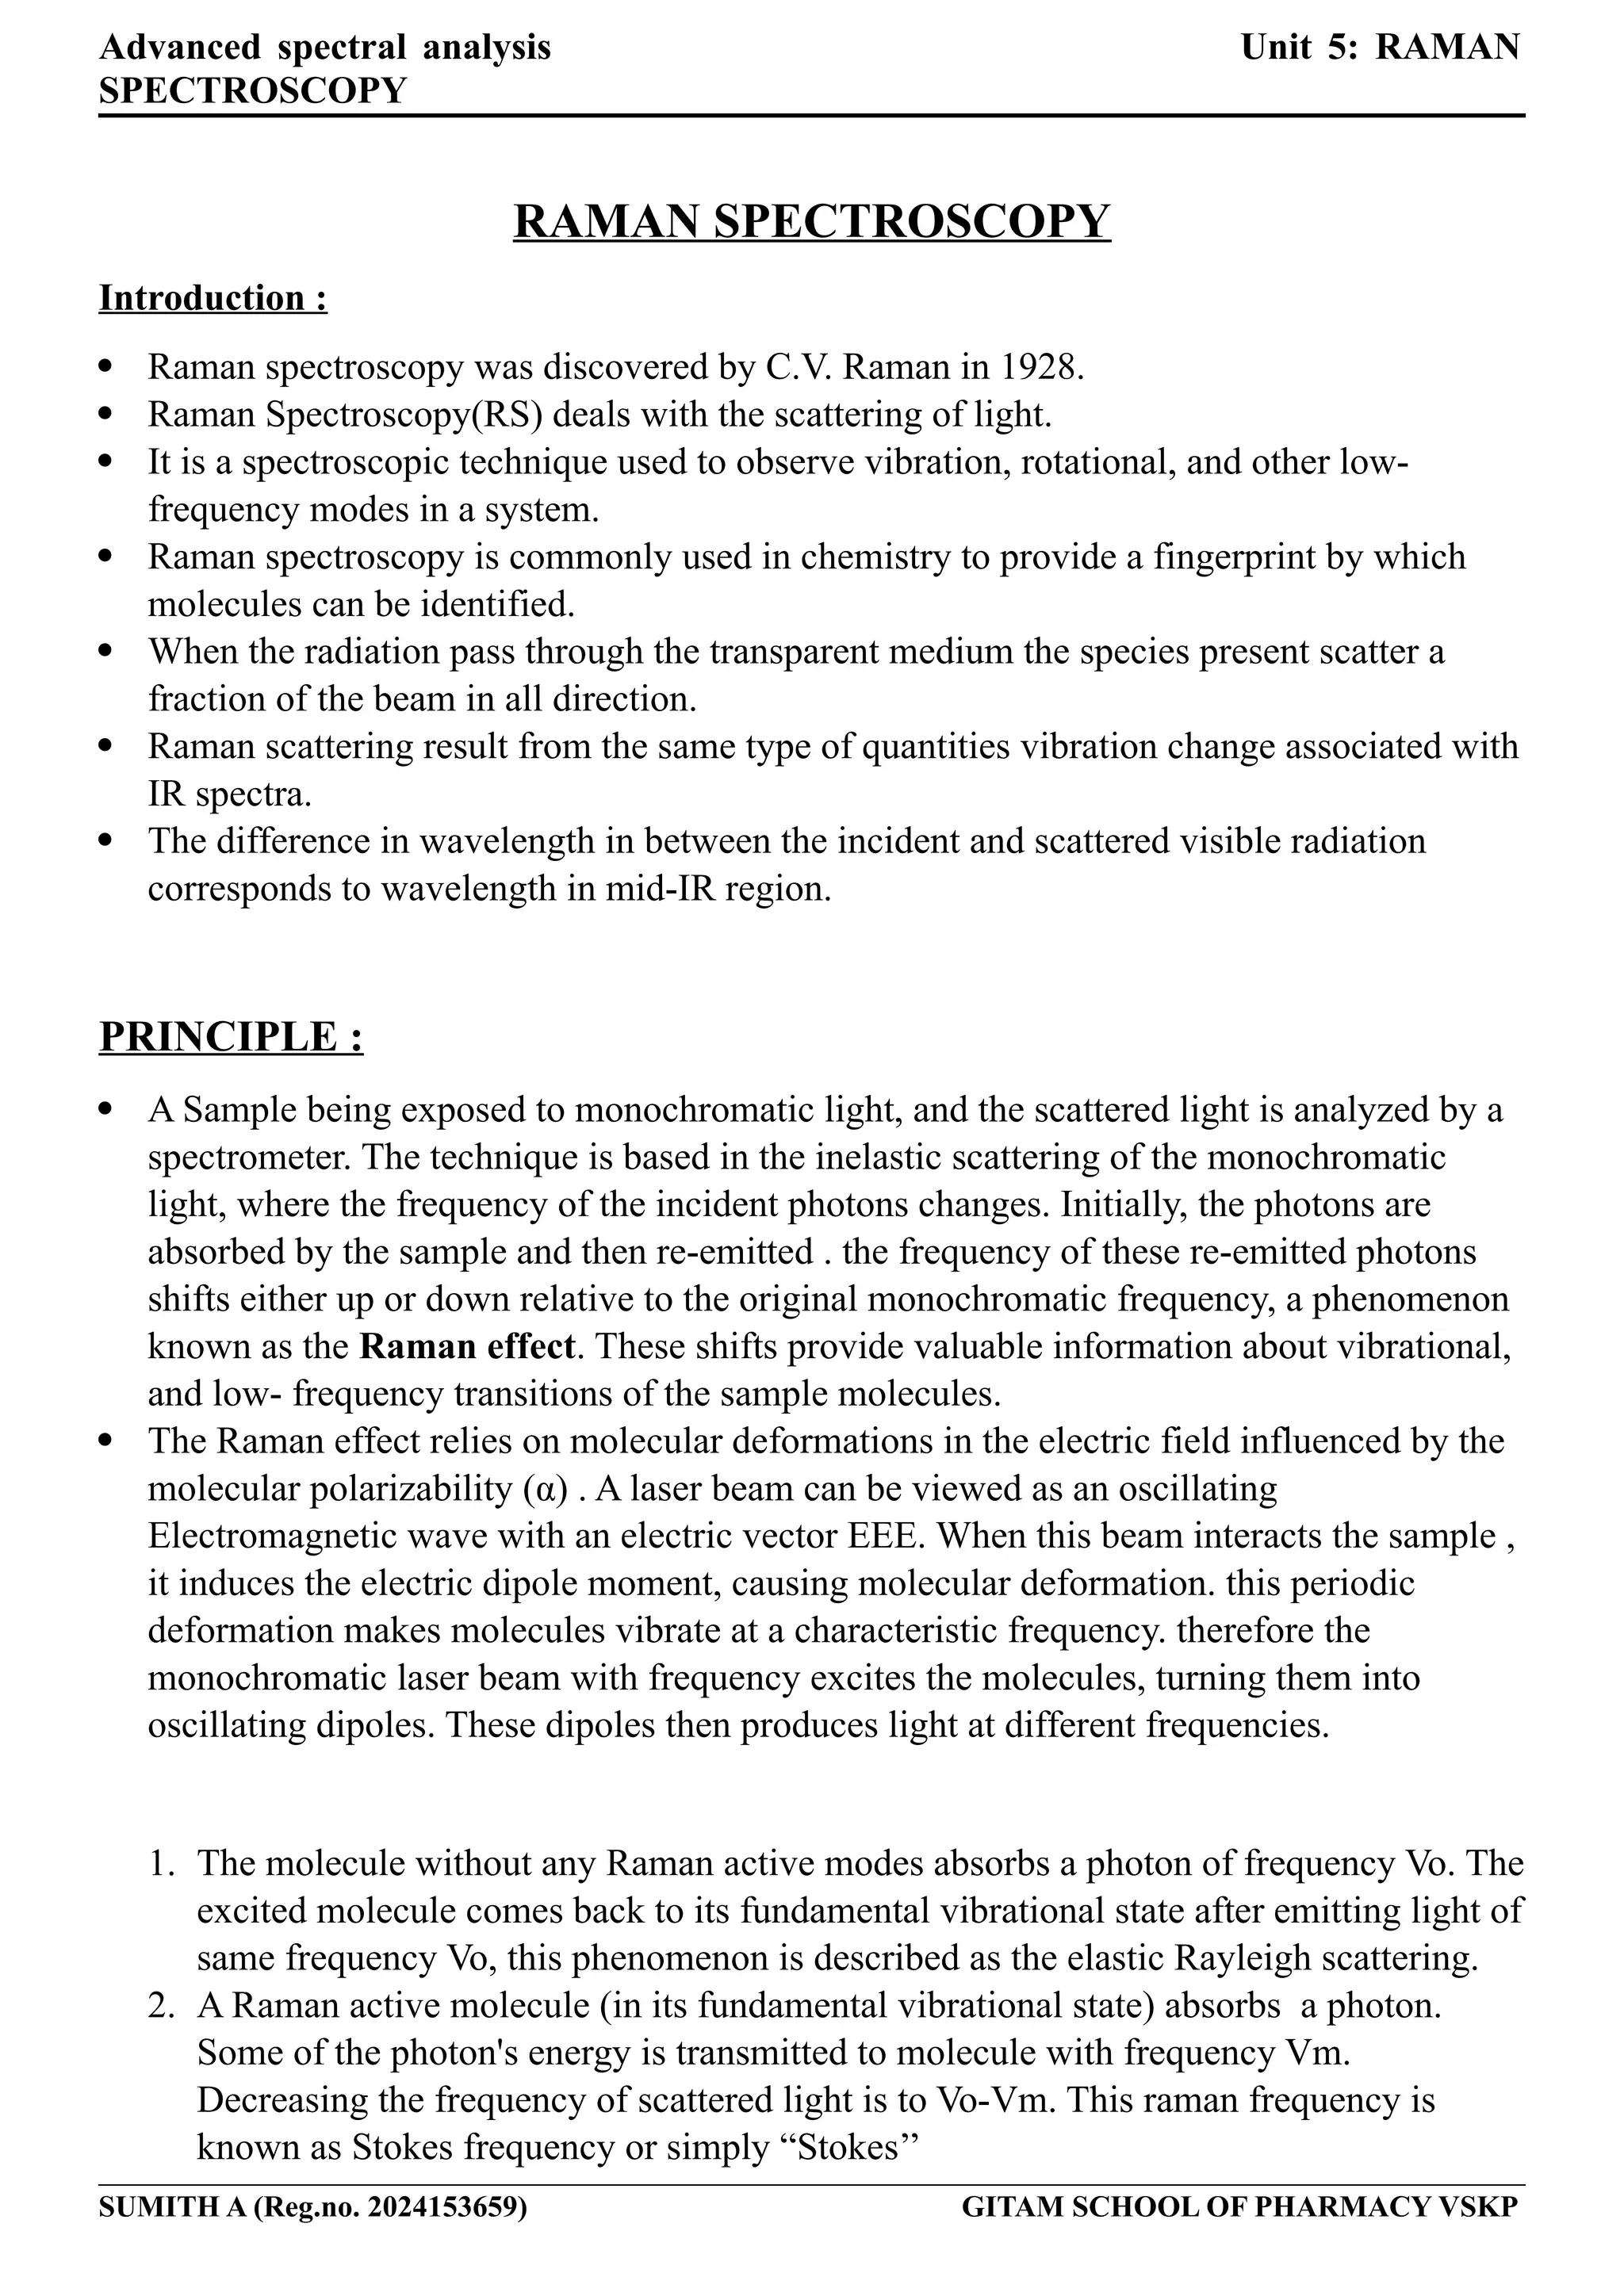
3. The molecule absorbing the photon is already in its excited vibrational
state. Excessive energy of excited Raman active mode is released, molecule
comes back to its fundamental vibrational state and the frequency of
scattered light increases to Vo+Vm. This raman frequency is called Anti
Stokes frequency or just “Anti Stokes”
Raman shift is independent of the incident light frequency. It is thee
characteristic feature of material undergoing Raman shift. The shift Δv, is
positive for Stokes and negative for Anti-stokes.
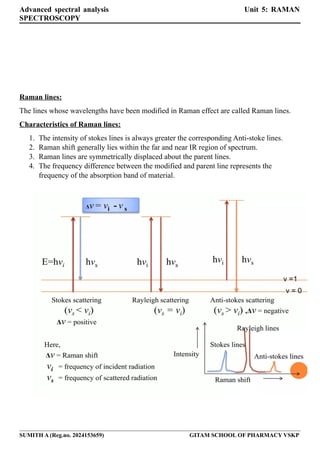
From figure it is evident that the
shifts in both the stokes and anti
stokes lines relative to the Rayleigh line
are equal. This is because both involve the gain and loss of one vibrational quantum of
energy.
However, the intensity of the anti-stokes lines is lower than that of the stokes line. This is
due to the anti-stokes line being produced by molecules that are already vibrationally excited
SUMITH A (Reg.no. 2024153659) GITAM SCHOOL OF PHARMACY VSKP
3.
Advanced spectral analysisUnit 5: RAMAN
SPECTROSCOPY
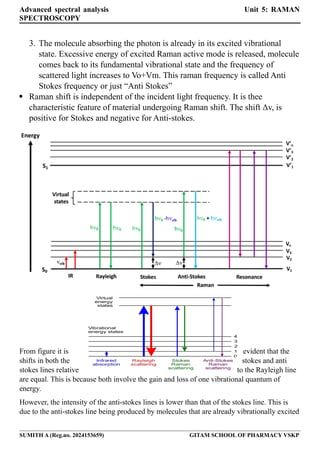
before irradiation, which are fewer in number, consequently, Raman investigations typically
focus on recording the more intense stokes lies.
RAMAN SPECTROSCOPY V/S IR
IR absorption spectroscopy is another method used to study molecular structures, but it
differs from raman spectroscopy in terms of molecular transitions involved. For transitions to
be raman active, the molecular polarizability must change during vibration, necessitating a
shift in the electron cloud’s position. In contrast, IR transitions require change in the
molecule,s dipole moment during vibration.
Homonuclear diatomic molecules such as H2, N2, and O2 which do not exhibit infrared
spectra due to the absence of permanent dipole moment, are Raman active because their
vibrations alter the molecule’s polarizability. This makes Raman spectroscopy suitabke for
examining vibrational spectra of compounds that cannot be studied by IR absorption
spectroscopy .
SUMITH A (Reg.no. 2024153659) GITAM SCHOOL OF PHARMACY VSKP
4.
Advanced spectral analysisUnit 5: RAMAN
SPECTROSCOPY
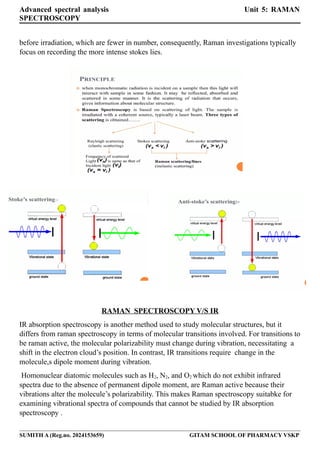
Significance of Rama Spec : Rama Spec. is extensively used for analysing gases, liquids,
and solids making it an incredibly versatile tool for examining a wide range of materials.
Each Raman spectrum is unique due its distinct structural arrangement, allowing for easy
determination of the composition of unknown substances. This makes Raman spectroscopy
particularly effective for qualitative analysis of substances.
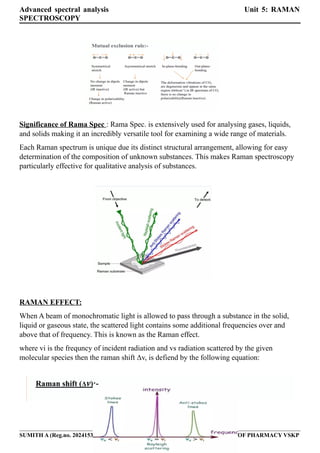
RAMAN EFFECT:
When A beam of monochromatic light is allowed to pass through a substance in the solid,
liquid or gaseous state, the scattered light contains some additional frequencies over and
above that of frequency. This is known as the Raman effect.
where vi is the frequncy of incident radiation and vs radiation scattered by the given
molecular species then the raman shift Δv, is defiend by the following equation:
SUMITH A (Reg.no. 2024153659) GITAM SCHOOL OF PHARMACY VSKP
5.
Advanced spectral analysisUnit 5: RAMAN
SPECTROSCOPY
Raman lines:
The lines whose wavelengths have been modified in Raman effect are called Raman lines.
Characteristics of Raman lines:
1. The intensity of stokes lines is always greater the corresponding Anti-stoke lines.
2. Raman shift generally lies within the far and near IR region of spectrum.
3. Raman lines are symmetrically displaced about the parent lines.
4. The frequency difference between the modified and parent line represents the
frequency of the absorption band of material.
SUMITH A (Reg.no. 2024153659) GITAM SCHOOL OF PHARMACY VSKP
6.
Advanced spectral analysisUnit 5: RAMAN
SPECTROSCOPY
Raman IR
It is due to the scattering if light by the
vibrating molecules.
It is the result of absorption of light by
vibrating molecules.
The vibration is Raman active if it
causes a change in polarizability
Vibration is IR activr if there is change in
dipole moment
The molecule need not possess a
permanent dipole moment
The vibration concerned should have a
change in dipole moment due to that
vibration
Water can be used as solvent Water cannot be used due to its intense
absorption of IR
Sample preparation is not very
elaborate, it can be in any state.
Sample preparation is elaborate gaseous
samples can rarely be used.
Gives an indication of covalent
character in the molecule.
Gives an indication of ionic character in
the molecule.
Cost of instrumentation is very high Compatively inexpensive
INSTRUMENTATION
Either dispersive or non dispersive spectrophotometers can be used. A prosm or a gratign is
employed in the dispersive spectrophotometer, whereas, non – dispersive employs
interferometer, analogous to michealson interferometer in FTIR.
Components of Raman spectroscopy:
1. Excitation Source (Laser):
Early Raman spectrometers use mercury arc lamps, Specifically the 435.8 nm line of a
coiled low-pressure mercury arc lamp, until the 1960s. Laser sources, which became
available in the late 1960s, have since completely replaced mercury arc lamps. Theses
laser sources provide a stable and intense beam of radiation,
Types of lasers used.
Argon Ion lasers : 488 and 514.5nm
Krypton ion lasers
Helium – neon lasers [(7:1) mixture of helium neon gas ]: 632.8nm
Near Infrared (IR)diode lasers : 785 and 830nm
SUMITH A (Reg.no. 2024153659) GITAM SCHOOL OF PHARMACY VSKP
7.
Advanced spectral analysisUnit 5: RAMAN
SPECTROSCOPY
Neodymium – yttrium aluminium garnet and neodymium – yttrium ortho vanadate (Nd)
lasers : 1064nm
Short wavelength sources like argon ion and krypton ion lasers can generate significant
fluorescence and cause photodecomposition of the specimen. IN contrast, long
wavelength sources such as diode or Nd lasers can operate art high power without
decomposing the sample and also reduce or eliminate fluorescence.
2. Optics for sample illumination and light collection :
Light from the irradiated or illuminated spot on the sample is collimated by a lens and
guided to an interference filter or spectrometer to obtain the Raman spectrum.
3. Wavelength Selector (Filter or Spectrometer) :
Band pass filters are used to isolate a single laser beam. A combination of notch filters
and high-quality grating monochromators is commonly used in dispersive instruments.
Various filters and monochromators are employed to separate relatively weak Raman
lines from intense Rayleigh scattered radiation, including:
Double or triple grating monochromators
Super notch filters
Rejection filters
Holographic notch or edge filters
Holographic filters
4. Detector (Photodiode Array, CCD, or PMT)
Early models of dispersive Raman spectrophotometers used thermoelectrically cooled
photomultiplier tubes and photodiode array detectors. Advances in instrumentation and
technology have led to the replacement of these detectors with more sensitive charge
transfer devices (CTDs) such as charge-coupled devices (CCDs) and charge-injection
devices (CIDs). These devices act as detectors in the form of arrays. In CTD arrays, photo
sites convert the incoming optical signal into charge, which is then integrated and
transferred to readout devices.
Multichannel CCD Detectors: Used with laser wavelengths of less than 1 µm.
Single Element Low Band-Gap Semiconductor Detectors: Such as Germanium (Ge) or
Indium-Gallium-Arsenic (InGaAs), used with laser wavelengths greater than 1 um.
These components together enable Raman spectroscopy to analyze and characterize
materials with high sensitivity and specificity.
SUMITH A (Reg.no. 2024153659) GITAM SCHOOL OF PHARMACY VSKP
8.
Advanced spectral analysisUnit 5: RAMAN
SPECTROSCOPY
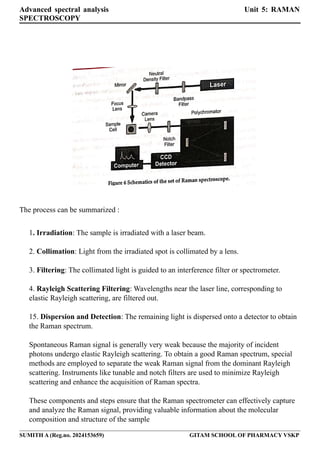
The process can be summarized :
1. Irradiation: The sample is irradiated with a laser beam.
2. Collimation: Light from the irradiated spot is collimated by a lens.
3. Filtering: The collimated light is guided to an interference filter or spectrometer.
4. Rayleigh Scattering Filtering: Wavelengths near the laser line, corresponding to
elastic Rayleigh scattering, are filtered out.
15. Dispersion and Detection: The remaining light is dispersed onto a detector to obtain
the Raman spectrum.
Spontaneous Raman signal is generally very weak because the majority of incident
photons undergo elastic Rayleigh scattering. To obtain a good Raman spectrum, special
methods are employed to separate the weak Raman signal from the dominant Rayleigh
scattering. Instruments like tunable and notch filters are used to minimize Rayleigh
scattering and enhance the acquisition of Raman spectra.
These components and steps ensure that the Raman spectrometer can effectively capture
and analyze the Raman signal, providing valuable information about the molecular
composition and structure of the sample
SUMITH A (Reg.no. 2024153659) GITAM SCHOOL OF PHARMACY VSKP
9.
Advanced spectral analysisUnit 5: RAMAN
SPECTROSCOPY
Applications of Raman Spectroscopy:
Raman spectroscopy indeed finds extensive applications across various disciplines:
1. Inorganic Chemistry: It helps study the structure of small reactive molecules that
exist only in the gas phase and are IR inactive, providing insights into bond lengths and
geometries of homonuclear diatomic molecules.
2. Organic Chemistry: Used to detect specific linkages in molecules, determine
structures of simple compounds, and differentiate between isomers (e.g., cis and trans
configurations).
3. Physical Chemistry: Applied in studies involving electrolytic dissociation, hydrolysis,
and phase transitions (crystalline to amorphous). It's also crucial for characterizing
polymer compounds, revealing physical properties and tacticity.
4. Forensic Science: Used for identifying illicit drugs, analyzing gunshot residue, and
examining inks used in explosives, aiding in criminal investigations.
5. Pharmaceutical Sector: Widely adopted for rapid analysis of excipients and active
pharmaceutical ingredients (APIs) in tablets. Provides detailed insights into tablet
structures and can analyze individual grains and phase boundaries.
6. Biomedical Applications: Confirms the existence of low-frequency phonons in
proteins and DNA, aiding in understanding their biological functions. Used for
biochemical characterization of wounds and detecting cancer cells in bodily fluids like
urine and blood samples.
Raman spectroscopy's ability to provide detailed molecular information without complex
sample preparation makes it invaluable across these diverse fields, contributing
significantly to research. analysis, and diagnostics
More info:
Applications in inorganic chemistry :
for the examination of
Structure of CO2.
Structure of N2O
Structure of mercurous salts
SUMITH A (Reg.no. 2024153659) GITAM SCHOOL OF PHARMACY VSKP
10.
Advanced spectral analysisUnit 5: RAMAN
SPECTROSCOPY
Structure of chloro complexes of mercury
Nature of bonding
Hydrogen cyanide
Sulphuric aicd
Carbon disulphide
Carbon monoxide
Water
Applications in physical chemistry
Amorphous state of substances give rise to broad and diffused bands
While Crystalline state of substance show fine sharp lines
Ionic equilibria in solution:
HNO3+ H2O ionised into H3O-
+ NO3
-
by monitoring the intensity od the nitrate ion and nitric acid in the raman spectrum it is
possible to calculate dissociation constant of nitric acid
Study of single crystal
In case of the phenomenon of Electrolyte dissociation, the intensity of raman lines
enables us to determine the number and nature of ions produced.
SUMITH A (Reg.no. 2024153659) GITAM SCHOOL OF PHARMACY VSKP

![Advanced spectral analysis Unit 5: RAMAN
SPECTROSCOPY
Raman IR
It is due to the scattering if light by the
vibrating molecules.
It is the result of absorption of light by
vibrating molecules.
The vibration is Raman active if it
causes a change in polarizability
Vibration is IR activr if there is change in
dipole moment
The molecule need not possess a
permanent dipole moment
The vibration concerned should have a
change in dipole moment due to that
vibration
Water can be used as solvent Water cannot be used due to its intense
absorption of IR
Sample preparation is not very
elaborate, it can be in any state.
Sample preparation is elaborate gaseous
samples can rarely be used.
Gives an indication of covalent
character in the molecule.
Gives an indication of ionic character in
the molecule.
Cost of instrumentation is very high Compatively inexpensive
INSTRUMENTATION
Either dispersive or non dispersive spectrophotometers can be used. A prosm or a gratign is
employed in the dispersive spectrophotometer, whereas, non – dispersive employs
interferometer, analogous to michealson interferometer in FTIR.
Components of Raman spectroscopy:
1. Excitation Source (Laser):
Early Raman spectrometers use mercury arc lamps, Specifically the 435.8 nm line of a
coiled low-pressure mercury arc lamp, until the 1960s. Laser sources, which became
available in the late 1960s, have since completely replaced mercury arc lamps. Theses
laser sources provide a stable and intense beam of radiation,
Types of lasers used.
Argon Ion lasers : 488 and 514.5nm
Krypton ion lasers
Helium – neon lasers [(7:1) mixture of helium neon gas ]: 632.8nm
Near Infrared (IR)diode lasers : 785 and 830nm
SUMITH A (Reg.no. 2024153659) GITAM SCHOOL OF PHARMACY VSKP](https://image.slidesharecdn.com/ramanspectroscopy1-250218081338-4e793e38/85/advanced-spectral-analysis-RAMAN-SPECTROSCOPY-1-docx-6-320.jpg)