Downloaded 617 times
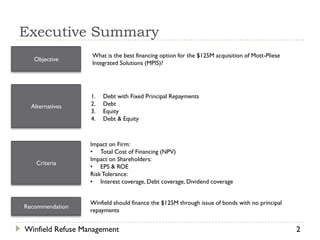
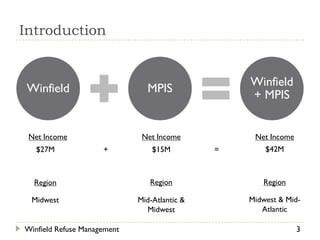
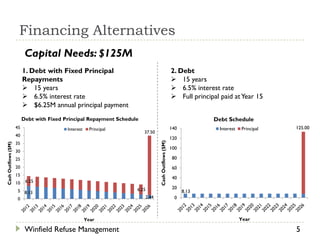
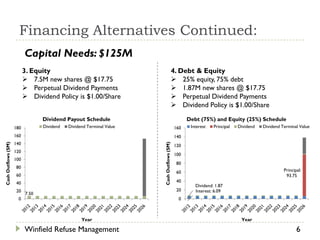
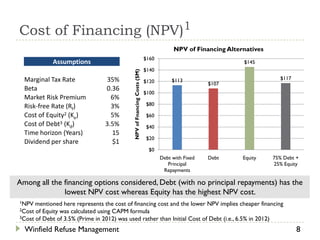
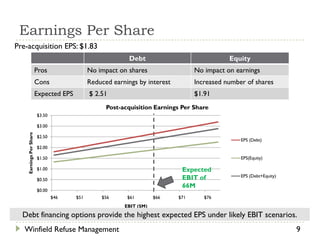
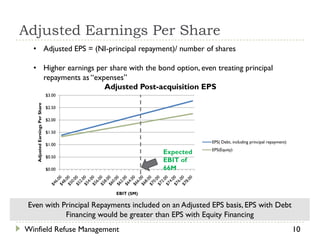
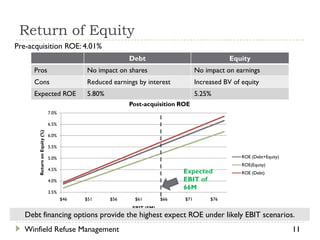
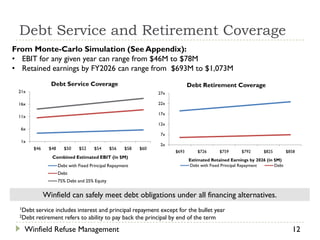
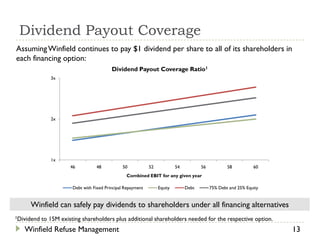
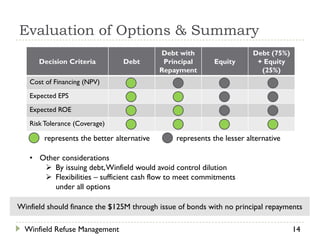
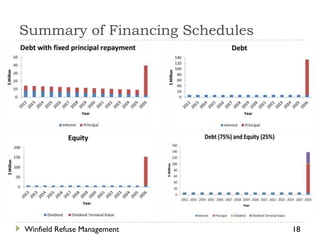
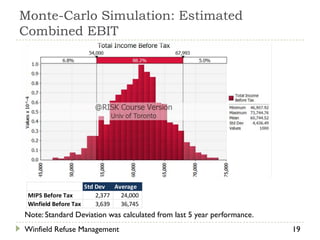
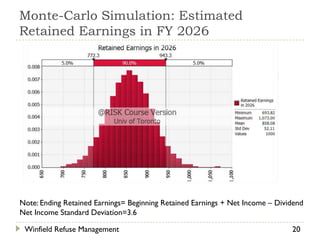
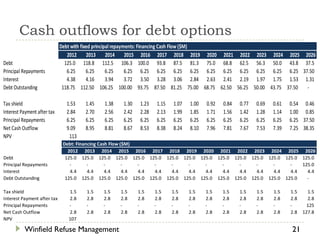
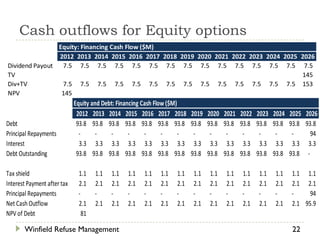
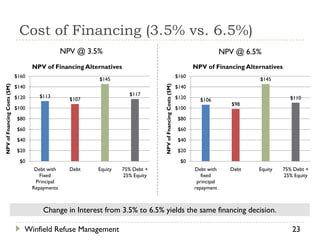
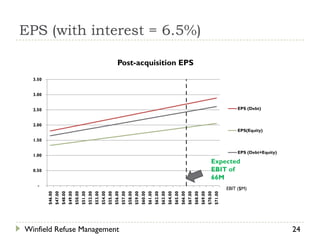
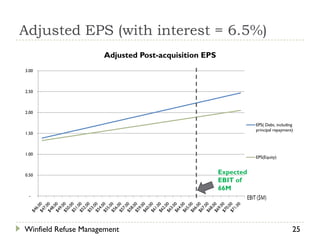
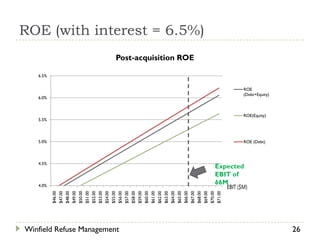

Winfield Refuse Management is considering financing options to acquire Mott-Pliese Integrated Solutions for $125 million. The options considered are: debt with fixed principal repayments, debt, equity, and a combination of debt and equity. Debt with fixed principal repayments of $6.25 million annually over 15 years has the lowest net present value of financing costs. It also provides the highest expected earnings per share and return on equity under likely earnings scenarios. Monte Carlo simulations show Winfield can meet debt obligations and maintain strong interest, debt, and dividend coverage ratios under varying earnings outcomes. Therefore, the recommendation is for Winfield to finance the acquisition through the issuance of bonds with no principal repayments


