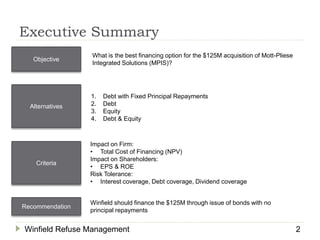
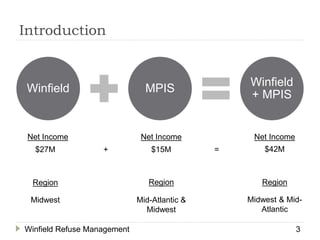
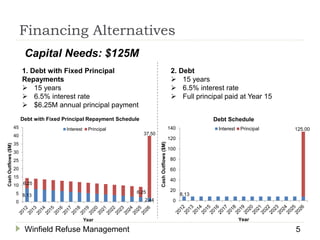
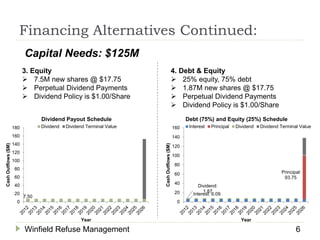
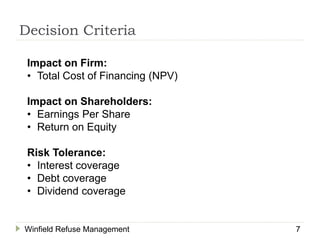
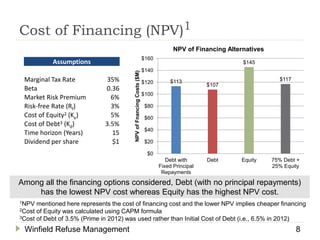
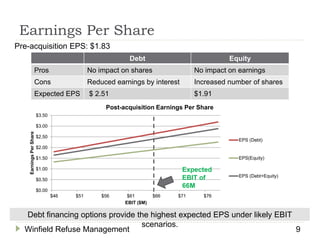
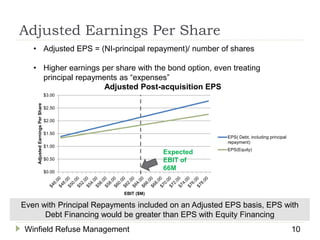
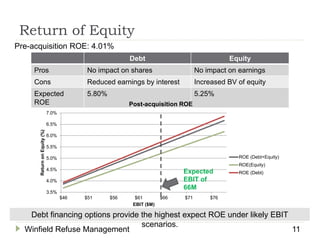
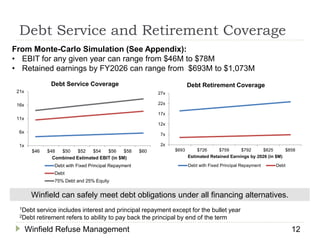
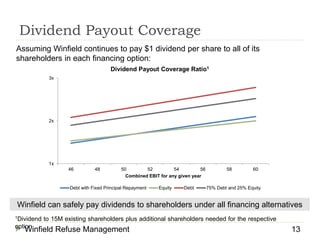
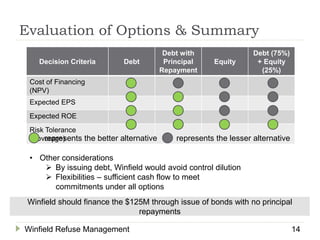
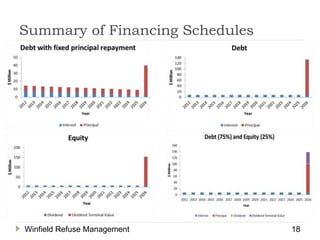
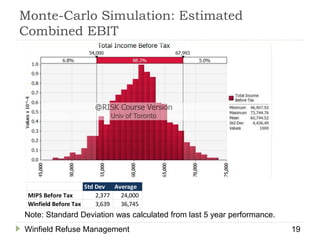
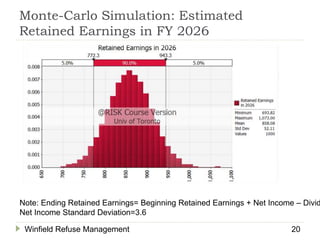
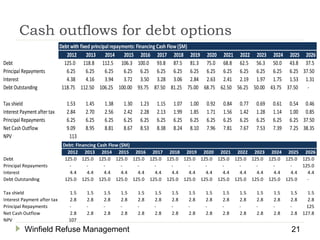
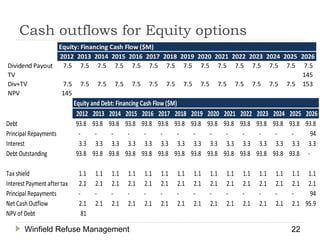
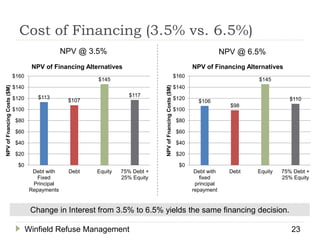
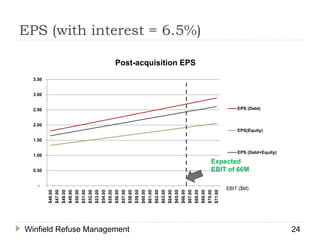
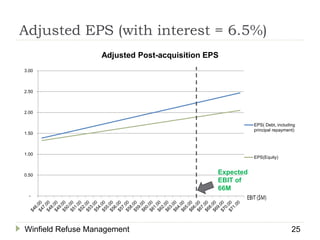
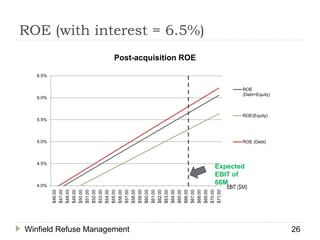
SlideShare a Scribd company logo
1 of 26
Winfield Refuse Management Inc.
Raising Debt vs. Equity
Iris Chen
Alex Ho
Brian Huang
Pramod Jindal
Michael Trecroce
Executive Summary
Objective
Alternatives
Recommendation
Criteria
What is the best financing option for the $125M acquisition of Mott-Pliese
Integrated Solutions (MPIS)?
1. Debt with Fixed Principal Repayments
2. Debt
3. Equity
4. Debt & Equity
Winfield should finance the $125M through issue of bonds with no
principal repayments
Impact on Firm:
• Total Cost of Financing (NPV)
Impact on Shareholders:
• EPS & ROE
Risk Tolerance:
• Interest coverage, Debt coverage, Dividend coverage
Winfield Refuse Management 2
Introduction
Winfield MPIS
Winfield
+ MPIS
$27M $15M $42M
Midwest Mid-Atlantic &
Midwest
Midwest & Mid-
Atlantic
+ =
Net Income Net Income Net Income
Region Region Region
Winfield Refuse Management 3
Winfield’s Current Financial Position
50%
50%
Industry: Debt-to-Equity
Equity Debt
79%
21%
Winfield: 100% Equity Ownership
Winfield Family OTC
$0.00
$0.50
$1.00
$1.50
$2.00
2006 2007 2008 2009 2010 2011 2012E
$/Share
EPS and Dividends
DPS
Winfield Refuse Management 4
$0
$10
$20
$30
$40
$50
$0
$100
$200
$300
$400
$500
2006 2007 2008 2009 2010 2011 2012E
NetIncome($M)
Revenue($M)
Winfield’s Revenue and Net Income
Revenue Net Income
Financing Alternatives
1. Debt with Fixed Principal
Repayments
 15 years
 6.5% interest rate
 $6.25M annual principal payment
Capital Needs: $125M
2. Debt
 15 years
 6.5% interest rate
 Full principal paid at Year 15
8.13
2.44
6.25
6.25
37.50
0
5
10
15
20
25
30
35
40
45
CashOutflows($M)
Year
Debt with Fixed Principal Repayment Schedule
Interest Principal
8.13
125.00
0
20
40
60
80
100
120
140
CashOutflows($M)
Year
Debt Schedule
Interest Principal
Winfield Refuse Management 5
Financing Alternatives Continued:
7.50
0
20
40
60
80
100
120
140
160
180
CashOutflows($M)
Year
Dividend Payout Schedule
Dividend Dividend Terminal Value
Interest: 6.09
Principal:
93.75
Dividend:
1.87
0
20
40
60
80
100
120
140
160
CashOutflows($M)
Year
Debt (75%) and Equity (25%) Schedule
Interest Principal Dividend Dividend Terminal Value
Winfield Refuse Management 6
3. Equity
 7.5M new shares @ $17.75
 Perpetual Dividend Payments
 Dividend Policy is $1.00/Share
Capital Needs: $125M
4. Debt & Equity
 25% equity, 75% debt
 1.87M new shares @ $17.75
 Perpetual Dividend Payments
 Dividend Policy is $1.00/Share
Decision Criteria
Impact on Firm:
• Total Cost of Financing (NPV)
Impact on Shareholders:
• Earnings Per Share
• Return on Equity
Risk Tolerance:
• Interest coverage
• Debt coverage
• Dividend coverage
Winfield Refuse Management 7
Cost of Financing (NPV)1
Among all the financing options considered, Debt (with no principal repayments)
has the lowest NPV cost whereas Equity has the highest NPV cost.
1NPV mentioned here represents the cost of financing cost and the lower NPV implies cheaper financing
2Cost of Equity was calculated using CAPM formula
3Cost of Debt of 3.5% (Prime in 2012) was used rather than Initial Cost of Debt (i.e., 6.5% in 2012)
Winfield Refuse Management 8
$113
$107
$145
$117
$0
$20
$40
$60
$80
$100
$120
$140
$160
Debt with
Fixed Principal
Repayments
Debt Equity 75% Debt +
25% Equity
NPVofFnancingCosts($M)
NPV of Financing Alternatives
Assumptions
Marginal Tax Rate 35%
Beta 0.36
Market Risk Premium 6%
Risk-free Rate (Rf) 3%
Cost of Equity2 (Ke) 5%
Cost of Debt3 (Kd) 3.5%
Time horizon (Years) 15
Dividend per share $1
Debt Equity
Pros No impact on shares No impact on earnings
Cons Reduced earnings by interest Increased number of shares
Expected EPS $ 2.51 $1.91
Winfield Refuse Management 9
Earnings Per Share
Pre-acquisition EPS: $1.83
$0.00
$0.50
$1.00
$1.50
$2.00
$2.50
$3.00
$3.50
$46 $51 $56 $61 $66 $71 $76
EarningsPerShare
EBIT ($M)
Post-acquisition Earnings Per Share
EPS (Debt)
EPS(Equity)
EPS (Debt+Equity)
Expected
EBIT of
66M
Debt financing options provide the highest expected EPS under likely EBIT
scenarios.
• Adjusted EPS = (NI-principal repayment)/ number of shares
• Higher earnings per share with the bond option, even treating
principal repayments as “expenses”
Winfield Refuse Management 10
Adjusted Earnings Per Share
$0.00
$0.50
$1.00
$1.50
$2.00
$2.50
$3.00
AdjustedEarningsPerShare
EBIT ($M)
Adjusted Post-acquisition EPS
EPS( Debt, including principal
repayment)
EPS(Equity)
Expected
EBIT of
66M
Even with Principal Repayments included on an Adjusted EPS basis, EPS with
Debt Financing would be greater than EPS with Equity Financing
Winfield Refuse Management 11
Return of Equity
Debt Equity
Pros No impact on shares No impact on earnings
Cons Reduced earnings by interest Increased BV of equity
Expected
ROE
5.80% 5.25%
Pre-acquisition ROE: 4.01%
3.5%
4.0%
4.5%
5.0%
5.5%
6.0%
6.5%
7.0%
$46 $51 $56 $61 $66 $71 $76
ReturnonEquity(%)
EBIT ($M)
Post-acquisition ROE
ROE (Debt+Equity)
ROE(Equity)
ROE (Debt)Expected
EBIT of
66M
Debt financing options provide the highest expect ROE under likely EBIT
scenarios.
From Monte-Carlo Simulation (See Appendix):
• EBIT for any given year can range from $46M to $78M
• Retained earnings by FY2026 can range from $693M to $1,073M
1Debt service includes interest and principal repayment except for the bullet year
2Debt retirement refers to ability to pay back the principal by end of the term
Debt Service and Retirement Coverage
Winfield Refuse Management 12
1x
6x
11x
16x
21x
$46 $48 $50 $52 $54 $56 $58 $60
Combined Estimated EBIT (in $M)
Debt Service Coverage
Debt with Fixed Principal Repayment
Debt
75% Debt and 25% Equity
2x
7x
12x
17x
22x
27x
$693 $726 $759 $792 $825 $858
Estimated Retained Earnings by 2026 (in $M)
Debt Retirement Coverage
Debt with Fixed Principal Repayment Debt
Winfield can safely meet debt obligations under all financing alternatives.
Dividend Payout Coverage
Assuming Winfield continues to pay $1 dividend per share to all of its
shareholders in each financing option:
1Dividend to 15M existing shareholders plus additional shareholders needed for the respective
option.
Winfield Refuse Management 13
1x
2x
3x
46 48 50 52 54 56 58 60
Combined EBIT for any given year
Dividend Payout Coverage Ratio1
Debt with Fixed Principal Repayment Equity Debt 75% Debt and 25% Equity
Winfield can safely pay dividends to shareholders under all financing alternatives
• Other considerations
 By issuing debt, Winfield would avoid control dilution
 Flexibilities – sufficient cash flow to meet
commitments under all options
Winfield Refuse Management 14
Decision Criteria Debt
Debt with
Principal
Repayment
Equity
Debt (75%)
+ Equity
(25%)
Cost of Financing
(NPV)
Expected EPS
Expected ROE
Risk Tolerance
(Coverage)represents the better alternative represents the lesser alternative
Winfield should finance the $125M through issue of bonds with no principal
repayments
Evaluation of Options & Summary
Question & Answers
Thank you for listening to our presentation!
Concerns from Last Board Discussion
Concern Our View
Andrea Winfield Stock issue is lower cost and
additional debt would increase
risk leading to swings in stock
price
Stock issue is most expensive
option. Winfield can meet debt
obligations under varying EBIT
scenarios. In fact, debt will
increase EPS and ROE,
increasing stock price.
Joseph Winfield By issuing 7.5M shares, Winfield
will only have to pay $7.5M in
dividends
Debt cash outflows with debt is
for a finite period while stock
dividend outflows are perpetual
Ted Kale Market price is too low (based on
Price-to-book comparable).
Issuing shares at low price and
loss of management control is a
disservice to current
stockholders.
This is not the only criteria for
financing. Price may be low due
to a liquidity discount to trade
OTC. P/B is not comparable
when capital structure varies.
Joseph Tendi Principal repayment obligation is
irrelevant to the financing
decision
Principal repayment is relevant
because it is a real cash outflow
James Gitanga Other major companies have
long-term debt in capital structure
Analysis shows Winfield has the
capacity to take-on more debt in
Winfield Refuse Management 16
Appendix
Winfield Refuse Management Inc.
Summary of Financing Schedules
Winfield Refuse Management 18
Monte-Carlo Simulation: Estimated
Combined EBIT
Note: Standard Deviation was calculated from last 5 year performance.
Winfield Refuse Management 19
Std Dev Average
MIPS Before Tax 2,377 24,000
Winfield Before Tax 3,639 36,745
Monte-Carlo Simulation: Estimated
Retained Earnings in FY 2026
Winfield Refuse Management 20
Note: Ending Retained Earnings= Beginning Retained Earnings + Net Income – Divid
Net Income Standard Deviation=3.6
Cash outflows for debt options
Winfield Refuse Management 21
Debt with fixed principal repayments: Financing Cash Flow ($M)
2012 2013 2014 2015 2016 2017 2018 2019 2020 2021 2022 2023 2024 2025 2026
Debt 125.0 118.8 112.5 106.3 100.0 93.8 87.5 81.3 75.0 68.8 62.5 56.3 50.0 43.8 37.5
Principal Repayments 6.25 6.25 6.25 6.25 6.25 6.25 6.25 6.25 6.25 6.25 6.25 6.25 6.25 6.25 37.50
Interest 4.38 4.16 3.94 3.72 3.50 3.28 3.06 2.84 2.63 2.41 2.19 1.97 1.75 1.53 1.31
Debt Outstanding 118.75 112.50 106.25 100.00 93.75 87.50 81.25 75.00 68.75 62.50 56.25 50.00 43.75 37.50 -
Tax shield 1.53 1.45 1.38 1.30 1.23 1.15 1.07 1.00 0.92 0.84 0.77 0.69 0.61 0.54 0.46
Interest Payment after tax 2.84 2.70 2.56 2.42 2.28 2.13 1.99 1.85 1.71 1.56 1.42 1.28 1.14 1.00 0.85
Principal Repayments 6.25 6.25 6.25 6.25 6.25 6.25 6.25 6.25 6.25 6.25 6.25 6.25 6.25 6.25 37.50
Net Cash Outflow 9.09 8.95 8.81 8.67 8.53 8.38 8.24 8.10 7.96 7.81 7.67 7.53 7.39 7.25 38.35
NPV 113
Debt: Financing Cash Flow ($M)
2012 2013 2014 2015 2016 2017 2018 2019 2020 2021 2022 2023 2024 2025 2026
Debt 125.0 125.0 125.0 125.0 125.0 125.0 125.0 125.0 125.0 125.0 125.0 125.0 125.0 125.0 125.0
Principal Repayments - - - - - - - - - - - - - - 125.0
Interest 4.4 4.4 4.4 4.4 4.4 4.4 4.4 4.4 4.4 4.4 4.4 4.4 4.4 4.4 4.4
Debt Outstanding 125.0 125.0 125.0 125.0 125.0 125.0 125.0 125.0 125.0 125.0 125.0 125.0 125.0 125.0 -
Tax shield 1.5 1.5 1.5 1.5 1.5 1.5 1.5 1.5 1.5 1.5 1.5 1.5 1.5 1.5 1.5
Interest Payment after tax 2.8 2.8 2.8 2.8 2.8 2.8 2.8 2.8 2.8 2.8 2.8 2.8 2.8 2.8 2.8
Principal Repayments - - - - - - - - - - - - - - 125
Net Cash Outflow 2.8 2.8 2.8 2.8 2.8 2.8 2.8 2.8 2.8 2.8 2.8 2.8 2.8 2.8 127.8
NPV 107
Cash outflows for Equity options
Winfield Refuse Management 22
Equity: Financing Cash Flow ($M)
2012 2013 2014 2015 2016 2017 2018 2019 2020 2021 2022 2023 2024 2025 2026
Dividend Payout 7.5 7.5 7.5 7.5 7.5 7.5 7.5 7.5 7.5 7.5 7.5 7.5 7.5 7.5 7.5
TV 145
Div+TV 7.5 7.5 7.5 7.5 7.5 7.5 7.5 7.5 7.5 7.5 7.5 7.5 7.5 7.5 153
NPV 145
Equity and Debt: Financing Cash Flow ($M)
2012 2013 2014 2015 2016 2017 2018 2019 2020 2021 2022 2023 2024 2025 2026
Debt 93.8 93.8 93.8 93.8 93.8 93.8 93.8 93.8 93.8 93.8 93.8 93.8 93.8 93.8 93.8
Principal Repayments - - - - - - - - - - - - - - 94
Interest 3.3 3.3 3.3 3.3 3.3 3.3 3.3 3.3 3.3 3.3 3.3 3.3 3.3 3.3 3.3
Debt Outstanding 93.8 93.8 93.8 93.8 93.8 93.8 93.8 93.8 93.8 93.8 93.8 93.8 93.8 93.8 -
Tax shield 1.1 1.1 1.1 1.1 1.1 1.1 1.1 1.1 1.1 1.1 1.1 1.1 1.1 1.1 1.1
Interest Payment after tax 2.1 2.1 2.1 2.1 2.1 2.1 2.1 2.1 2.1 2.1 2.1 2.1 2.1 2.1 2.1
Principal Repayments - - - - - - - - - - - - - - 94
Net Cash Outflow 2.1 2.1 2.1 2.1 2.1 2.1 2.1 2.1 2.1 2.1 2.1 2.1 2.1 2.1 95.9
NPV of Debt 81
Cost of Financing (3.5% vs. 6.5%)
Winfield Refuse Management 23
$106
$98
$145
$110
$0
$20
$40
$60
$80
$100
$120
$140
$160
Debt with
fixed
principal
repayment
Debt Equity 75% Debt +
25% Equity
NPVofFnancingCosts($M)
NPV of Financing Alternatives
$113
$107
$145
$117
$0
$20
$40
$60
$80
$100
$120
$140
$160
Debt with
Fixed
Principal
Repayments
Debt Equity 75% Debt +
25% Equity
NPVofFnancingCosts($M)
NPV of Financing Alternatives
NPV @ 3.5% NPV @ 6.5%
Change in Interest from 3.5% to 6.5% yields the same financing decision.
EPS (with interest = 6.5%)
Winfield Refuse Management 24
-
0.50
1.00
1.50
2.00
2.50
3.00
3.50
$46.00
$47.00
$48.00
$49.00
$50.00
$51.00
$52.00
$53.00
$54.00
$55.00
$56.00
$57.00
$58.00
$59.00
$60.00
$61.00
$62.00
$63.00
$64.00
$65.00
$66.00
$67.00
$68.00
$69.00
$70.00
$71.00
Post-acquisition EPS
EPS (Debt)
EPS(Equity)
EPS (Debt+Equity)
Expected
EBIT of 66M
EBIT ($M)
Adjusted EPS (with interest = 6.5%)
Winfield Refuse Management 25
-
0.50
1.00
1.50
2.00
2.50
3.00
Adjusted Post-acquisition EPS
EPS( Debt, including
principal repayment)
EPS(Equity)
Expected
EBIT of
66M
ROE (with interest = 6.5%)
Winfield Refuse Management 26
4.0%
4.5%
5.0%
5.5%
6.0%
6.5%
$46.00
$47.00
$48.00
$49.00
$50.00
$51.00
$52.00
$53.00
$54.00
$55.00
$56.00
$57.00
$58.00
$59.00
$60.00
$61.00
$62.00
$63.00
$64.00
$65.00
$66.00
$67.00
$68.00
$69.00
$70.00
$71.00
Post-acquisition ROE
ROE
(Debt+Equity)
ROE(Equity)
ROE (Debt)
Expected
EBIT of
66M

More Related Content

What's hot

Eastboro case analysis
Eastboro case analysisEastboro case analysis
Eastboro case analysisFajar Muhammad
 
FIN4140 Corporate Finance: Marriott corporation case study solution
FIN4140 Corporate Finance: Marriott corporation case study solutionFIN4140 Corporate Finance: Marriott corporation case study solution
FIN4140 Corporate Finance: Marriott corporation case study solutionNURHANI MUIS
 
Marriott case
Marriott caseMarriott case
Marriott caseTHAO BUI
 
Marriott Corporation. Cost of Capital
Marriott Corporation. Cost of CapitalMarriott Corporation. Cost of Capital
Marriott Corporation. Cost of CapitalTurumbayevRassul
 
Case Study : Eco7-Launching a New Motor Oil
Case Study : Eco7-Launching a New Motor OilCase Study : Eco7-Launching a New Motor Oil
Case Study : Eco7-Launching a New Motor OilHafizullah Mohd Amin
 
Springfield Nor'easter's Case analysis and solution
Springfield Nor'easter's Case analysis and solutionSpringfield Nor'easter's Case analysis and solution
Springfield Nor'easter's Case analysis and solutionAswanth Varatharajan
 
Rosewood Hotels and Resorts: Branding to increase Customer Profitability and ...
Rosewood Hotels and Resorts: Branding to increase Customer Profitability and ...Rosewood Hotels and Resorts: Branding to increase Customer Profitability and ...
Rosewood Hotels and Resorts: Branding to increase Customer Profitability and ...Pallabh Bhura
 
Maynard company ppt
Maynard company pptMaynard company ppt
Maynard company pptNivin Vinoi
 
Acquisition of Mercury Athletic
Acquisition of Mercury AthleticAcquisition of Mercury Athletic
Acquisition of Mercury AthleticJB Gough
 
Presentation Case Tri Star - Final
Presentation Case Tri Star - FinalPresentation Case Tri Star - Final
Presentation Case Tri Star - FinalSpencer Cheung
 
Dell Computers (A) : Field Service for Corporate Clients
Dell Computers (A) : Field Service for Corporate Clients Dell Computers (A) : Field Service for Corporate Clients
Dell Computers (A) : Field Service for Corporate Clients Vijay Somu
 
Wilkerson Company Case
Wilkerson Company CaseWilkerson Company Case
Wilkerson Company CaseElla Shen
 
Natureview Farm - Harvard Case Study
Natureview Farm - Harvard Case StudyNatureview Farm - Harvard Case Study
Natureview Farm - Harvard Case StudySanthosh Kumar
 
The Cost of Capital
The Cost of CapitalThe Cost of Capital
The Cost of CapitalAnıl Sural
 
Case study kulicke and soffa industries inc - group 4
Case study   kulicke and soffa industries inc - group 4Case study   kulicke and soffa industries inc - group 4
Case study kulicke and soffa industries inc - group 4Piyush Sogra
 
Roche holding AG: Genentech Acquisition
Roche holding AG: Genentech AcquisitionRoche holding AG: Genentech Acquisition
Roche holding AG: Genentech AcquisitionAmara Fatima
 
Cola Wars Continue: Coke and Pepsi in 2010
Cola Wars Continue: Coke and Pepsi in 2010Cola Wars Continue: Coke and Pepsi in 2010
Cola Wars Continue: Coke and Pepsi in 2010Sharon
 

What's hot (20)

Eastboro case analysis
Eastboro case analysisEastboro case analysis
Eastboro case analysis
 
FIN4140 Corporate Finance: Marriott corporation case study solution
FIN4140 Corporate Finance: Marriott corporation case study solutionFIN4140 Corporate Finance: Marriott corporation case study solution
FIN4140 Corporate Finance: Marriott corporation case study solution
 
Marriott case
Marriott caseMarriott case
Marriott case
 
Marriott Corporation. Cost of Capital
Marriott Corporation. Cost of CapitalMarriott Corporation. Cost of Capital
Marriott Corporation. Cost of Capital
 
Case Study : Eco7-Launching a New Motor Oil
Case Study : Eco7-Launching a New Motor OilCase Study : Eco7-Launching a New Motor Oil
Case Study : Eco7-Launching a New Motor Oil
 
Springfield Nor'easter's Case analysis and solution
Springfield Nor'easter's Case analysis and solutionSpringfield Nor'easter's Case analysis and solution
Springfield Nor'easter's Case analysis and solution
 
Rosewood Hotels and Resorts: Branding to increase Customer Profitability and ...
Rosewood Hotels and Resorts: Branding to increase Customer Profitability and ...Rosewood Hotels and Resorts: Branding to increase Customer Profitability and ...
Rosewood Hotels and Resorts: Branding to increase Customer Profitability and ...
 
Financial Policy at Apple (A) 2013
Financial Policy at Apple (A) 2013Financial Policy at Apple (A) 2013
Financial Policy at Apple (A) 2013
 
Maynard company ppt
Maynard company pptMaynard company ppt
Maynard company ppt
 
Acquisition of Mercury Athletic
Acquisition of Mercury AthleticAcquisition of Mercury Athletic
Acquisition of Mercury Athletic
 
Presentation Case Tri Star - Final
Presentation Case Tri Star - FinalPresentation Case Tri Star - Final
Presentation Case Tri Star - Final
 
Dell Computers (A) : Field Service for Corporate Clients
Dell Computers (A) : Field Service for Corporate Clients Dell Computers (A) : Field Service for Corporate Clients
Dell Computers (A) : Field Service for Corporate Clients
 
Cost of Capital for Midland Energy Resources Inc.
Cost of Capital for Midland Energy Resources Inc.Cost of Capital for Midland Energy Resources Inc.
Cost of Capital for Midland Energy Resources Inc.
 
Wilkerson Company Case
Wilkerson Company CaseWilkerson Company Case
Wilkerson Company Case
 
Natureview Farm - Harvard Case Study
Natureview Farm - Harvard Case StudyNatureview Farm - Harvard Case Study
Natureview Farm - Harvard Case Study
 
The Cost of Capital
The Cost of CapitalThe Cost of Capital
The Cost of Capital
 
The Fashion Channel
The Fashion ChannelThe Fashion Channel
The Fashion Channel
 
Case study kulicke and soffa industries inc - group 4
Case study   kulicke and soffa industries inc - group 4Case study   kulicke and soffa industries inc - group 4
Case study kulicke and soffa industries inc - group 4
 
Roche holding AG: Genentech Acquisition
Roche holding AG: Genentech AcquisitionRoche holding AG: Genentech Acquisition
Roche holding AG: Genentech Acquisition
 
Cola Wars Continue: Coke and Pepsi in 2010
Cola Wars Continue: Coke and Pepsi in 2010Cola Wars Continue: Coke and Pepsi in 2010
Cola Wars Continue: Coke and Pepsi in 2010
 

Similar to Winfield Refuse Management Inc. Raising Debt vs. Equity

Baker Hill Prosper 2017 - Anatomy of a Profitable Loan: Before and After You ...
Baker Hill Prosper 2017 - Anatomy of a Profitable Loan: Before and After You ...Baker Hill Prosper 2017 - Anatomy of a Profitable Loan: Before and After You ...
Baker Hill Prosper 2017 - Anatomy of a Profitable Loan: Before and After You ...Baker Hill
 
JPM 2016 equity research
JPM 2016 equity researchJPM 2016 equity research
JPM 2016 equity researchAnthony Petalas
 
Risk And Return In Financial Management PowerPoint Presentation Slides
Risk And Return In Financial Management PowerPoint Presentation SlidesRisk And Return In Financial Management PowerPoint Presentation Slides
Risk And Return In Financial Management PowerPoint Presentation SlidesSlideTeam
 
Analysis of Financial Statements.(Ratio analysis, Du Pont system ,Effects of ...
Analysis of Financial Statements.(Ratio analysis, Du Pont system ,Effects of ...Analysis of Financial Statements.(Ratio analysis, Du Pont system ,Effects of ...
Analysis of Financial Statements.(Ratio analysis, Du Pont system ,Effects of ...Tanjin Tamanna urmi
 
Bendigo Bank (EBN) - finding an earnings base
Bendigo Bank (EBN) - finding an earnings base Bendigo Bank (EBN) - finding an earnings base
Bendigo Bank (EBN) - finding an earnings base George Gabriel
 
WSUV_CBA_Presentation
WSUV_CBA_PresentationWSUV_CBA_Presentation
WSUV_CBA_PresentationAttar Bhangal
 
Optimization Of Capital Structure Of Firm To Improve Profitability Complete Deck
Optimization Of Capital Structure Of Firm To Improve Profitability Complete DeckOptimization Of Capital Structure Of Firm To Improve Profitability Complete Deck
Optimization Of Capital Structure Of Firm To Improve Profitability Complete DeckSlideTeam
 
Paul Byron Hill, CFP walks investors through wealth preservation for income w...
Paul Byron Hill, CFP walks investors through wealth preservation for income w...Paul Byron Hill, CFP walks investors through wealth preservation for income w...
Paul Byron Hill, CFP walks investors through wealth preservation for income w...wsidehank
 
Q2 2009 Earning Report of Webster Financial Corp.
Q2 2009 Earning Report of Webster Financial Corp.Q2 2009 Earning Report of Webster Financial Corp.
Q2 2009 Earning Report of Webster Financial Corp.earningreport earningreport
 
First commonwealth stockpitch
First commonwealth stockpitchFirst commonwealth stockpitch
First commonwealth stockpitchMingshi Ji
 
Case 17,group-11
Case 17,group-11Case 17,group-11
Case 17,group-11sajeevbd
 
Capital structure and term structure
Capital structure and term structure Capital structure and term structure
Capital structure and term structure mabruka mohamed
 
Deposit mastery summit deck 2-6-2020 - jkd
Deposit mastery summit deck  2-6-2020 - jkdDeposit mastery summit deck  2-6-2020 - jkd
Deposit mastery summit deck 2-6-2020 - jkdJeff Davis
 
FIN623_Assessment Tool Page 1 of 6 Goldey-Beacom College.docx
FIN623_Assessment Tool Page 1 of 6 Goldey-Beacom College.docxFIN623_Assessment Tool Page 1 of 6 Goldey-Beacom College.docx
FIN623_Assessment Tool Page 1 of 6 Goldey-Beacom College.docxmydrynan
 
CFO Network – Business valuation
CFO Network – Business valuationCFO Network – Business valuation
CFO Network – Business valuationAzure Group
 
How To Become Your Own Bank
How To Become Your Own BankHow To Become Your Own Bank
How To Become Your Own BankKagan Financial
 

Similar to Winfield Refuse Management Inc. Raising Debt vs. Equity (20)

Baker Hill Prosper 2017 - Anatomy of a Profitable Loan: Before and After You ...
Baker Hill Prosper 2017 - Anatomy of a Profitable Loan: Before and After You ...Baker Hill Prosper 2017 - Anatomy of a Profitable Loan: Before and After You ...
Baker Hill Prosper 2017 - Anatomy of a Profitable Loan: Before and After You ...
 
Banking Sector
Banking SectorBanking Sector
Banking Sector
 
JPM 2016 equity research
JPM 2016 equity researchJPM 2016 equity research
JPM 2016 equity research
 
Group8 (1)
Group8 (1)Group8 (1)
Group8 (1)
 
synergy.ppt
synergy.pptsynergy.ppt
synergy.ppt
 
Risk And Return In Financial Management PowerPoint Presentation Slides
Risk And Return In Financial Management PowerPoint Presentation SlidesRisk And Return In Financial Management PowerPoint Presentation Slides
Risk And Return In Financial Management PowerPoint Presentation Slides
 
Analysis of Financial Statements.(Ratio analysis, Du Pont system ,Effects of ...
Analysis of Financial Statements.(Ratio analysis, Du Pont system ,Effects of ...Analysis of Financial Statements.(Ratio analysis, Du Pont system ,Effects of ...
Analysis of Financial Statements.(Ratio analysis, Du Pont system ,Effects of ...
 
Bendigo Bank (EBN) - finding an earnings base
Bendigo Bank (EBN) - finding an earnings base Bendigo Bank (EBN) - finding an earnings base
Bendigo Bank (EBN) - finding an earnings base
 
WSUV_CBA_Presentation
WSUV_CBA_PresentationWSUV_CBA_Presentation
WSUV_CBA_Presentation
 
BREW PP
BREW PPBREW PP
BREW PP
 
Optimization Of Capital Structure Of Firm To Improve Profitability Complete Deck
Optimization Of Capital Structure Of Firm To Improve Profitability Complete DeckOptimization Of Capital Structure Of Firm To Improve Profitability Complete Deck
Optimization Of Capital Structure Of Firm To Improve Profitability Complete Deck
 
Paul Byron Hill, CFP walks investors through wealth preservation for income w...
Paul Byron Hill, CFP walks investors through wealth preservation for income w...Paul Byron Hill, CFP walks investors through wealth preservation for income w...
Paul Byron Hill, CFP walks investors through wealth preservation for income w...
 
Q2 2009 Earning Report of Webster Financial Corp.
Q2 2009 Earning Report of Webster Financial Corp.Q2 2009 Earning Report of Webster Financial Corp.
Q2 2009 Earning Report of Webster Financial Corp.
 
First commonwealth stockpitch
First commonwealth stockpitchFirst commonwealth stockpitch
First commonwealth stockpitch
 
Case 17,group-11
Case 17,group-11Case 17,group-11
Case 17,group-11
 
Capital structure and term structure
Capital structure and term structure Capital structure and term structure
Capital structure and term structure
 
Deposit mastery summit deck 2-6-2020 - jkd
Deposit mastery summit deck  2-6-2020 - jkdDeposit mastery summit deck  2-6-2020 - jkd
Deposit mastery summit deck 2-6-2020 - jkd
 
FIN623_Assessment Tool Page 1 of 6 Goldey-Beacom College.docx
FIN623_Assessment Tool Page 1 of 6 Goldey-Beacom College.docxFIN623_Assessment Tool Page 1 of 6 Goldey-Beacom College.docx
FIN623_Assessment Tool Page 1 of 6 Goldey-Beacom College.docx
 
CFO Network – Business valuation
CFO Network – Business valuationCFO Network – Business valuation
CFO Network – Business valuation
 
How To Become Your Own Bank
How To Become Your Own BankHow To Become Your Own Bank
How To Become Your Own Bank
 

Recently uploaded

Simple, Complex, and Compound Sentences Exercises.pdf
Simple, Complex, and Compound Sentences Exercises.pdfSimple, Complex, and Compound Sentences Exercises.pdf
Simple, Complex, and Compound Sentences Exercises.pdfstareducators107
 
Single or Multiple melodic lines structure
Single or Multiple melodic lines structureSingle or Multiple melodic lines structure
Single or Multiple melodic lines structuredhanjurrannsibayan2
 
Google Gemini An AI Revolution in Education.pptx
Google Gemini An AI Revolution in Education.pptxGoogle Gemini An AI Revolution in Education.pptx
Google Gemini An AI Revolution in Education.pptxDr. Sarita Anand
 
Towards a code of practice for AI in AT.pptx
Towards a code of practice for AI in AT.pptxTowards a code of practice for AI in AT.pptx
Towards a code of practice for AI in AT.pptxJisc
 
How to setup Pycharm environment for Odoo 17.pptx
How to setup Pycharm environment for Odoo 17.pptxHow to setup Pycharm environment for Odoo 17.pptx
How to setup Pycharm environment for Odoo 17.pptxCeline George
 
80 ĐỀ THI THỬ TUYỂN SINH TIẾNG ANH VÀO 10 SỞ GD – ĐT THÀNH PHỐ HỒ CHÍ MINH NĂ...
80 ĐỀ THI THỬ TUYỂN SINH TIẾNG ANH VÀO 10 SỞ GD – ĐT THÀNH PHỐ HỒ CHÍ MINH NĂ...80 ĐỀ THI THỬ TUYỂN SINH TIẾNG ANH VÀO 10 SỞ GD – ĐT THÀNH PHỐ HỒ CHÍ MINH NĂ...
80 ĐỀ THI THỬ TUYỂN SINH TIẾNG ANH VÀO 10 SỞ GD – ĐT THÀNH PHỐ HỒ CHÍ MINH NĂ...Nguyen Thanh Tu Collection
 
How to Create and Manage Wizard in Odoo 17
How to Create and Manage Wizard in Odoo 17How to Create and Manage Wizard in Odoo 17
How to Create and Manage Wizard in Odoo 17Celine George
 
Beyond_Borders_Understanding_Anime_and_Manga_Fandom_A_Comprehensive_Audience_...
Beyond_Borders_Understanding_Anime_and_Manga_Fandom_A_Comprehensive_Audience_...Beyond_Borders_Understanding_Anime_and_Manga_Fandom_A_Comprehensive_Audience_...
Beyond_Borders_Understanding_Anime_and_Manga_Fandom_A_Comprehensive_Audience_...Pooja Bhuva
 
Basic Civil Engineering first year Notes- Chapter 4 Building.pptx
Basic Civil Engineering first year Notes- Chapter 4 Building.pptxBasic Civil Engineering first year Notes- Chapter 4 Building.pptx
Basic Civil Engineering first year Notes- Chapter 4 Building.pptxDenish Jangid
 
Unit 3 Emotional Intelligence and Spiritual Intelligence.pdf
Unit 3 Emotional Intelligence and Spiritual Intelligence.pdfUnit 3 Emotional Intelligence and Spiritual Intelligence.pdf
Unit 3 Emotional Intelligence and Spiritual Intelligence.pdfDr Vijay Vishwakarma
 
AIM of Education-Teachers Training-2024.ppt
AIM of Education-Teachers Training-2024.pptAIM of Education-Teachers Training-2024.ppt
AIM of Education-Teachers Training-2024.pptNishitharanjan Rout
 
NO1 Top Black Magic Specialist In Lahore Black magic In Pakistan Kala Ilam Ex...
NO1 Top Black Magic Specialist In Lahore Black magic In Pakistan Kala Ilam Ex...NO1 Top Black Magic Specialist In Lahore Black magic In Pakistan Kala Ilam Ex...
NO1 Top Black Magic Specialist In Lahore Black magic In Pakistan Kala Ilam Ex...Amil baba
 
Sensory_Experience_and_Emotional_Resonance_in_Gabriel_Okaras_The_Piano_and_Th...
Sensory_Experience_and_Emotional_Resonance_in_Gabriel_Okaras_The_Piano_and_Th...Sensory_Experience_and_Emotional_Resonance_in_Gabriel_Okaras_The_Piano_and_Th...
Sensory_Experience_and_Emotional_Resonance_in_Gabriel_Okaras_The_Piano_and_Th...Pooja Bhuva
 
Philosophy of china and it's charactistics
Philosophy of china and it's charactisticsPhilosophy of china and it's charactistics
Philosophy of china and it's charactisticshameyhk98
 
How to Add a Tool Tip to a Field in Odoo 17
How to Add a Tool Tip to a Field in Odoo 17How to Add a Tool Tip to a Field in Odoo 17
How to Add a Tool Tip to a Field in Odoo 17Celine George
 
Food safety_Challenges food safety laboratories_.pdf
Food safety_Challenges food safety laboratories_.pdfFood safety_Challenges food safety laboratories_.pdf
Food safety_Challenges food safety laboratories_.pdfSherif Taha
 
SOC 101 Demonstration of Learning Presentation
SOC 101 Demonstration of Learning PresentationSOC 101 Demonstration of Learning Presentation
SOC 101 Demonstration of Learning Presentationcamerronhm
 
Understanding Accommodations and Modifications
Understanding  Accommodations and ModificationsUnderstanding  Accommodations and Modifications
Understanding Accommodations and ModificationsMJDuyan
 
HMCS Max Bernays Pre-Deployment Brief (May 2024).pptx
HMCS Max Bernays Pre-Deployment Brief (May 2024).pptxHMCS Max Bernays Pre-Deployment Brief (May 2024).pptx
HMCS Max Bernays Pre-Deployment Brief (May 2024).pptxEsquimalt MFRC
 
Interdisciplinary_Insights_Data_Collection_Methods.pptx
Interdisciplinary_Insights_Data_Collection_Methods.pptxInterdisciplinary_Insights_Data_Collection_Methods.pptx
Interdisciplinary_Insights_Data_Collection_Methods.pptxPooja Bhuva
 

Recently uploaded (20)

Simple, Complex, and Compound Sentences Exercises.pdf
Simple, Complex, and Compound Sentences Exercises.pdfSimple, Complex, and Compound Sentences Exercises.pdf
Simple, Complex, and Compound Sentences Exercises.pdf
 
Single or Multiple melodic lines structure
Single or Multiple melodic lines structureSingle or Multiple melodic lines structure
Single or Multiple melodic lines structure
 
Google Gemini An AI Revolution in Education.pptx
Google Gemini An AI Revolution in Education.pptxGoogle Gemini An AI Revolution in Education.pptx
Google Gemini An AI Revolution in Education.pptx
 
Towards a code of practice for AI in AT.pptx
Towards a code of practice for AI in AT.pptxTowards a code of practice for AI in AT.pptx
Towards a code of practice for AI in AT.pptx
 
How to setup Pycharm environment for Odoo 17.pptx
How to setup Pycharm environment for Odoo 17.pptxHow to setup Pycharm environment for Odoo 17.pptx
How to setup Pycharm environment for Odoo 17.pptx
 
80 ĐỀ THI THỬ TUYỂN SINH TIẾNG ANH VÀO 10 SỞ GD – ĐT THÀNH PHỐ HỒ CHÍ MINH NĂ...
80 ĐỀ THI THỬ TUYỂN SINH TIẾNG ANH VÀO 10 SỞ GD – ĐT THÀNH PHỐ HỒ CHÍ MINH NĂ...80 ĐỀ THI THỬ TUYỂN SINH TIẾNG ANH VÀO 10 SỞ GD – ĐT THÀNH PHỐ HỒ CHÍ MINH NĂ...
80 ĐỀ THI THỬ TUYỂN SINH TIẾNG ANH VÀO 10 SỞ GD – ĐT THÀNH PHỐ HỒ CHÍ MINH NĂ...
 
How to Create and Manage Wizard in Odoo 17
How to Create and Manage Wizard in Odoo 17How to Create and Manage Wizard in Odoo 17
How to Create and Manage Wizard in Odoo 17
 
Beyond_Borders_Understanding_Anime_and_Manga_Fandom_A_Comprehensive_Audience_...
Beyond_Borders_Understanding_Anime_and_Manga_Fandom_A_Comprehensive_Audience_...Beyond_Borders_Understanding_Anime_and_Manga_Fandom_A_Comprehensive_Audience_...
Beyond_Borders_Understanding_Anime_and_Manga_Fandom_A_Comprehensive_Audience_...
 
Basic Civil Engineering first year Notes- Chapter 4 Building.pptx
Basic Civil Engineering first year Notes- Chapter 4 Building.pptxBasic Civil Engineering first year Notes- Chapter 4 Building.pptx
Basic Civil Engineering first year Notes- Chapter 4 Building.pptx
 
Unit 3 Emotional Intelligence and Spiritual Intelligence.pdf
Unit 3 Emotional Intelligence and Spiritual Intelligence.pdfUnit 3 Emotional Intelligence and Spiritual Intelligence.pdf
Unit 3 Emotional Intelligence and Spiritual Intelligence.pdf
 
AIM of Education-Teachers Training-2024.ppt
AIM of Education-Teachers Training-2024.pptAIM of Education-Teachers Training-2024.ppt
AIM of Education-Teachers Training-2024.ppt
 
NO1 Top Black Magic Specialist In Lahore Black magic In Pakistan Kala Ilam Ex...
NO1 Top Black Magic Specialist In Lahore Black magic In Pakistan Kala Ilam Ex...NO1 Top Black Magic Specialist In Lahore Black magic In Pakistan Kala Ilam Ex...
NO1 Top Black Magic Specialist In Lahore Black magic In Pakistan Kala Ilam Ex...
 
Sensory_Experience_and_Emotional_Resonance_in_Gabriel_Okaras_The_Piano_and_Th...
Sensory_Experience_and_Emotional_Resonance_in_Gabriel_Okaras_The_Piano_and_Th...Sensory_Experience_and_Emotional_Resonance_in_Gabriel_Okaras_The_Piano_and_Th...
Sensory_Experience_and_Emotional_Resonance_in_Gabriel_Okaras_The_Piano_and_Th...
 
Philosophy of china and it's charactistics
Philosophy of china and it's charactisticsPhilosophy of china and it's charactistics
Philosophy of china and it's charactistics
 
How to Add a Tool Tip to a Field in Odoo 17
How to Add a Tool Tip to a Field in Odoo 17How to Add a Tool Tip to a Field in Odoo 17
How to Add a Tool Tip to a Field in Odoo 17
 
Food safety_Challenges food safety laboratories_.pdf
Food safety_Challenges food safety laboratories_.pdfFood safety_Challenges food safety laboratories_.pdf
Food safety_Challenges food safety laboratories_.pdf
 
SOC 101 Demonstration of Learning Presentation
SOC 101 Demonstration of Learning PresentationSOC 101 Demonstration of Learning Presentation
SOC 101 Demonstration of Learning Presentation
 
Understanding Accommodations and Modifications
Understanding  Accommodations and ModificationsUnderstanding  Accommodations and Modifications
Understanding Accommodations and Modifications
 
HMCS Max Bernays Pre-Deployment Brief (May 2024).pptx
HMCS Max Bernays Pre-Deployment Brief (May 2024).pptxHMCS Max Bernays Pre-Deployment Brief (May 2024).pptx
HMCS Max Bernays Pre-Deployment Brief (May 2024).pptx
 
Interdisciplinary_Insights_Data_Collection_Methods.pptx
Interdisciplinary_Insights_Data_Collection_Methods.pptxInterdisciplinary_Insights_Data_Collection_Methods.pptx
Interdisciplinary_Insights_Data_Collection_Methods.pptx
 

Winfield Refuse Management Inc. Raising Debt vs. Equity

  • 1. Winfield Refuse Management Inc. Raising Debt vs. Equity Iris Chen Alex Ho Brian Huang Pramod Jindal Michael Trecroce
  • 2. Executive Summary Objective Alternatives Recommendation Criteria What is the best financing option for the $125M acquisition of Mott-Pliese Integrated Solutions (MPIS)? 1. Debt with Fixed Principal Repayments 2. Debt 3. Equity 4. Debt & Equity Winfield should finance the $125M through issue of bonds with no principal repayments Impact on Firm: • Total Cost of Financing (NPV) Impact on Shareholders: • EPS & ROE Risk Tolerance: • Interest coverage, Debt coverage, Dividend coverage Winfield Refuse Management 2
  • 3. Introduction Winfield MPIS Winfield + MPIS $27M $15M $42M Midwest Mid-Atlantic & Midwest Midwest & Mid- Atlantic + = Net Income Net Income Net Income Region Region Region Winfield Refuse Management 3
  • 4. Winfield’s Current Financial Position 50% 50% Industry: Debt-to-Equity Equity Debt 79% 21% Winfield: 100% Equity Ownership Winfield Family OTC $0.00 $0.50 $1.00 $1.50 $2.00 2006 2007 2008 2009 2010 2011 2012E $/Share EPS and Dividends DPS Winfield Refuse Management 4 $0 $10 $20 $30 $40 $50 $0 $100 $200 $300 $400 $500 2006 2007 2008 2009 2010 2011 2012E NetIncome($M) Revenue($M) Winfield’s Revenue and Net Income Revenue Net Income
  • 5. Financing Alternatives 1. Debt with Fixed Principal Repayments  15 years  6.5% interest rate  $6.25M annual principal payment Capital Needs: $125M 2. Debt  15 years  6.5% interest rate  Full principal paid at Year 15 8.13 2.44 6.25 6.25 37.50 0 5 10 15 20 25 30 35 40 45 CashOutflows($M) Year Debt with Fixed Principal Repayment Schedule Interest Principal 8.13 125.00 0 20 40 60 80 100 120 140 CashOutflows($M) Year Debt Schedule Interest Principal Winfield Refuse Management 5
  • 6. Financing Alternatives Continued: 7.50 0 20 40 60 80 100 120 140 160 180 CashOutflows($M) Year Dividend Payout Schedule Dividend Dividend Terminal Value Interest: 6.09 Principal: 93.75 Dividend: 1.87 0 20 40 60 80 100 120 140 160 CashOutflows($M) Year Debt (75%) and Equity (25%) Schedule Interest Principal Dividend Dividend Terminal Value Winfield Refuse Management 6 3. Equity  7.5M new shares @ $17.75  Perpetual Dividend Payments  Dividend Policy is $1.00/Share Capital Needs: $125M 4. Debt & Equity  25% equity, 75% debt  1.87M new shares @ $17.75  Perpetual Dividend Payments  Dividend Policy is $1.00/Share
  • 7. Decision Criteria Impact on Firm: • Total Cost of Financing (NPV) Impact on Shareholders: • Earnings Per Share • Return on Equity Risk Tolerance: • Interest coverage • Debt coverage • Dividend coverage Winfield Refuse Management 7
  • 8. Cost of Financing (NPV)1 Among all the financing options considered, Debt (with no principal repayments) has the lowest NPV cost whereas Equity has the highest NPV cost. 1NPV mentioned here represents the cost of financing cost and the lower NPV implies cheaper financing 2Cost of Equity was calculated using CAPM formula 3Cost of Debt of 3.5% (Prime in 2012) was used rather than Initial Cost of Debt (i.e., 6.5% in 2012) Winfield Refuse Management 8 $113 $107 $145 $117 $0 $20 $40 $60 $80 $100 $120 $140 $160 Debt with Fixed Principal Repayments Debt Equity 75% Debt + 25% Equity NPVofFnancingCosts($M) NPV of Financing Alternatives Assumptions Marginal Tax Rate 35% Beta 0.36 Market Risk Premium 6% Risk-free Rate (Rf) 3% Cost of Equity2 (Ke) 5% Cost of Debt3 (Kd) 3.5% Time horizon (Years) 15 Dividend per share $1
  • 9. Debt Equity Pros No impact on shares No impact on earnings Cons Reduced earnings by interest Increased number of shares Expected EPS $ 2.51 $1.91 Winfield Refuse Management 9 Earnings Per Share Pre-acquisition EPS: $1.83 $0.00 $0.50 $1.00 $1.50 $2.00 $2.50 $3.00 $3.50 $46 $51 $56 $61 $66 $71 $76 EarningsPerShare EBIT ($M) Post-acquisition Earnings Per Share EPS (Debt) EPS(Equity) EPS (Debt+Equity) Expected EBIT of 66M Debt financing options provide the highest expected EPS under likely EBIT scenarios.
  • 10. • Adjusted EPS = (NI-principal repayment)/ number of shares • Higher earnings per share with the bond option, even treating principal repayments as “expenses” Winfield Refuse Management 10 Adjusted Earnings Per Share $0.00 $0.50 $1.00 $1.50 $2.00 $2.50 $3.00 AdjustedEarningsPerShare EBIT ($M) Adjusted Post-acquisition EPS EPS( Debt, including principal repayment) EPS(Equity) Expected EBIT of 66M Even with Principal Repayments included on an Adjusted EPS basis, EPS with Debt Financing would be greater than EPS with Equity Financing
  • 11. Winfield Refuse Management 11 Return of Equity Debt Equity Pros No impact on shares No impact on earnings Cons Reduced earnings by interest Increased BV of equity Expected ROE 5.80% 5.25% Pre-acquisition ROE: 4.01% 3.5% 4.0% 4.5% 5.0% 5.5% 6.0% 6.5% 7.0% $46 $51 $56 $61 $66 $71 $76 ReturnonEquity(%) EBIT ($M) Post-acquisition ROE ROE (Debt+Equity) ROE(Equity) ROE (Debt)Expected EBIT of 66M Debt financing options provide the highest expect ROE under likely EBIT scenarios.
  • 12. From Monte-Carlo Simulation (See Appendix): • EBIT for any given year can range from $46M to $78M • Retained earnings by FY2026 can range from $693M to $1,073M 1Debt service includes interest and principal repayment except for the bullet year 2Debt retirement refers to ability to pay back the principal by end of the term Debt Service and Retirement Coverage Winfield Refuse Management 12 1x 6x 11x 16x 21x $46 $48 $50 $52 $54 $56 $58 $60 Combined Estimated EBIT (in $M) Debt Service Coverage Debt with Fixed Principal Repayment Debt 75% Debt and 25% Equity 2x 7x 12x 17x 22x 27x $693 $726 $759 $792 $825 $858 Estimated Retained Earnings by 2026 (in $M) Debt Retirement Coverage Debt with Fixed Principal Repayment Debt Winfield can safely meet debt obligations under all financing alternatives.
  • 13. Dividend Payout Coverage Assuming Winfield continues to pay $1 dividend per share to all of its shareholders in each financing option: 1Dividend to 15M existing shareholders plus additional shareholders needed for the respective option. Winfield Refuse Management 13 1x 2x 3x 46 48 50 52 54 56 58 60 Combined EBIT for any given year Dividend Payout Coverage Ratio1 Debt with Fixed Principal Repayment Equity Debt 75% Debt and 25% Equity Winfield can safely pay dividends to shareholders under all financing alternatives
  • 14. • Other considerations  By issuing debt, Winfield would avoid control dilution  Flexibilities – sufficient cash flow to meet commitments under all options Winfield Refuse Management 14 Decision Criteria Debt Debt with Principal Repayment Equity Debt (75%) + Equity (25%) Cost of Financing (NPV) Expected EPS Expected ROE Risk Tolerance (Coverage)represents the better alternative represents the lesser alternative Winfield should finance the $125M through issue of bonds with no principal repayments Evaluation of Options & Summary
  • 15. Question & Answers Thank you for listening to our presentation!
  • 16. Concerns from Last Board Discussion Concern Our View Andrea Winfield Stock issue is lower cost and additional debt would increase risk leading to swings in stock price Stock issue is most expensive option. Winfield can meet debt obligations under varying EBIT scenarios. In fact, debt will increase EPS and ROE, increasing stock price. Joseph Winfield By issuing 7.5M shares, Winfield will only have to pay $7.5M in dividends Debt cash outflows with debt is for a finite period while stock dividend outflows are perpetual Ted Kale Market price is too low (based on Price-to-book comparable). Issuing shares at low price and loss of management control is a disservice to current stockholders. This is not the only criteria for financing. Price may be low due to a liquidity discount to trade OTC. P/B is not comparable when capital structure varies. Joseph Tendi Principal repayment obligation is irrelevant to the financing decision Principal repayment is relevant because it is a real cash outflow James Gitanga Other major companies have long-term debt in capital structure Analysis shows Winfield has the capacity to take-on more debt in Winfield Refuse Management 16
  • 18. Summary of Financing Schedules Winfield Refuse Management 18
  • 19. Monte-Carlo Simulation: Estimated Combined EBIT Note: Standard Deviation was calculated from last 5 year performance. Winfield Refuse Management 19 Std Dev Average MIPS Before Tax 2,377 24,000 Winfield Before Tax 3,639 36,745
  • 20. Monte-Carlo Simulation: Estimated Retained Earnings in FY 2026 Winfield Refuse Management 20 Note: Ending Retained Earnings= Beginning Retained Earnings + Net Income – Divid Net Income Standard Deviation=3.6
  • 21. Cash outflows for debt options Winfield Refuse Management 21 Debt with fixed principal repayments: Financing Cash Flow ($M) 2012 2013 2014 2015 2016 2017 2018 2019 2020 2021 2022 2023 2024 2025 2026 Debt 125.0 118.8 112.5 106.3 100.0 93.8 87.5 81.3 75.0 68.8 62.5 56.3 50.0 43.8 37.5 Principal Repayments 6.25 6.25 6.25 6.25 6.25 6.25 6.25 6.25 6.25 6.25 6.25 6.25 6.25 6.25 37.50 Interest 4.38 4.16 3.94 3.72 3.50 3.28 3.06 2.84 2.63 2.41 2.19 1.97 1.75 1.53 1.31 Debt Outstanding 118.75 112.50 106.25 100.00 93.75 87.50 81.25 75.00 68.75 62.50 56.25 50.00 43.75 37.50 - Tax shield 1.53 1.45 1.38 1.30 1.23 1.15 1.07 1.00 0.92 0.84 0.77 0.69 0.61 0.54 0.46 Interest Payment after tax 2.84 2.70 2.56 2.42 2.28 2.13 1.99 1.85 1.71 1.56 1.42 1.28 1.14 1.00 0.85 Principal Repayments 6.25 6.25 6.25 6.25 6.25 6.25 6.25 6.25 6.25 6.25 6.25 6.25 6.25 6.25 37.50 Net Cash Outflow 9.09 8.95 8.81 8.67 8.53 8.38 8.24 8.10 7.96 7.81 7.67 7.53 7.39 7.25 38.35 NPV 113 Debt: Financing Cash Flow ($M) 2012 2013 2014 2015 2016 2017 2018 2019 2020 2021 2022 2023 2024 2025 2026 Debt 125.0 125.0 125.0 125.0 125.0 125.0 125.0 125.0 125.0 125.0 125.0 125.0 125.0 125.0 125.0 Principal Repayments - - - - - - - - - - - - - - 125.0 Interest 4.4 4.4 4.4 4.4 4.4 4.4 4.4 4.4 4.4 4.4 4.4 4.4 4.4 4.4 4.4 Debt Outstanding 125.0 125.0 125.0 125.0 125.0 125.0 125.0 125.0 125.0 125.0 125.0 125.0 125.0 125.0 - Tax shield 1.5 1.5 1.5 1.5 1.5 1.5 1.5 1.5 1.5 1.5 1.5 1.5 1.5 1.5 1.5 Interest Payment after tax 2.8 2.8 2.8 2.8 2.8 2.8 2.8 2.8 2.8 2.8 2.8 2.8 2.8 2.8 2.8 Principal Repayments - - - - - - - - - - - - - - 125 Net Cash Outflow 2.8 2.8 2.8 2.8 2.8 2.8 2.8 2.8 2.8 2.8 2.8 2.8 2.8 2.8 127.8 NPV 107
  • 22. Cash outflows for Equity options Winfield Refuse Management 22 Equity: Financing Cash Flow ($M) 2012 2013 2014 2015 2016 2017 2018 2019 2020 2021 2022 2023 2024 2025 2026 Dividend Payout 7.5 7.5 7.5 7.5 7.5 7.5 7.5 7.5 7.5 7.5 7.5 7.5 7.5 7.5 7.5 TV 145 Div+TV 7.5 7.5 7.5 7.5 7.5 7.5 7.5 7.5 7.5 7.5 7.5 7.5 7.5 7.5 153 NPV 145 Equity and Debt: Financing Cash Flow ($M) 2012 2013 2014 2015 2016 2017 2018 2019 2020 2021 2022 2023 2024 2025 2026 Debt 93.8 93.8 93.8 93.8 93.8 93.8 93.8 93.8 93.8 93.8 93.8 93.8 93.8 93.8 93.8 Principal Repayments - - - - - - - - - - - - - - 94 Interest 3.3 3.3 3.3 3.3 3.3 3.3 3.3 3.3 3.3 3.3 3.3 3.3 3.3 3.3 3.3 Debt Outstanding 93.8 93.8 93.8 93.8 93.8 93.8 93.8 93.8 93.8 93.8 93.8 93.8 93.8 93.8 - Tax shield 1.1 1.1 1.1 1.1 1.1 1.1 1.1 1.1 1.1 1.1 1.1 1.1 1.1 1.1 1.1 Interest Payment after tax 2.1 2.1 2.1 2.1 2.1 2.1 2.1 2.1 2.1 2.1 2.1 2.1 2.1 2.1 2.1 Principal Repayments - - - - - - - - - - - - - - 94 Net Cash Outflow 2.1 2.1 2.1 2.1 2.1 2.1 2.1 2.1 2.1 2.1 2.1 2.1 2.1 2.1 95.9 NPV of Debt 81
  • 23. Cost of Financing (3.5% vs. 6.5%) Winfield Refuse Management 23 $106 $98 $145 $110 $0 $20 $40 $60 $80 $100 $120 $140 $160 Debt with fixed principal repayment Debt Equity 75% Debt + 25% Equity NPVofFnancingCosts($M) NPV of Financing Alternatives $113 $107 $145 $117 $0 $20 $40 $60 $80 $100 $120 $140 $160 Debt with Fixed Principal Repayments Debt Equity 75% Debt + 25% Equity NPVofFnancingCosts($M) NPV of Financing Alternatives NPV @ 3.5% NPV @ 6.5% Change in Interest from 3.5% to 6.5% yields the same financing decision.
  • 24. EPS (with interest = 6.5%) Winfield Refuse Management 24 - 0.50 1.00 1.50 2.00 2.50 3.00 3.50 $46.00 $47.00 $48.00 $49.00 $50.00 $51.00 $52.00 $53.00 $54.00 $55.00 $56.00 $57.00 $58.00 $59.00 $60.00 $61.00 $62.00 $63.00 $64.00 $65.00 $66.00 $67.00 $68.00 $69.00 $70.00 $71.00 Post-acquisition EPS EPS (Debt) EPS(Equity) EPS (Debt+Equity) Expected EBIT of 66M EBIT ($M)
  • 25. Adjusted EPS (with interest = 6.5%) Winfield Refuse Management 25 - 0.50 1.00 1.50 2.00 2.50 3.00 Adjusted Post-acquisition EPS EPS( Debt, including principal repayment) EPS(Equity) Expected EBIT of 66M
  • 26. ROE (with interest = 6.5%) Winfield Refuse Management 26 4.0% 4.5% 5.0% 5.5% 6.0% 6.5% $46.00 $47.00 $48.00 $49.00 $50.00 $51.00 $52.00 $53.00 $54.00 $55.00 $56.00 $57.00 $58.00 $59.00 $60.00 $61.00 $62.00 $63.00 $64.00 $65.00 $66.00 $67.00 $68.00 $69.00 $70.00 $71.00 Post-acquisition ROE ROE (Debt+Equity) ROE(Equity) ROE (Debt) Expected EBIT of 66M