This document discusses radiative processes in electronically excited states, including fluorescence and phosphorescence. It provides definitions and explanations of key concepts:
- Fluorescence occurs between states of the same spin multiplicity and is fast, while phosphorescence occurs between states of different spin multiplicity and is slower.
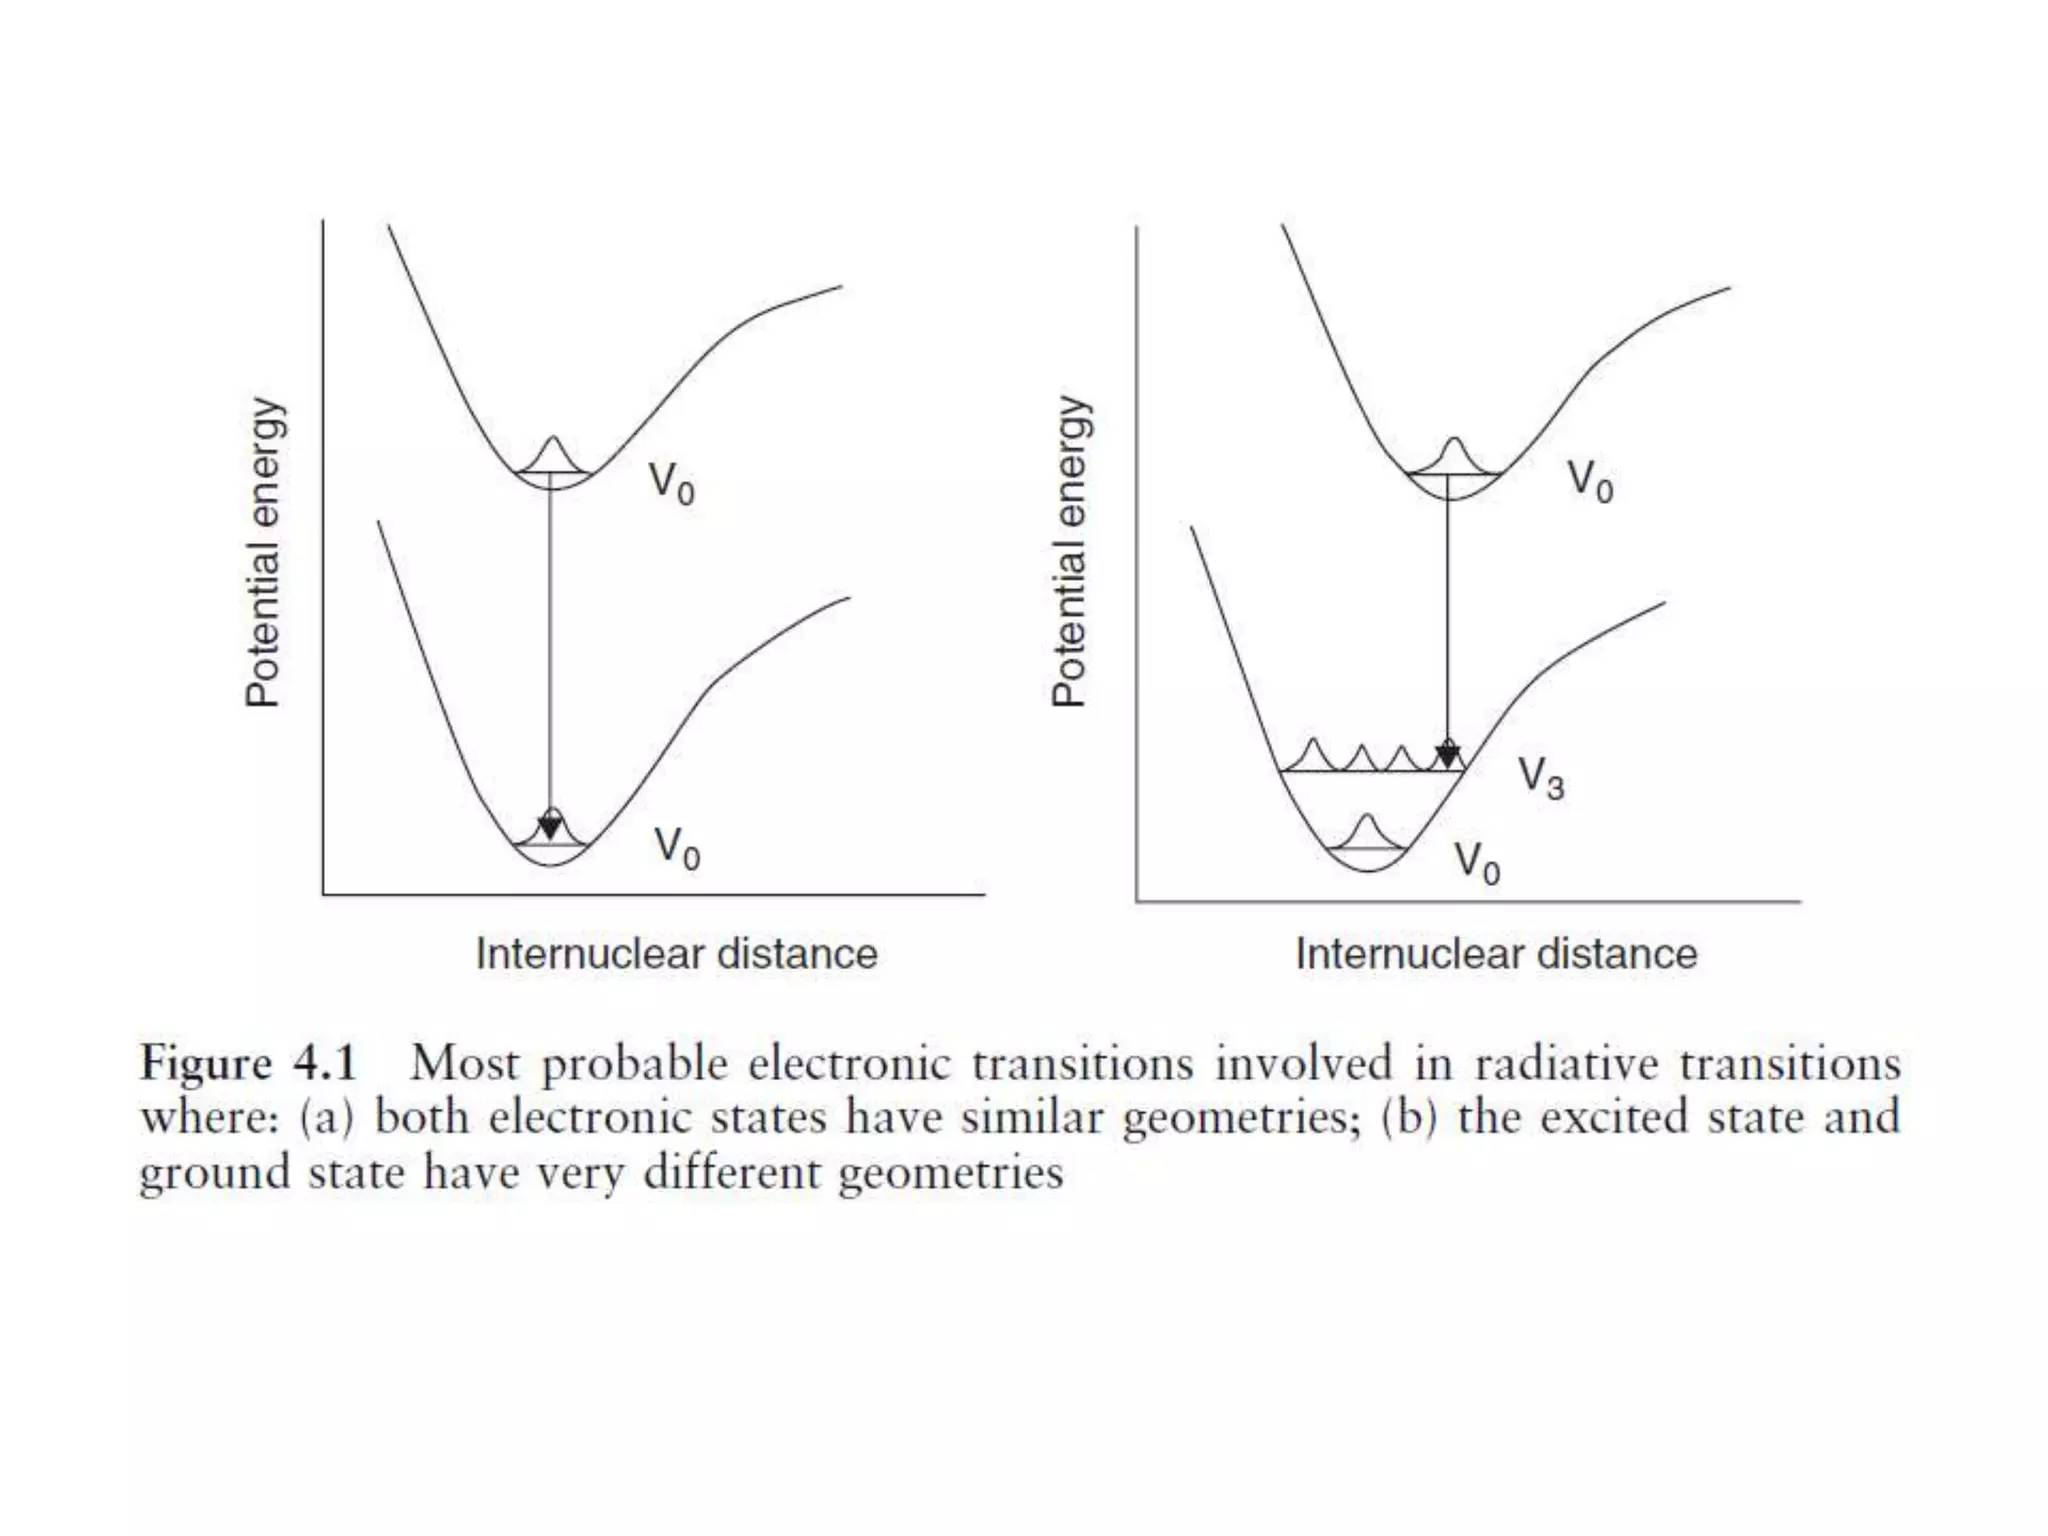
- Radiative transitions follow the Franck-Condon principle and vertical transitions.
- Mirror-image symmetry exists between absorption and fluorescence emission spectra when the ground and excited state geometries are similar.
- Exceptions to Kasha's rule exist, such as the fluorescence from the S2 state in azulene.
- Factors like molecular rigidity, substituent groups, and heavy atoms can influence fluorescence behavior and


![Fluorimetry-M0dern pharmaceutical analysis[1].pptx](https://cdn.slidesharecdn.com/ss_thumbnails/fluorimetry-mpat1-240203124524-d3456e52-thumbnail.jpg?width=640&height=640&fit=bounds)


