Microsoft R server for distributed computing โดย กฤษฏิ์ คำตื้อ Technical Evangelist Microsoft (Thailand) Limited ในงาน THE FIRST NIDA BUSINESS ANALYTICS AND DATA SCIENCES CONTEST/CONFERENCE จัดโดย คณะสถิติประยุกต์และ DATA SCIENCES THAILAND
27 Aug 2013 Webinar High Performance Predictive Analytics in Hadoop and R presented by Mario E. Inchiosa, PhD., US Data Scientist and Kathleen Rohrecker, Director of Product Marketing
TWDI Accelerate Seattle, Oct 16, 2017: Distributed and In-Database Analytics ...Debraj GuhaThakurta
Event: TDWI Accelerate Seattle, October 16, 2017
Topic: Distributed and In-Database Analytics with R
Presenter: Debraj GuhaThakurta
Description: How to develop scalable and in-DB analytics using R in Spark and SQL-Server
Quick and Dirty: Scaling Out Predictive Models Using Revolution Analytics on ...Revolution Analytics
[Presentation by Skylar Lyon at DataWeek 2014, September 17 2014.]
I recently faced the task of how to scale out an existing analytics process. The schedule was compressed - it always is in my world. The data was big - 400+ million rows waiting in database. What did I do? I offered my favorite type of solution - quick and dirty.
At the outset, I wasn't sure how easy it would be. Nor was I certain of realized performance gains. But the concept seemed sound and the exercise fun. Let's move the compute to the data via Revolution R Enterprise for Teradata.
This presentation outlines my approach in leveraging a colleague's R models as I experimented with running R in-database. Would my path lead to significant improvement? Could it be used to productionalize the workflow?
Model Building with RevoScaleR: Using R and Hadoop for Statistical ComputationRevolution Analytics
Slides from Joseph Rickert's presentation at Strata NYC 2013
"Using R and Hadoop for Statistical Computation at Scale"
http://strataconf.com/stratany2013/public/schedule/detail/30632
High Performance Predictive Analytics in R and HadoopDataWorks Summit
Hadoop is rapidly being adopted as a major platform for storing and managing massive amounts of data, and for computing descriptive and query types of analytics on that data. However, it has a reputation for not being a suitable environment for high performance complex iterative algorithms such as logistic regression, generalized linear models, and decision trees. At Revolution Analytics we think that reputation is unjustified, and in this talk I discuss the approach we have taken to porting our suite of High Performance Analytics algorithms to run natively and efficiently in Hadoop. Our algorithms are written in C++ and R, and are based on a platform that automatically and efficiently parallelizes a broad class of algorithms called Parallel External Memory Algorithms (PEMA’s). This platform abstracts both the inter-process communication layer and the data source layer, so that the algorithms can work in almost any environment in which messages can be passed among processes and with almost any data source. MPI and RPC are two traditional ways to send messages, but messages can also be passed using files, as in Hadoop. I describe how we use the file-based communication choreographed by MapReduce and how we efficiently access data stored in HDFS.
Presto: Optimizing Performance of SQL-on-Anything EngineDataWorks Summit
Presto, an open source distributed SQL engine, is widely recognized for its low-latency queries, high concurrency, and native ability to query multiple data sources. Proven at scale in a variety of use cases at Airbnb, Bloomberg, Comcast, Facebook, FINRA, LinkedIn, Lyft, Netflix, Twitter, and Uber, in the last few years Presto experienced an unprecedented growth in popularity in both on-premises and cloud deployments over Object Stores, HDFS, NoSQL and RDBMS data stores.
With the ever-growing list of connectors to new data sources such as Azure Blob Storage, Elasticsearch, Netflix Iceberg, Apache Kudu, and Apache Pulsar, recently introduced Cost-Based Optimizer in Presto must account for heterogeneous inputs with differing and often incomplete data statistics. This talk will explore this topic in detail as well as discuss best use cases for Presto across several industries. In addition, we will present recent Presto advancements such as Geospatial analytics at scale and the project roadmap going forward.
Datalab 101 (Hadoop, Spark, ElasticSearch) par Jonathan Winandy - Paris Spark...Modern Data Stack France
Datalab 101 (Hadoop, Spark, ElasticSearch) par Jonathan Winandy
Retour d'expérience sur la mise en place d'un Datalab avec Hadoop, Spark et ElasticSearch dans un environnement contraint. Nous allons exposer les méthodes qui nous ont permis d'améliorer la conception, le développement, les performances et la recette d'une application complexe en Spark.
Jonathan Winandy est MOE, développeur Java/Scala spécialisé dans les pipelines de données.
(Presented by David Smith at useR!2016, June 2016. Recording: https://channel9.msdn.com/Events/useR-international-R-User-conference/useR2016/R-at-Microsoft )
Since the acquisition of Revolution Analytics in April 2015, Microsoft has embarked upon a project to build R technology into many Microsoft products, so that developers and data scientists can use the R language and R packages to analyze data in their data centers and in cloud environments.
In this talk I will give an overview (and a demo or two) of how R has been integrated into various Microsoft products. Microsoft data scientists are also big users of R, and I'll describe a couple of examples of R being used to analyze operational data at Microsoft. I'll also share some of my experiences in working with open source projects at Microsoft, and my thoughts on how Microsoft works with open source communities including the R Project.
Microsoft and Revolution Analytics -- what's the add-value? 20150629Mark Tabladillo
Microsoft has been a leader in the enterprise analytics space for years. In 2014, Microsoft had already created R language functionality within Azure Machine Learning. On April 6, 2015, Microsoft and closed on a deal to acquire Revolution Analytics, a company focusing on scalable processing solutions initiated by the well-known R language. Many data science projects and initial demos do not need high-volume solutions: however, having a high-volume answer for the R language allows for planning or working toward the largest data science solutions.
This presentation describes the add-value for the Revolution Analytics acquisition. The talk covers 1) an overview of current data science technologies from Microsoft; 2) a description of the R language; 3) a brief review of the add-value for R with Azure Machine Learning, and 4) a description of the performance architecture and demo of the language constructs developed by Revolution Analytics. Most of the presentation will be focused on sections two and four. It is anticipated that these technologies will be partially if not fully integrated into SQL Server 2016.
Introduction to TitanDB, describes the need of graph database and provides an overview of TitanDB and Tinkerpop. Listing the core features that TitanDB provides us and why we should be using TitanDB in case we choose to build our application with graph database.
Presentation given by US Chief Scientist, Mario Inchiosa, at the June 2013 Hadoop Summit in San Jose, CA.
ABSTRACT: Hadoop is rapidly being adopted as a major platform for storing and managing massive amounts of data, and for computing descriptive and query types of analytics on that data. However, it has a reputation for not being a suitable environment for high performance complex iterative algorithms such as logistic regression, generalized linear models, and decision trees. At Revolution Analytics we think that reputation is unjustified, and in this talk I discuss the approach we have taken to porting our suite of High Performance Analytics algorithms to run natively and efficiently in Hadoop. Our algorithms are written in C++ and R, and are based on a platform that automatically and efficiently parallelizes a broad class of algorithms called Parallel External Memory Algorithms (PEMA’s). This platform abstracts both the inter-process communication layer and the data source layer, so that the algorithms can work in almost any environment in which messages can be passed among processes and with almost any data source. MPI and RPC are two traditional ways to send messages, but messages can also be passed using files, as in Hadoop. I describe how we use the file-based communication choreographed by MapReduce and how we efficiently access data stored in HDFS.
A short introduction to Apache Hadoop Hive, what is it and what can it do. How could we use it to connect a Hadoop cluster to business intelligence tools. Then create management reports from our Hadoop cluster data.
What’s New in Spark 2.0: Structured Streaming and Datasets - StampedeCon 2016StampedeCon
Spark 2.0 includes many exciting new features including Structured Streaming, and the unification of Datasets (new in 1.6) with DataFrames. Structured Streaming allows one to define recurrent queries on a stream of data that is handled as an infinite DataFrame. This query is incrementally updated with new data. This allows for code reuse between batch and streaming and an easier logical model to reason about. Datasets, an extension of DataFrames, were added as an experimental feature in Spark 1.6. They allow us to manipulate collections of objects in a type-safe fashion. In Spark 2.0 the two abstractions have been unified and now DataFrame = Dataset[Row]. We will discuss both of these new features and look at practical real world examples.
NoSQL no more: SQL on Druid with Apache Calcitegianmerlino
Druid is an analytics-focused, distributed, scale-out data store. Existing Druid clusters have scaled to petabytes of data and trillions of events, ingesting millions of events every second. Up until version 0.10, Druid could only be queried in a JSON-based language that many users found unfamiliar.
Enter Apache Calcite. It includes an industry-standard SQL parser, validator, and JDBC driver, as well as a cost-based relational optimizer. Calcite bills itself as “the foundation for your next high-performance database” and is used by Hive, Drill, and a variety of other projects. Druid uses Calcite to power Druid SQL, a standards-based query API that vaults Druid out of the NoSQL world and into the SQL world.
Gian Merlino offers an overview of Druid SQL and explains how Druid and Calcite are integrated and why you should stop worrying and learn to love relational algebra in your own projects.
microsoft r server for distributed computingBAINIDA
microsoft r server for distributed computing กฤษฏิ์ คำตื้อ,
Technical Evangelist,
Microsoft (Thailand)
ในงาน THE FIRST NIDA BUSINESS ANALYTICS AND DATA SCIENCES CONTEST/CONFERENCE จัดโดย คณะสถิติประยุกต์และ DATA SCIENCES THAILAND
Performance and Scale Options for R with Hadoop: A comparison of potential ar...Revolution Analytics
R and Hadoop go together. In fact, they go together so well, that the number of options available can be confusing to IT and data science teams seeking solutions under varying performance and operational requirements.
Which configuration is faster for big files? Which is faster for sharing data and servers among groups? Which eliminates data movement? Which is easiest to manage? Which works best with iterative and multistep algorithms? What are the hardware requirements of each alternative?
This webinar is intended to help new users of R with Hadoop select their best architecture for integrating Hadoop and R, by explaining the benefits of several popular configurations, their performance potential, workload handling and programming model and administrative characteristics.
Presenters from Revolution Analytics will describe the options for using Revolution R Open and Revolution R Enterprise with Hadoop including servers, edge nodes, rHadoop and ScaleR. We’ll then compare the characteristics of each configuration as regards performance but also programming model, administration, data movement, ease of scaling, mixed workload handling, and performance for large individual analyses vs. mixed workloads.
Analysts predict that the Hadoop market will reach $50.2 billion USD by 2020.1 Applications driving these large expenditures are some of the most important workloads for businesses today including:
• Analyzing clickstream data, including site-side clicks and web media tags. • Measuring sentiment by scanning product feedback, blog feeds, social media comments, and Twitter streams. • Analysis of behavior and risk by capturing vehicle telematics. • Optimizing product performance and utilization by gathering data from built-in sensors. • Tracking and analyzing people and material movement with location-aware systems. • Identifying system performance and intrusion attempts by analyzing server and network log. • Enabling automatic document and speech categorization. • Extracting learning from digitized images, voice, video, and other media types.
Predictive analytics on large data sets provides organizations with a key opportunity to improve a broad variety of business outcomes, and many have embraced Apache Hadoop as the platform of choice.
In the last few years, large businesses have adopted Apache Hadoop as a next-generation data platform, one capable of managing large data assets in a way that is flexible, scalable, and relatively low cost. However, to realize predictive benefits of big data, organizations must be able to develop or hire individuals with the requisite statistics skills, then provide them with a platform for analyzing massive data assets collected in Hadoop “data lakes.”
As users adopted Hadoop, many discovered performance and complexity limited Hadoop’s use for broad predictive analytics use. In response, the Hadoop community has focused on the Apache Spark platform to provide Hadoop with significant performance improvements. With Spark atop Hadoop, users can leverage Hadoop’s big-data management capabilities while achieving new performance levels by running analytics in Apache Spark.
What remains is a challenge—conquering the complexity of Hadoop when developing predictive analytics applications.
In this white paper, we’ll describe how Microsoft R Server helps data scientists, actuaries, risk analysts, quantitative analysts, product planners, and other R users to capture the benefits of Apache Spark on Hadoop by providing a straightforward platform that eliminates much of the complexity of using Spark and Hadoop to conduct analyses on large data assets.
Nida event oracle business analytics 1 sep2016BAINIDA
Oracle Business Analytics ในงาน THE FIRST NIDA BUSINESS ANALYTICS AND DATA SCIENCES CONTEST/CONFERENCE จัดโดย คณะสถิติประยุกต์และ DATA SCIENCES THAILAND
ระบบการเรียนการสอนระยะไกลโดยใช้เทคโนโลยีคลาวด์ โดย รศ. ดร. พิพัฒน์ หิรัญวณิชชากร คงฤทธิ์ บุญหนัก ภัทรพล อรุณ
ในงาน THE FIRST NIDA BUSINESS ANALYTICS AND DATA SCIENCES CONTEST/CONFERENCE จัดโดย คณะสถิติประยุกต์และ DATA SCIENCES THAILAND
Second prize data analysis @ the First NIDA business analytics and data scie...BAINIDA
Second prize data analysis
@ the First NIDA business analytics and data sciences contest
1.นางสาวทอฝัน แหล๊ะตี สาขาประกันภัย
2.นางสาวผัลย์สุภา ศิริวงศ์นภา สาขาไอที
3.นางสาวนรีรัตน์ ตรีชีวันนาถ สาขาสถิติ
จาก คณะพาณิชยศาสตร์และการบัญชี จุฬาลงกรณ์มหาวิทยาลัย
R Tool for Visual Studio และการทำงานร่วมกันเป็นทีม โดย เฉลิมวงศ์ วิจิตรปิยะกุ...BAINIDA
R Tool for Visual Studio และการทำงานร่วมกันเป็นทีม โดย เฉลิมวงศ์ วิจิตรปิยะกุล MVP, Microsoft Thailand
THE FIRST NIDA BUSINESS ANALYTICS AND DATA SCIENCES CONTEST/CONFERENCE
Speaking of big data analysis, what comes to mind is possibly using HDFS and MapReduce within Hadoop. But to write a MapReduce program, one must face the problem of learning how to write native java. One might wonder is it possible to use R, the most popular language adapted by data scientist, to implement MapReduce program? And through the integration or R and Hadoop, is it truly one can unleash the power of parallel computing and big data analysis?
This slide introduces how to install RHadoop step by step, and introduces how to write a MapReduce program through R. What is more, this slide will discuss whether RHadoop is really a light for big data analysis, or just another method to write MapReduce Program.
Please mail me if you found any problem toward the slide. EMAIL: tr.ywchiu@gmail.com
談到巨量資料,通常大家腦海中聯想到的就是使用Hadoop 的 MapReduce 和HDFS,但是撰寫MapReduce,則就必須要學會撰寫Java 或透過Thrift 接口才能撰寫。但R是否有辦法運行在Hadoop 上呢 ? 而使用R + Hadoop,是否就真的能結合R強大的分析功能,分析巨量資料呢 ?
本次講題將介紹如何Step by step 在Hadoop 上安裝RHadoop相關套件,並介紹如何撰寫R的MapReduce 程式。更重要的是,此次將探討使用RHadoop 是否為巨量資料分析找到一盞明燈? 或者只是另一套實作方法而已?
Tableau for statistical graphic and data visualizationBAINIDA
Tableau for statistical graphic and data visualization Somkiat Kraikriangsri – Enterprise Sales
Marut Veerawatyotin – Sales Consultant
THE FIRST NIDA BUSINESS ANALYTICS AND DATA SCIENCES CONTEST/CONFERENCE
Second prize business plan @ the First NIDA business analytics and data scien...BAINIDA
Second prize business plan @ the First NIDA business analytics and data sciences contest
ผู้ที่ได้รางวัลรองชนะเลิศอันดับ 1
1.นางสาวทอฝัน แหล๊ะตี สาขาประกันภัย
2.นางสาวผัลย์สุภา ศิริวงศ์นภา สาขาไอที
3.นางสาวนรีรัตน์ ตรีชีวันนาถ สาขาสถิติ
จากจุฬาลงกรณ์มหาวิทยาลัย คณะพาณิชยศาสตร์และการบัญชี
ผลการวิเคราะห์ข้อมูลของทีมที่ได้รางวัลชนะเลิศ The First NIDA Business Analyti...BAINIDA
ผลการวิเคราะห์ข้อมูลของทีมที่ได้รางวัลชนะเลิศ The First NIDA Business Analytics and Data Sciences Contest
ผู้ที่ได้รางวัลชนะเลิศ
นายเธียรศักดิ์ พลาดิศัยเลิศ นักศึกษาคณะไอทีลาดกระบัง
นายก่อกฤษฎิ์ เอกพาณิชย์ถาวร จากคณะเศรษฐศาสตร์และวิทยาศาสตร์ข้อมูล WESLEYAN UNIVERSITY
นายณัฐพล รักษ์รัชตกุล จากคณะวิศวกรรมศาสตร์ จุฬาลงกรณ์มหาวิทยาลัย
In-Database Analytics Deep Dive with Teradata and RevolutionRevolution Analytics
Teradata and Revolution Analytics worked together to develop in-database analytical capabilities for Teradata Database. Teradata v14.10 provides a foundation for in-database analytics in Teradata. Revolution Analytics has ported its Revolution R Enterprise (RRE) Version 7.1 to use the in-database capabilities of version 14.10. With RRE inside Teradata, users can run fully parallelized algorithms in each node of the Teradata appliance to achieve performance and data scale heretofore unavailable. We'll get past the market-ecture quickly and dive into a “how it really works” presentation, review implications for system configuration and administration, and then take questions from Teradata users who will be charged with deploying and administering Teradata systems as platforms for big data analytics inside the database engine.
cybersecurity regulation for thai capital market ดร.กำพล ศรธนะรัตน์ ผู้อำนวย...BAINIDA
cybersecurity regulation for thai capital market ดร.กำพล ศรธนะรัตน์ ผู้อำนวยการฝ่ายเทคโนโลยีสารสนเทศ สำนักงานคณะกรรมการกำกับหลักทรัพย์และตลาดหลักทรัพย์ ในงาน THE FIRST NIDA BUSINESS ANALYTICS AND DATA SCIENCES CONTEST/CONFERENCE จัดโดย คณะสถิติประยุกต์และ DATA SCIENCES THAILAND
Quick-Start Guide: Deploying Your Cloudian HyperStore Hybrid Storage ServiceCloudian
This document will help a new user deploy a 3-node Cloudian storage cluster in your data center for use with the Cloudian HyperStore Hybrid Cloud Service from AWS Marketplace.
One-Man Ops with Puppet & Friends.
If you're getting started in Amazon AWS here's 7 tools that will help you be successful, a few tips to make your life easier and some common pitfalls to avoid.
In this white-paper we will explain how one can install and configure cloud storage software and use it for backup purposes. Document can be used by an individual or a company who wishes to become a cloud backup provider and utilize its own hardware for cloud object-based storage. We will use Cloudian object-storage software along with CloudBerry Lab products.
Modernizing your database environment can bring many benefits, from avoiding technical debt to reducing expenses. AWS Database Migration Service enables easy modernization, enabling you to easily change database versions (and even database engines) and schema topologies while avoiding downtimes. We’ll look at some models for modernization, then do a hands-on exercise to migrate and consolidate MySQL databases to Amazon Aurora. You’ll need a laptop with a Firefox or Chrome browser.
Lab Manual reModernize - Updating and Consolidating MySQLAmazon Web Services
by Rich Alberth, Solution Architect, AWS
If you need to query relationships between data, you need a graph database. We’ll take a close look at Amazon Neptune, explore the differences between property graphs and RDF, then do graph data queries using Apache Tinkerpop. You’ll need a laptop with a Firefox or Chrome browser.
Hands-on Lab: re-Modernize - Updating and Consolidating MySQLAmazon Web Services
by Joyjeet Banerjee, Enterprise Solutions Architect, AWS
Database Week at the AWS Loft is an opportunity to learn about Amazon’s broad and deep family of managed database services. These services provide easy, scalable, reliable, and cost-effective ways to manage your data in the cloud. We explain the fundamentals and take a technical deep dive into Amazon RDS and Amazon Aurora relational databases, Amazon DynamoDB non-relational databases, Amazon Neptune graph databases, and Amazon ElastiCache managed Redis, along with options for database migration, caching, search and more. You'll will learn how to get started, how to support applications, and how to scale.
Drupal Continuous Integration with Jenkins - DeployJohn Smith
Simple deployment setup for Jenkins. This tutorial assumes you have used our previously released "Drupal Continuous Integration with Jenkins" tutorial to setup your Jenkins server. This document is being released under the Creative Commons CC0 license.
Enjoy!
Cloud init and cloud provisioning [openstack summit vancouver]Joshua Harlow
Evil Superuser's HOWTO: Launching instances to do your bidding.
You click 'run' on the OpenStack dashboard, or launch a new instance via the api. Some provisioning magic happens and soon you've got a server created especially for you. Did you ever wonder what magic happens to a standard image on boot? Have you wanted to launch instances and have them into your infrastructure with no manual interaction? Cloud-init is software that runs in most linux instances. It can take your input and do your bidding. Learn what things cloud-init magically does for you and how you can make it do more. Also, take advantage of the after-talk to pester cloud-init developers on what is missing or throw rotten fruits in their direction.
In addition to authorization policies that control what a user can do, OpenShift Container Platform gives its administrators the ability to manage a set of security context constraints (SCCs) for limiting pods and securing their cluster.
Default security context may be too restrictive for containers pulled down from DockerHub, thorugh this talk we'll explore the various steps to execute for enabling required permissions on selected OpenShift's pods.
party list calculation visualization @ BADS@ Exploratory Data Analysis and Data Visualization @Graduate School of Applied Statistics, National Development of Administration, taught by Arnond Sakworawich, Ph.D.
วิทยาการข้อมูลสำหรับการแพทย์ บรรยายที่โรงพยาบาลชลบุรี วันที่ 21 มีนาคม 2561 เวลา 13.00-15.00 น
Data Science
Big Data
Data Science in Medicine & Health Care
Health and Bioinformatics
Data Science and Health Care Planning
Data Science and Health Care Prevention and Protection
Data Science and Medical Diagnosis
Data Science and Medical Care & Treatment
Data Engineering for Health Care
Financial time series analysis with R@the 3rd NIDA BADS conference by Asst. p...BAINIDA
Introduction to financial time series analysis, getting financial time series data through yahoo finance API with R, time series visualization, risk and return calculation for financial time series data, autoregressive integrated moving average models with R code and applications in financial time series.
Data science and big data for business and industrial applicationBAINIDA
Data science and big data for business and industrial application บรรยายที่วิทยาลัยเทคโนโลยีจิตรลดา สนามเสือป่า ให้คณาจารย์ฟังครับ
5/23/2018
ผศ. ดร. อานนท์ ศักดิ์วรวิชญ์
Word segmentation using Deep Learning (Deep cut) บรรยายโดย Rakpong Kittinaradorn จาก True Corporation ในงาน the second business analytics and data science contest/conference
Visualizing for real impact โดยอาจารย์ ดร. อานนท์ ศักดิ์วรวิชญ์ ผู้อำนวยการศูนย์คลังปัญญาและสารสนเทศ สถาบันบัณฑิตพัฒนบริหารศาสตร์ สาขาวิชา Business Analytics and Intelligence และสาขาวิทยาการประกันภัยและการบริหารความเสี่ยง สถาบันบัณฑิตพัฒนบริหารศาสตร์ บรรยายในงาน The 4th Data Cube Conference (Data Analytic to Real Application) เมื่อวันที่ clock
Saturday, July 22 at 9 AM - 5 PM
https://www.facebook.com/events/193038667886326/
ขอบคุณ ดร เอกสิทธิ์ พัชรวงศ์ศักดาที่เชิญไปบรรยายครับ สไลด์ชุดนี้มีคนถามหากันมากเลย post ให้ทุกคนครับ
แผนธุรกิจ ของทีมที่ได้รางวัลชนะเลิศ The First NIDA Business Analytics and Dat...BAINIDA
แผนธุรกิจ ของทีมที่ได้รางวัลชนะเลิศ The First NIDA Business Analytics and Data Sciences Contest
ผู้ที่ได้รางวัลชนะเลิศ
นายเธียรศักดิ์ พลาดิศัยเลิศ นักศึกษาคณะไอทีลาดกระบัง
นายก่อกฤษฎิ์ เอกพาณิชย์ถาวร จากคณะเศรษฐศาสตร์และวิทยาศาสตร์ข้อมูล Wesleyan University
นายณัฐพล รักษ์รัชตกุล จากคณะวิศวกรรมศาสตร์ จุฬาลงกรณ์มหาวิทยาลัย
A Strategic Approach: GenAI in EducationPeter Windle
Artificial Intelligence (AI) technologies such as Generative AI, Image Generators and Large Language Models have had a dramatic impact on teaching, learning and assessment over the past 18 months. The most immediate threat AI posed was to Academic Integrity with Higher Education Institutes (HEIs) focusing their efforts on combating the use of GenAI in assessment. Guidelines were developed for staff and students, policies put in place too. Innovative educators have forged paths in the use of Generative AI for teaching, learning and assessments leading to pockets of transformation springing up across HEIs, often with little or no top-down guidance, support or direction.
This Gasta posits a strategic approach to integrating AI into HEIs to prepare staff, students and the curriculum for an evolving world and workplace. We will highlight the advantages of working with these technologies beyond the realm of teaching, learning and assessment by considering prompt engineering skills, industry impact, curriculum changes, and the need for staff upskilling. In contrast, not engaging strategically with Generative AI poses risks, including falling behind peers, missed opportunities and failing to ensure our graduates remain employable. The rapid evolution of AI technologies necessitates a proactive and strategic approach if we are to remain relevant.
2024.06.01 Introducing a competency framework for languag learning materials ...Sandy Millin
http://sandymillin.wordpress.com/iateflwebinar2024
Published classroom materials form the basis of syllabuses, drive teacher professional development, and have a potentially huge influence on learners, teachers and education systems. All teachers also create their own materials, whether a few sentences on a blackboard, a highly-structured fully-realised online course, or anything in between. Despite this, the knowledge and skills needed to create effective language learning materials are rarely part of teacher training, and are mostly learnt by trial and error.
Knowledge and skills frameworks, generally called competency frameworks, for ELT teachers, trainers and managers have existed for a few years now. However, until I created one for my MA dissertation, there wasn’t one drawing together what we need to know and do to be able to effectively produce language learning materials.
This webinar will introduce you to my framework, highlighting the key competencies I identified from my research. It will also show how anybody involved in language teaching (any language, not just English!), teacher training, managing schools or developing language learning materials can benefit from using the framework.
Acetabularia Information For Class 9 .docxvaibhavrinwa19
Acetabularia acetabulum is a single-celled green alga that in its vegetative state is morphologically differentiated into a basal rhizoid and an axially elongated stalk, which bears whorls of branching hairs. The single diploid nucleus resides in the rhizoid.
Macroeconomics- Movie Location
This will be used as part of your Personal Professional Portfolio once graded.
Objective:
Prepare a presentation or a paper using research, basic comparative analysis, data organization and application of economic information. You will make an informed assessment of an economic climate outside of the United States to accomplish an entertainment industry objective.
Embracing GenAI - A Strategic ImperativePeter Windle
Artificial Intelligence (AI) technologies such as Generative AI, Image Generators and Large Language Models have had a dramatic impact on teaching, learning and assessment over the past 18 months. The most immediate threat AI posed was to Academic Integrity with Higher Education Institutes (HEIs) focusing their efforts on combating the use of GenAI in assessment. Guidelines were developed for staff and students, policies put in place too. Innovative educators have forged paths in the use of Generative AI for teaching, learning and assessments leading to pockets of transformation springing up across HEIs, often with little or no top-down guidance, support or direction.
This Gasta posits a strategic approach to integrating AI into HEIs to prepare staff, students and the curriculum for an evolving world and workplace. We will highlight the advantages of working with these technologies beyond the realm of teaching, learning and assessment by considering prompt engineering skills, industry impact, curriculum changes, and the need for staff upskilling. In contrast, not engaging strategically with Generative AI poses risks, including falling behind peers, missed opportunities and failing to ensure our graduates remain employable. The rapid evolution of AI technologies necessitates a proactive and strategic approach if we are to remain relevant.
Palestine last event orientationfvgnh .pptxRaedMohamed3
An EFL lesson about the current events in Palestine. It is intended to be for intermediate students who wish to increase their listening skills through a short lesson in power point.
Introduction to AI for Nonprofits with Tapp NetworkTechSoup
Dive into the world of AI! Experts Jon Hill and Tareq Monaur will guide you through AI's role in enhancing nonprofit websites and basic marketing strategies, making it easy to understand and apply.
Biological screening of herbal drugs: Introduction and Need for
Phyto-Pharmacological Screening, New Strategies for evaluating
Natural Products, In vitro evaluation techniques for Antioxidants, Antimicrobial and Anticancer drugs. In vivo evaluation techniques
for Anti-inflammatory, Antiulcer, Anticancer, Wound healing, Antidiabetic, Hepatoprotective, Cardio protective, Diuretics and
Antifertility, Toxicity studies as per OECD guidelines
Operation “Blue Star” is the only event in the history of Independent India where the state went into war with its own people. Even after about 40 years it is not clear if it was culmination of states anger over people of the region, a political game of power or start of dictatorial chapter in the democratic setup.
The people of Punjab felt alienated from main stream due to denial of their just demands during a long democratic struggle since independence. As it happen all over the word, it led to militant struggle with great loss of lives of military, police and civilian personnel. Killing of Indira Gandhi and massacre of innocent Sikhs in Delhi and other India cities was also associated with this movement.
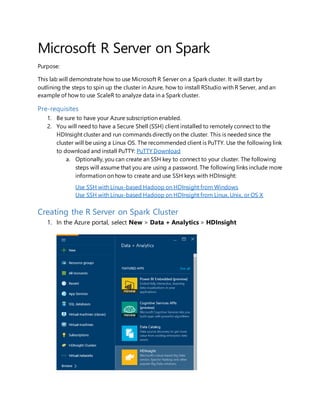
1. Microsoft R Server on Spark
Purpose:
This lab will demonstrate how to use Microsoft R Server on a Spark cluster. It will start by
outlining the steps to spin up the cluster in Azure, how to install RStudio with R Server, and an
example of how to use ScaleR to analyze data in a Spark cluster.
Pre-requisites
1. Be sure to have your Azure subscription enabled.
2. You will need to have a Secure Shell (SSH) client installed to remotely connect to the
HDInsight cluster and run commands directly on the cluster. This is needed since the
cluster will be using a Linux OS. The recommended client is PuTTY. Use the following link
to download and install PuTTY: PuTTY Download
a. Optionally, you can create an SSH key to connect to your cluster. The following
steps will assume that you are using a password. The following links include more
information on how to create and use SSH keys with HDInsight:
Use SSH with Linux-based Hadoop on HDInsight from Windows
Use SSH with Linux-based Hadoop on HDInsight from Linux, Unix, or OS X
Creating the R Server on Spark Cluster
1. In the Azure portal, select New > Data + Analytics > HDInsight
2. 2. Enter a name in the Cluster Name field and select the appropriate Azure
subscription in the Subscription field.
3. Click Select Cluster Type. On the Cluster Type blade, select the following
options:
a. Cluster Type: R Server on Spark
b. Cluster Tier: Premium
Click Select to save the cluster type configuration.
4. Click Credentials to create the cluster login username and password and the SSH
username and password. This is also where you can upload a key instead of using
a username/password for SSH authentication.
5. Click the Data Source field. Create a new storage account and a default container
for the cluster to use.
6. Click the Pricing field. Here you will be able to specify the number of Worker
nodes, the size of the Worker nodes, the size of the Head nodes and the R server
3. node size (this is the edge node that you will connect to using SSH to run your R
code). For demo purposes, you can leave the default settings in place.
7. Optionally, you can select External Metastores for Hive and Oozie in the Optional
Configuration field if you have SQL Databases created to store Hive/Oozie job
metadata. For this demo, this option will remain blank.
8. Either create a new Resource group or select an existing on in the Resource
Group field.
9. Click Create to create the cluster.
Installing RStudio with R Server on HDInsight
The following steps assume that you have downloaded and installed PuTTY. Please refer
to the Prerequisites section at the top of this document for the link to download PuTTY.
1. Identify the edge node of the cluster. To find the name of the edge node, select
the recently created HDInsight cluster in the HDInsight Clusters blade. From
there, select Settings > Applications > R Server for HDInsight. The SSH
Endpoint is the name of the edge node for the cluster.
2. SSH into the edge node. Use the following steps to connect to the edge node:
4. a. To connect to the edge node, open PuTTY. The following is a screenshot of
PuTTY when it is opened up:
b. In the Category pane, select Session. Enter the SSH address of the
HDInsight server in the Host Name (or IP address) text box. This address
could be either the address of the head node or the address of the edge
node. Use the address of the edge node to connect to the edge node and
configure RStudio. Click Open to connect to the cluster.
5. c. Log in with the SSH credentials that were created when the cluster was
created.
3. Once connected, become a root user on the cluster. Use the following command
in the SSH session:
sudo su -
4. Download the custom script to install RStudio. Use the following command in the
SSH session
wget http://mrsactionscripts.blob.core.windows.net/rstudio-server-community-
v01/InstallRStudio.sh
5. Change the permissions on the custom script file and run the script. Use the
following commands:
chmod 755 InstallRStudio.sh
./InstallRStudio.sh
6. 6. Create an SSH tunnel to the cluster by mapping localhost:8787 on the HDInsight
Cluster to the client machine. This can be done through PuTTY.
a. Open PuTTY, and enter your connection information.
b. In the Category pane, expand Connection, expand SSH, and select
Tunnels.
c. Enter 8787 as the Source port and localhost:8787 as the Destination.
Click Add and then click Open to open an SSH connection.
d. When prompted, log in to the server with your SSH credentials. This will
establish an SSH session and enable the tunnel.
7. Open a web browser and enter the following URL based on the port entered for
the tunnel:
http://localhost:8787/
8. You will be prompted to enter the SSH username and password to connect to the
cluster.
7. 9. The following command will download a test script that executes R based Spark
jobs on the cluster. Run this command from the PuTTY session:
wget http://mrsactionscripts.blob.core.windows.net/rstudio-server-community-
v01/testhdi_spark.r
10. In RStudio, you will see the test script that was just downloaded in the lower right
pane. Double click the file to open it and click Run to run the code.
Use a compute context and simple statistics with ScaleR
A compute context allows you to control whether computation will be performed locally
on the edge node, or whether it will be distributed across the nodes in the HDInsight
cluster.
1. From the R console, use the following to load example data into the default
storage for HDInsight.
# Set the HDFS (WASB) location of example data
bigDataDirRoot <- "/example/data"
# create a local folder for storaging data temporarily
source <- "/tmp/AirOnTimeCSV2012"
dir.create(source)
# Download data to the tmp folder
remoteDir <- "http://packages.revolutionanalytics.com/datasets/AirOnTimeCSV2012"
download.file(file.path(remoteDir, "airOT201201.csv"), file.path(source,
"airOT201201.csv"))
download.file(file.path(remoteDir, "airOT201202.csv"), file.path(source,
"airOT201202.csv"))
download.file(file.path(remoteDir, "airOT201203.csv"), file.path(source,
"airOT201203.csv"))
download.file(file.path(remoteDir, "airOT201204.csv"), file.path(source,
"airOT201204.csv"))
download.file(file.path(remoteDir, "airOT201205.csv"), file.path(source,
"airOT201205.csv"))
download.file(file.path(remoteDir, "airOT201206.csv"), file.path(source,
"airOT201206.csv"))
download.file(file.path(remoteDir, "airOT201207.csv"), file.path(source,
"airOT201207.csv"))
download.file(file.path(remoteDir, "airOT201208.csv"), file.path(source,
"airOT201208.csv"))
download.file(file.path(remoteDir, "airOT201209.csv"), file.path(source,
"airOT201209.csv"))
download.file(file.path(remoteDir, "airOT201210.csv"), file.path(source,
"airOT201210.csv"))
8. download.file(file.path(remoteDir, "airOT201211.csv"), file.path(source,
"airOT201211.csv"))
download.file(file.path(remoteDir, "airOT201212.csv"), file.path(source,
"airOT201212.csv"))
# Set directory in bigDataDirRoot to load the data into
inputDir <- file.path(bigDataDirRoot,"AirOnTimeCSV2012")
# Make the directory
rxHadoopMakeDir(inputDir)
# Copy the data from source to input
rxHadoopCopyFromLocal(source, bigDataDirRoot)
2. Next, let's create some data info and define two data sources so that we can work
with the data.
# Define the HDFS (WASB) file system
hdfsFS <- RxHdfsFileSystem()
# Create info list for the airline data
airlineColInfo <- list(
DAY_OF_WEEK = list(type = "factor"),
ORIGIN = list(type = "factor"),
DEST = list(type = "factor"),
DEP_TIME = list(type = "integer"),
ARR_DEL15 = list(type = "logical"))
# get all the column names
varNames <- names(airlineColInfo)
# Define the text data source in hdfs
airOnTimeData <- RxTextData(inputDir, colInfo = airlineColInfo, varsToKeep =
varNames, fileSystem = hdfsFS)
# Define the text data source in local system
airOnTimeDataLocal <- RxTextData(source, colInfo = airlineColInfo, varsToKeep =
varNames)
# formula to use
formula = "ARR_DEL15 ~ ORIGIN + DAY_OF_WEEK + DEP_TIME + DEST"
3. Let's run a logistic regression over the data using the local compute context.
# Set a local compute context
rxSetComputeContext("local")
# Run a logistic regression
system.time(
modelLocal <- rxLogit(formula, data = airOnTimeDataLocal)
)
# Display a summary
summary(modelLocal)
9. 4. Next, let's run the same logistic regression using the Spark context. The Spark
context will distribute the processing over all the worker nodes in the HDInsight
cluster.
# Define the Spark compute context
mySparkCluster <- RxSpark()
# Set the compute context
rxSetComputeContext(mySparkCluster)
# Run a logistic regression
system.time(
modelSpark <- rxLogit(formula, data = airOnTimeData)
)
# Display a summary
summary(modelSpark)
ScaleR Example with Linear Regression and Plots
This example will show different compute contexts, how to do linear regression in
RevoScaleR and how to do some simple plots. It utilized airline delay data for airports
across the United States.
#copy local file to HDFS
rxHadoopMakeDir("/share")
rxHadoopCopyFromLocal(system.file("SampleData/AirlineDemoSmall.csv",package="RevoScaleR"), "/share")
myNameNode <- "default"
myPort <- 0
# Location of the data
bigDataDirRoot <- "/share"
# define HDFS file system
hdfsFS <- RxHdfsFileSystem(hostName=myNameNode, port=myPort)
# specify the input file in HDFS to analyze
inputFile <-file.path(bigDataDirRoot,"AirlineDemoSmall.csv")
# create Factors for days of the week
colInfo <- list(DayOfWeek = list(type = "factor",
levels = c("Monday","Tuesday","Wednesday",
"Thursday","Friday","Saturday","Sunday")))
# define the data source
airDS <- RxTextData(file = inputFile, missingValueString = "M",
colInfo = colInfo, fileSystem = hdfsFS)
# First test the "local" compute context
rxSetComputeContext("local")
# Run a linear regression
system.time(
10. model <- rxLinMod(ArrDelay~CRSDepTime+DayOfWeek, data = airDS)
)
# display a summary of model
summary(model)
# define MapReduce compute context
myHadoopMRCluster <- RxHadoopMR(consoleOutput=TRUE,
nameNode=myNameNode,
port=myPort,
hadoopSwitches="-libjars /etc/hadoop/conf")
# set compute context
rxSetComputeContext(myHadoopMRCluster)
# Run a linear regression
system.time(
model1 <- rxLinMod(ArrDelay~CRSDepTime+DayOfWeek, data = airDS)
)
# display a summary of model
summary(model1)
rxLinePlot(ArrDelay~DayOfWeek, data= airDS)
# define Spark compute context
mySparkCluster <- RxSpark(consoleOutput=TRUE)
# set compute context
rxSetComputeContext(mySparkCluster)
# Run a linear regression
system.time(
model2 <- rxLinMod(ArrDelay~CRSDepTime+DayOfWeek, data = airDS)
)
# display a summary of model
summary(model2)
# Run 4 tasks via rxExec
rxExec( function() {Sys.info()["nodename"]}, timesToRun = 4 )
Wrap Up
This lab was meant to demonstrate how to use Microsoft R Server on a Spark cluster. For
more information, refer to the references listed in the References section.
References
1. https://azure.microsoft.com/en-us/documentation/articles/hdinsight-hadoop-r-
server-get-started/
11. Microsoft R server for distributed computing
The First NIDA Business Analytics and Data Sciences Contest/Conference
วันที่ 1-2 กันยายน 2559 ณ อาคารนวมินทราธิราช สถาบันบัณฑิตพัฒนบริหารศาสตร์
-แนะนํา Microsoft R Server
-Distributed Computing มีวิธีการอย่างไร และมีประโยชน์อย่างไร
-แนะนําวิธีการ Configuration สําหรับ Distributed Computing
https://businessanalyticsnida.wordpress.com
https://www.facebook.com/BusinessAnalyticsNIDA/
กฤษฏิ์ คําตื้อ,
Technical Evangelist,
Microsoft (Thailand)
-Distributed computing กับ Big Data
-Analytics บน R server
-สาธิตและสอนในลักษณะ workshop
Computer Lab 2 ชั้น 10 อาคารสยามบรมราชกุมารี
1 กันยายน 2559 เวลา 9.00-12.30