#4 Pandora -- This map from streaming website Pandora attempts to show the favourite dance music tracks in each US state//top Pandora dance tracks by state
http://brilliantmaps.com/air-pollution/ -- As the map above shows, China is home to many of the world’s most polluted cities. The map was created by AQICN, a Chinese website that tracks global air pollution stats.
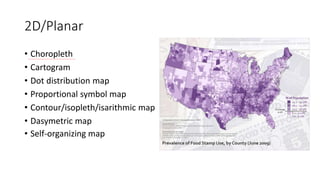
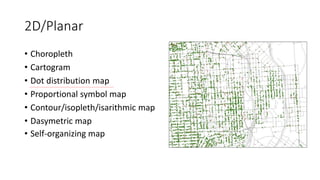
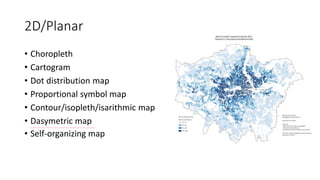
#7 Choropleth: this is a map that has its areas of interest categorized in colors or patterns. Its goal is to offer an overall view of how a certain feature like population density is different from area to area. Read more at http://blog.visme.co/how-to-communicate-technical-information/#POhOS1DLfSOmU9LS.99
#8 Cartogram: this type of map substitutes land area or distance for certain variables. For example, the size of districts can be altered to show how many citizens there are in contrast with other districts Read more at http://blog.visme.co/how-to-communicate-technical-information/#POhOS1DLfSOmU9LS.99
#9 Dot Distribution Map: this map representation uses dots to signal the presence of certain factors within a certain area. One dot represents the location of the phenomenon that data recorded. Thus, it is convenient to observe the impact of a certain agent in an entire country Read more at http://blog.visme.co/how-to-communicate-technical-information/#POhOS1DLfSOmU9LS.99
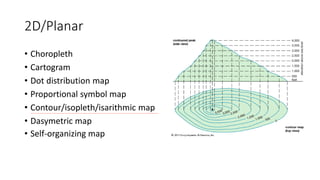
#13 A self-organizing map showing U.S. Congress voting patterns. The input data was a table with a row for each member of Congress, and columns for certain votes containing each member's yes/no/abstain vote. The SOM algorithm arranged these members in a two-dimensional grid placing similar members closer together. The first plot shows the grouping when the data are split into two clusters. The second plot shows average distance to neighbours: larger distances are darker. The third plot predicts Republican (red) or Democratic (blue) party membership. The other plots each overlay the resulting map with predicted values on an input dimension: red means a predicted 'yes' vote on that bill, blue means a 'no' vote. The plot was created in Synapse.


![แผนที่ [Autosaved]](https://cdn.slidesharecdn.com/ss_thumbnails/autosaved-100621005809-phpapp02-thumbnail.jpg?width=640&height=640&fit=bounds)