Download as PDF, PPTX

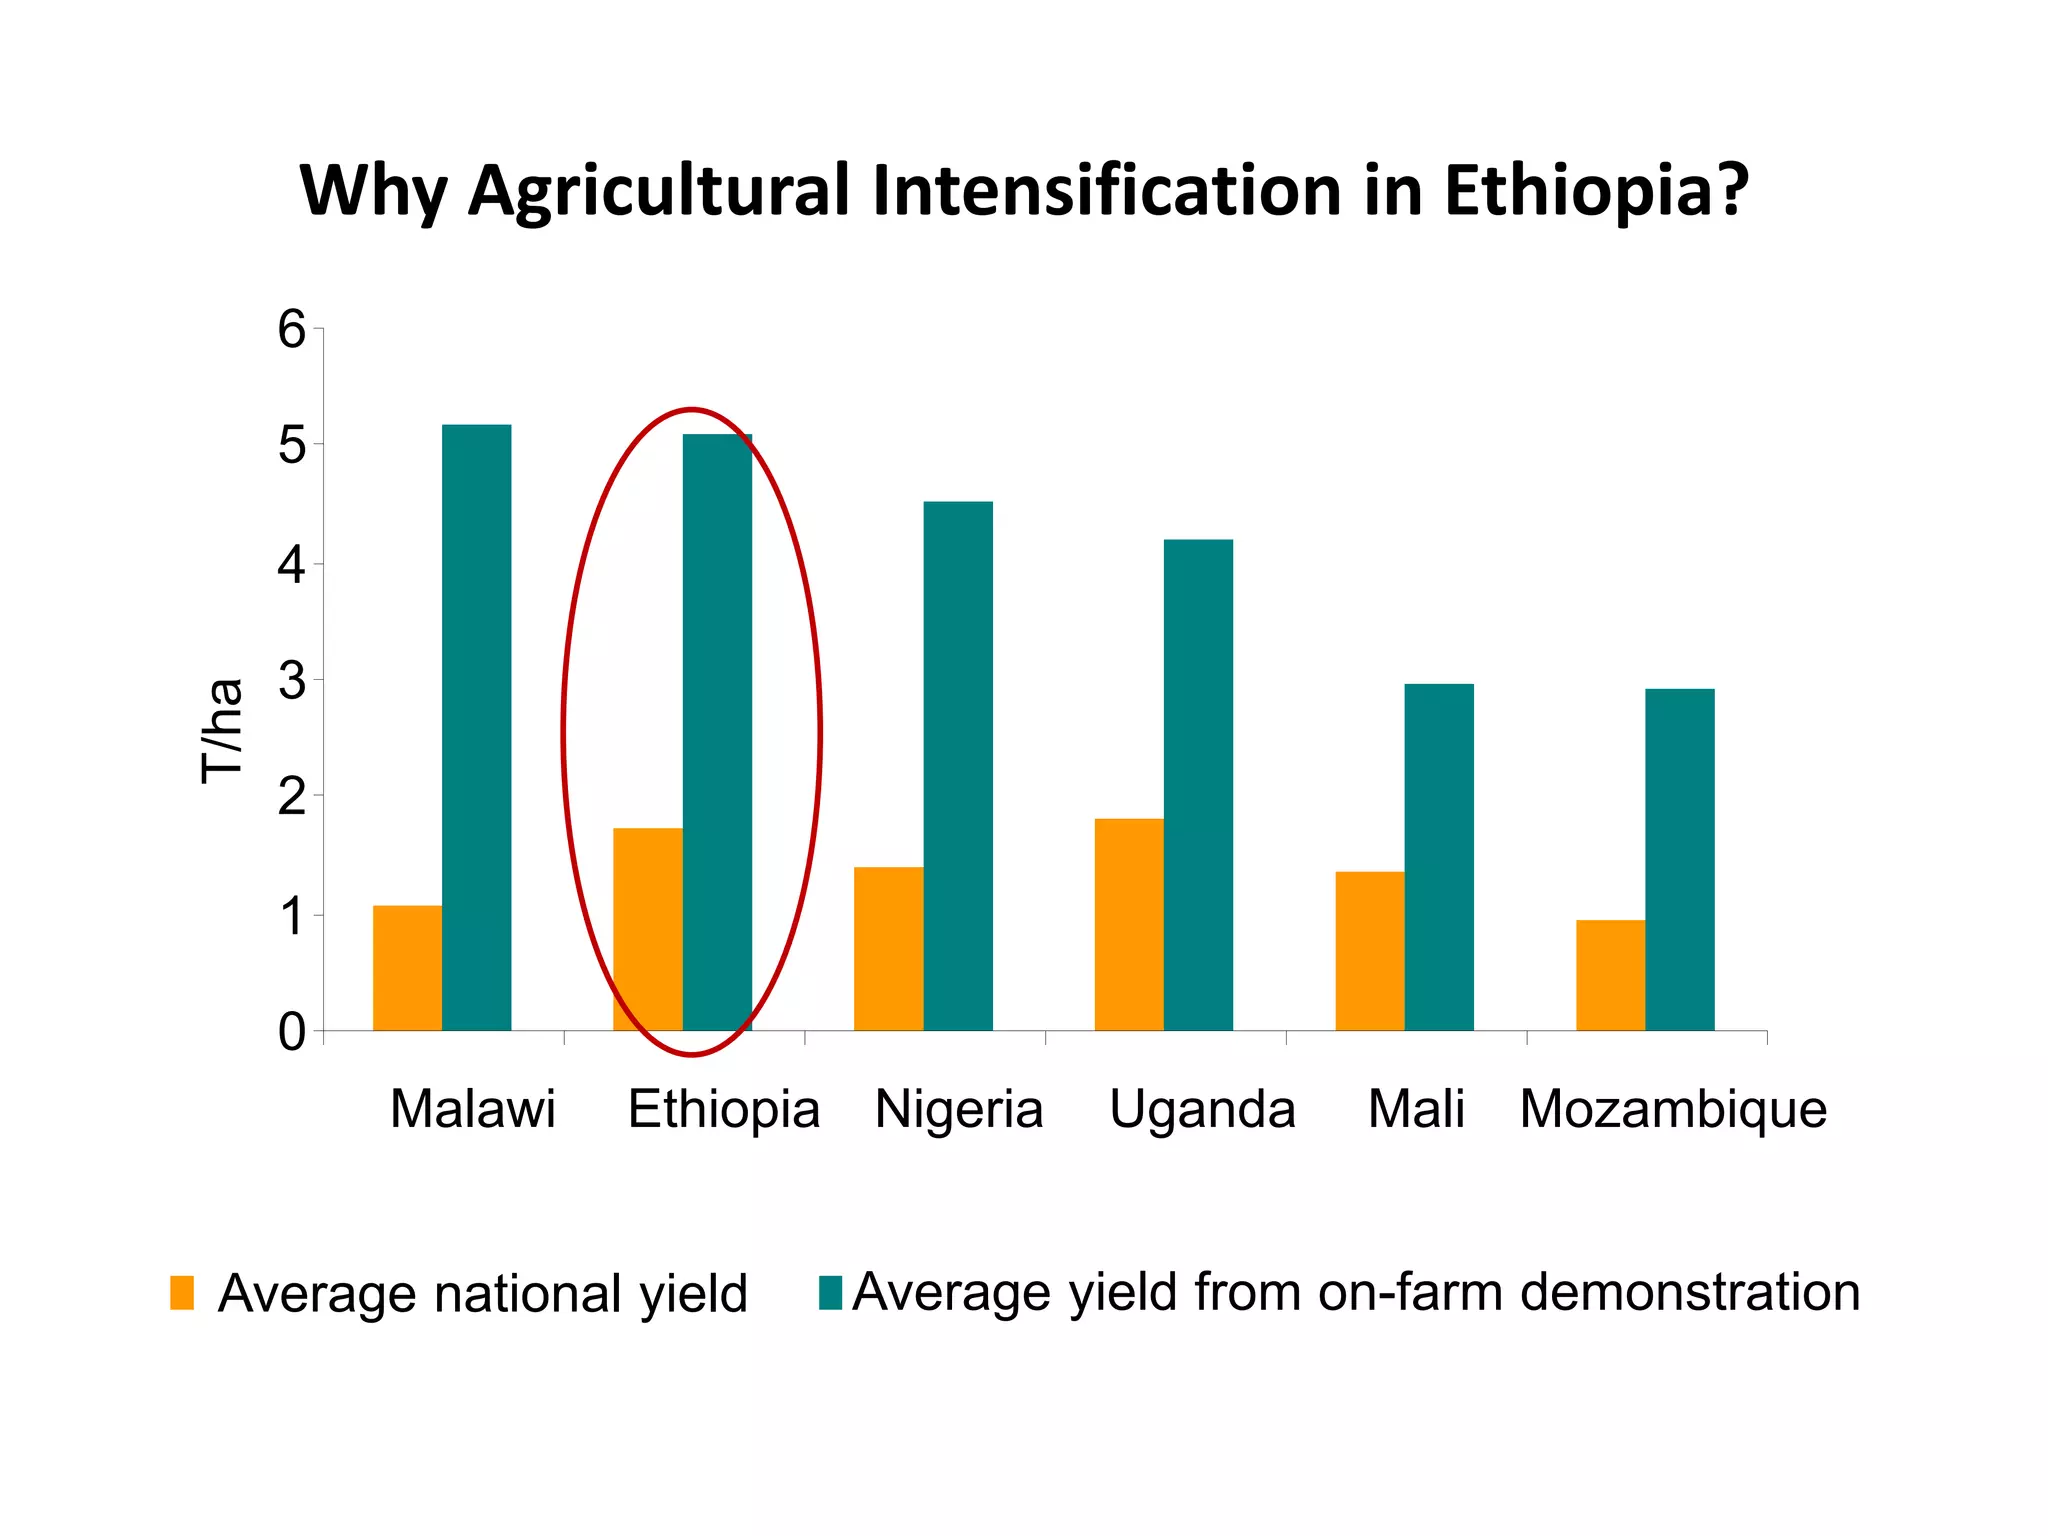
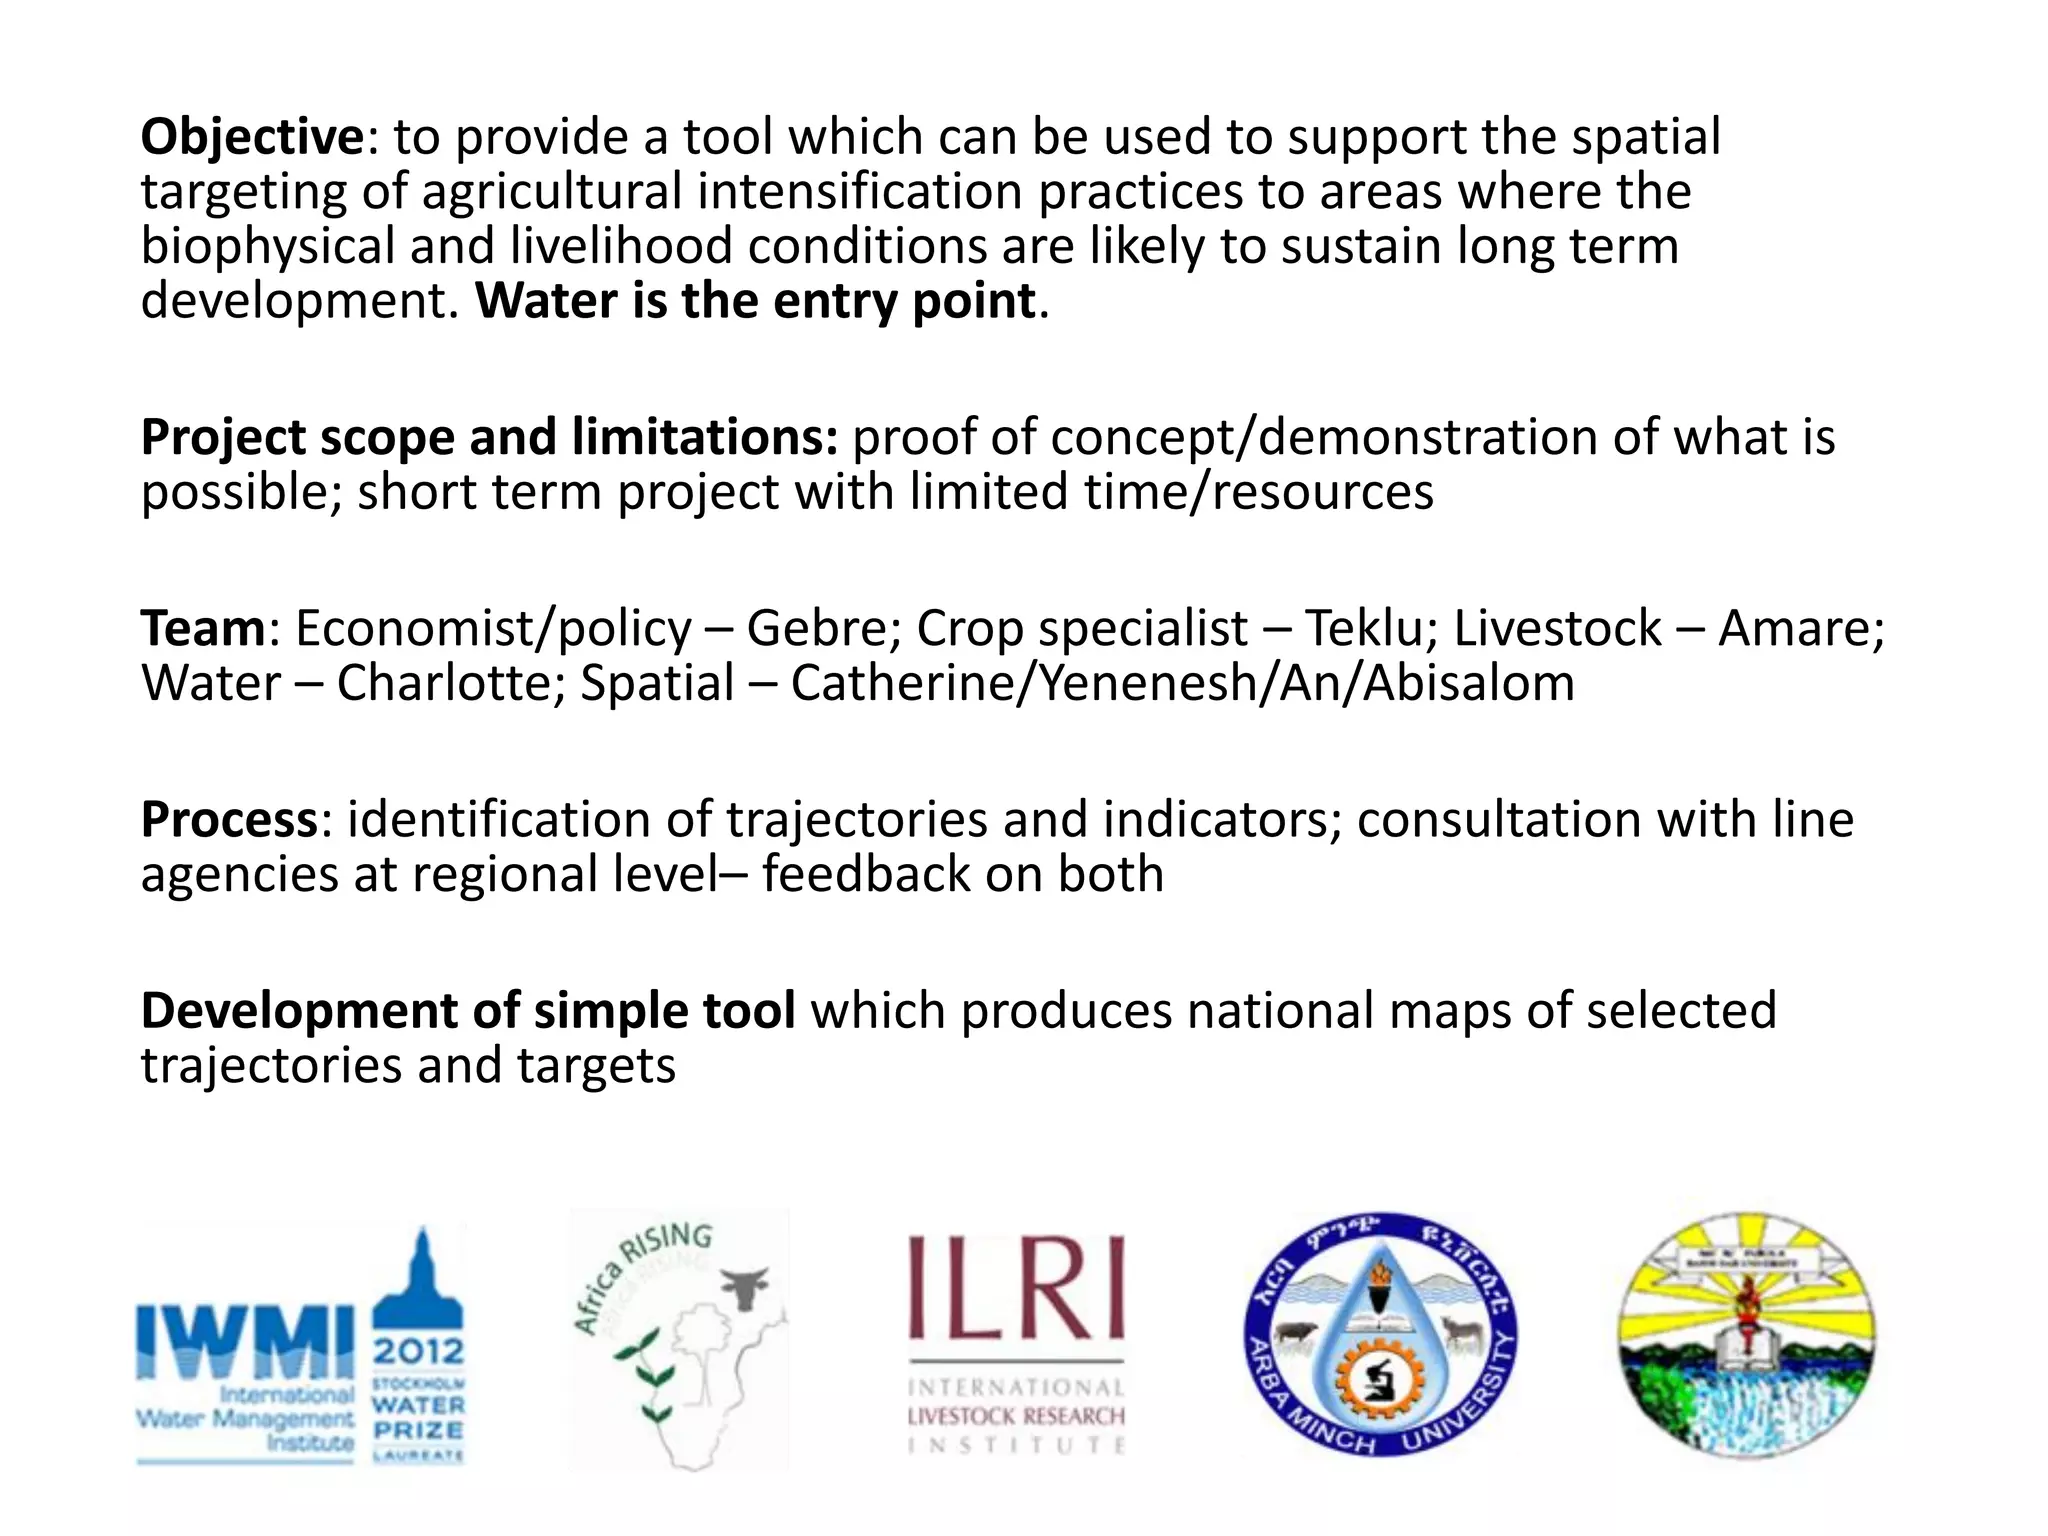
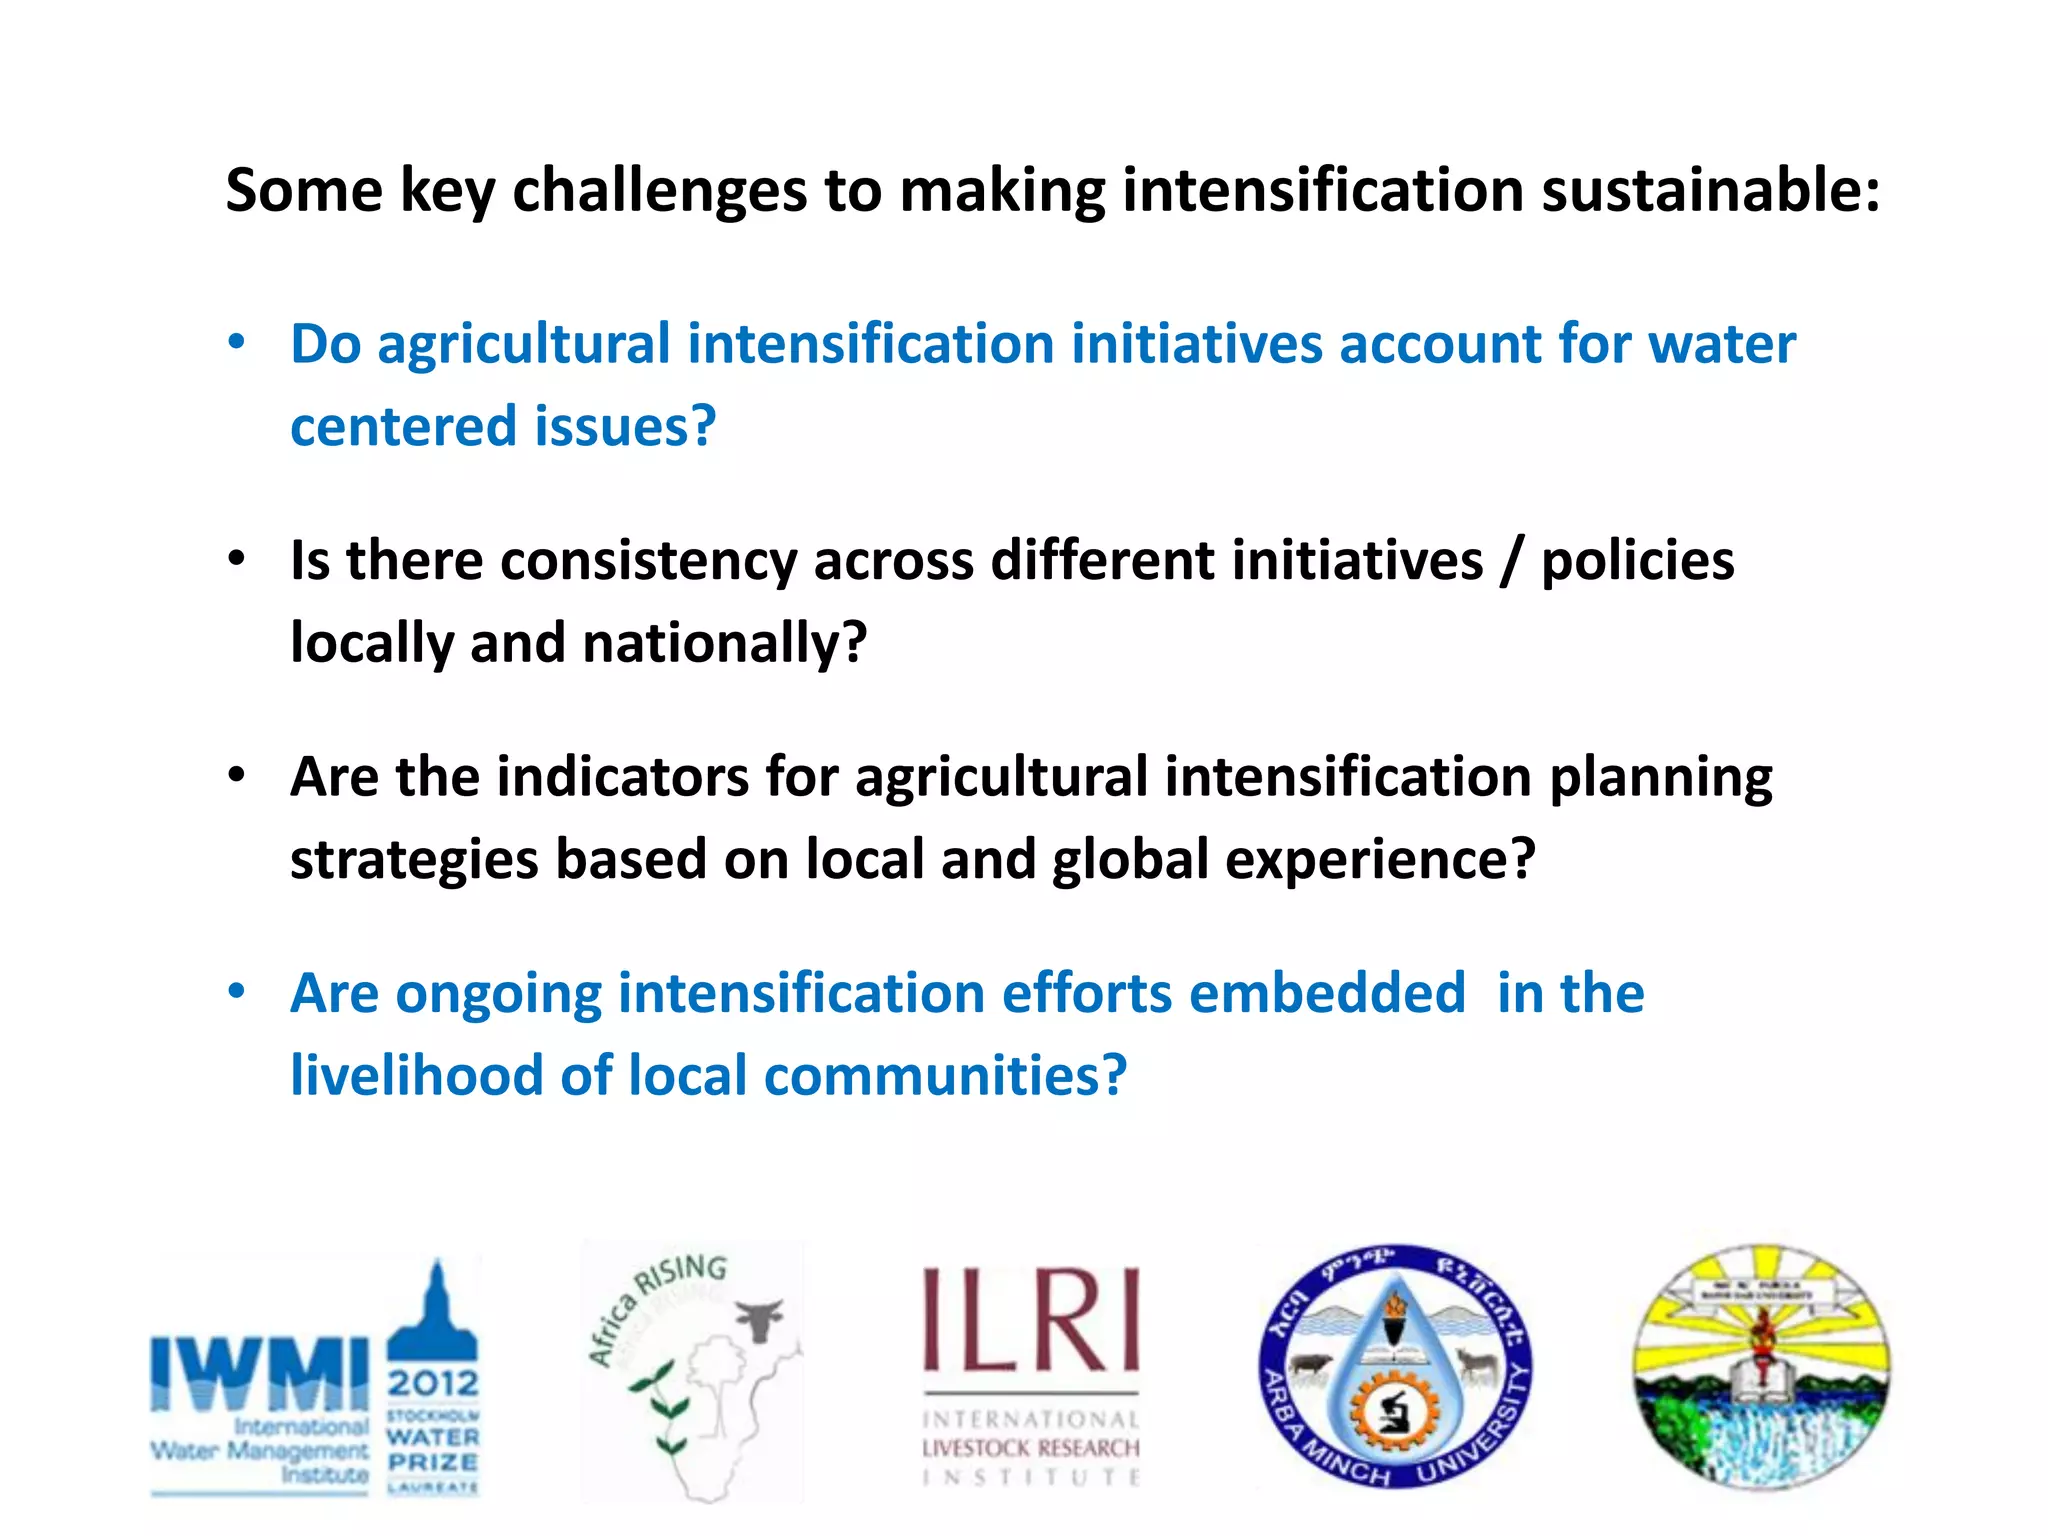
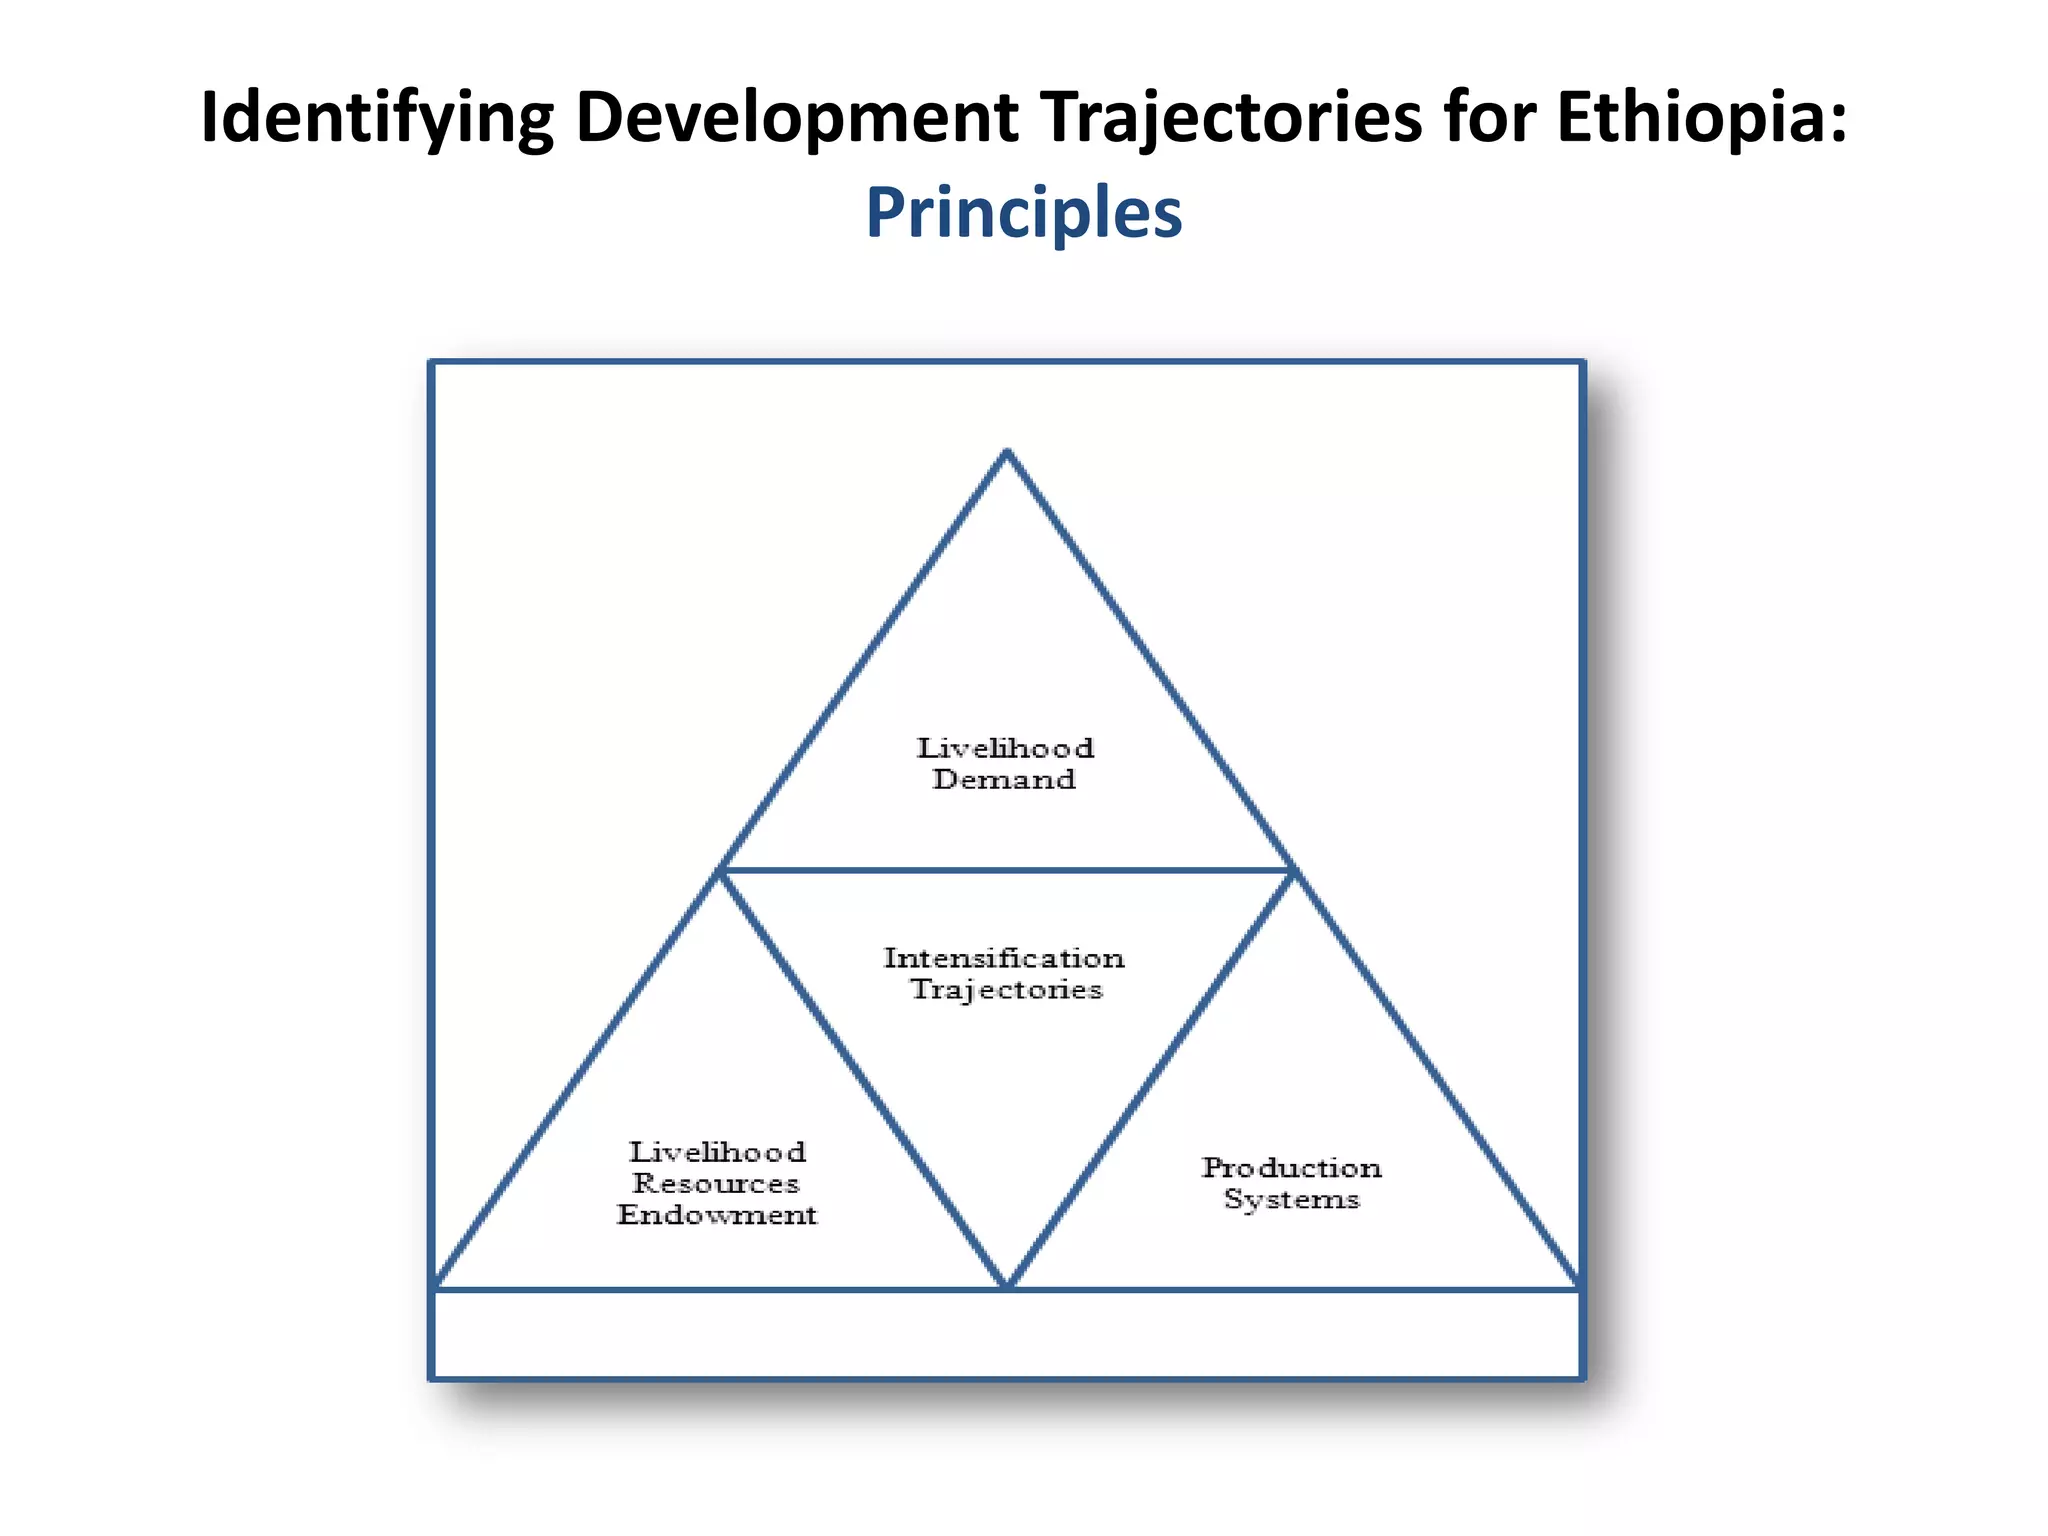
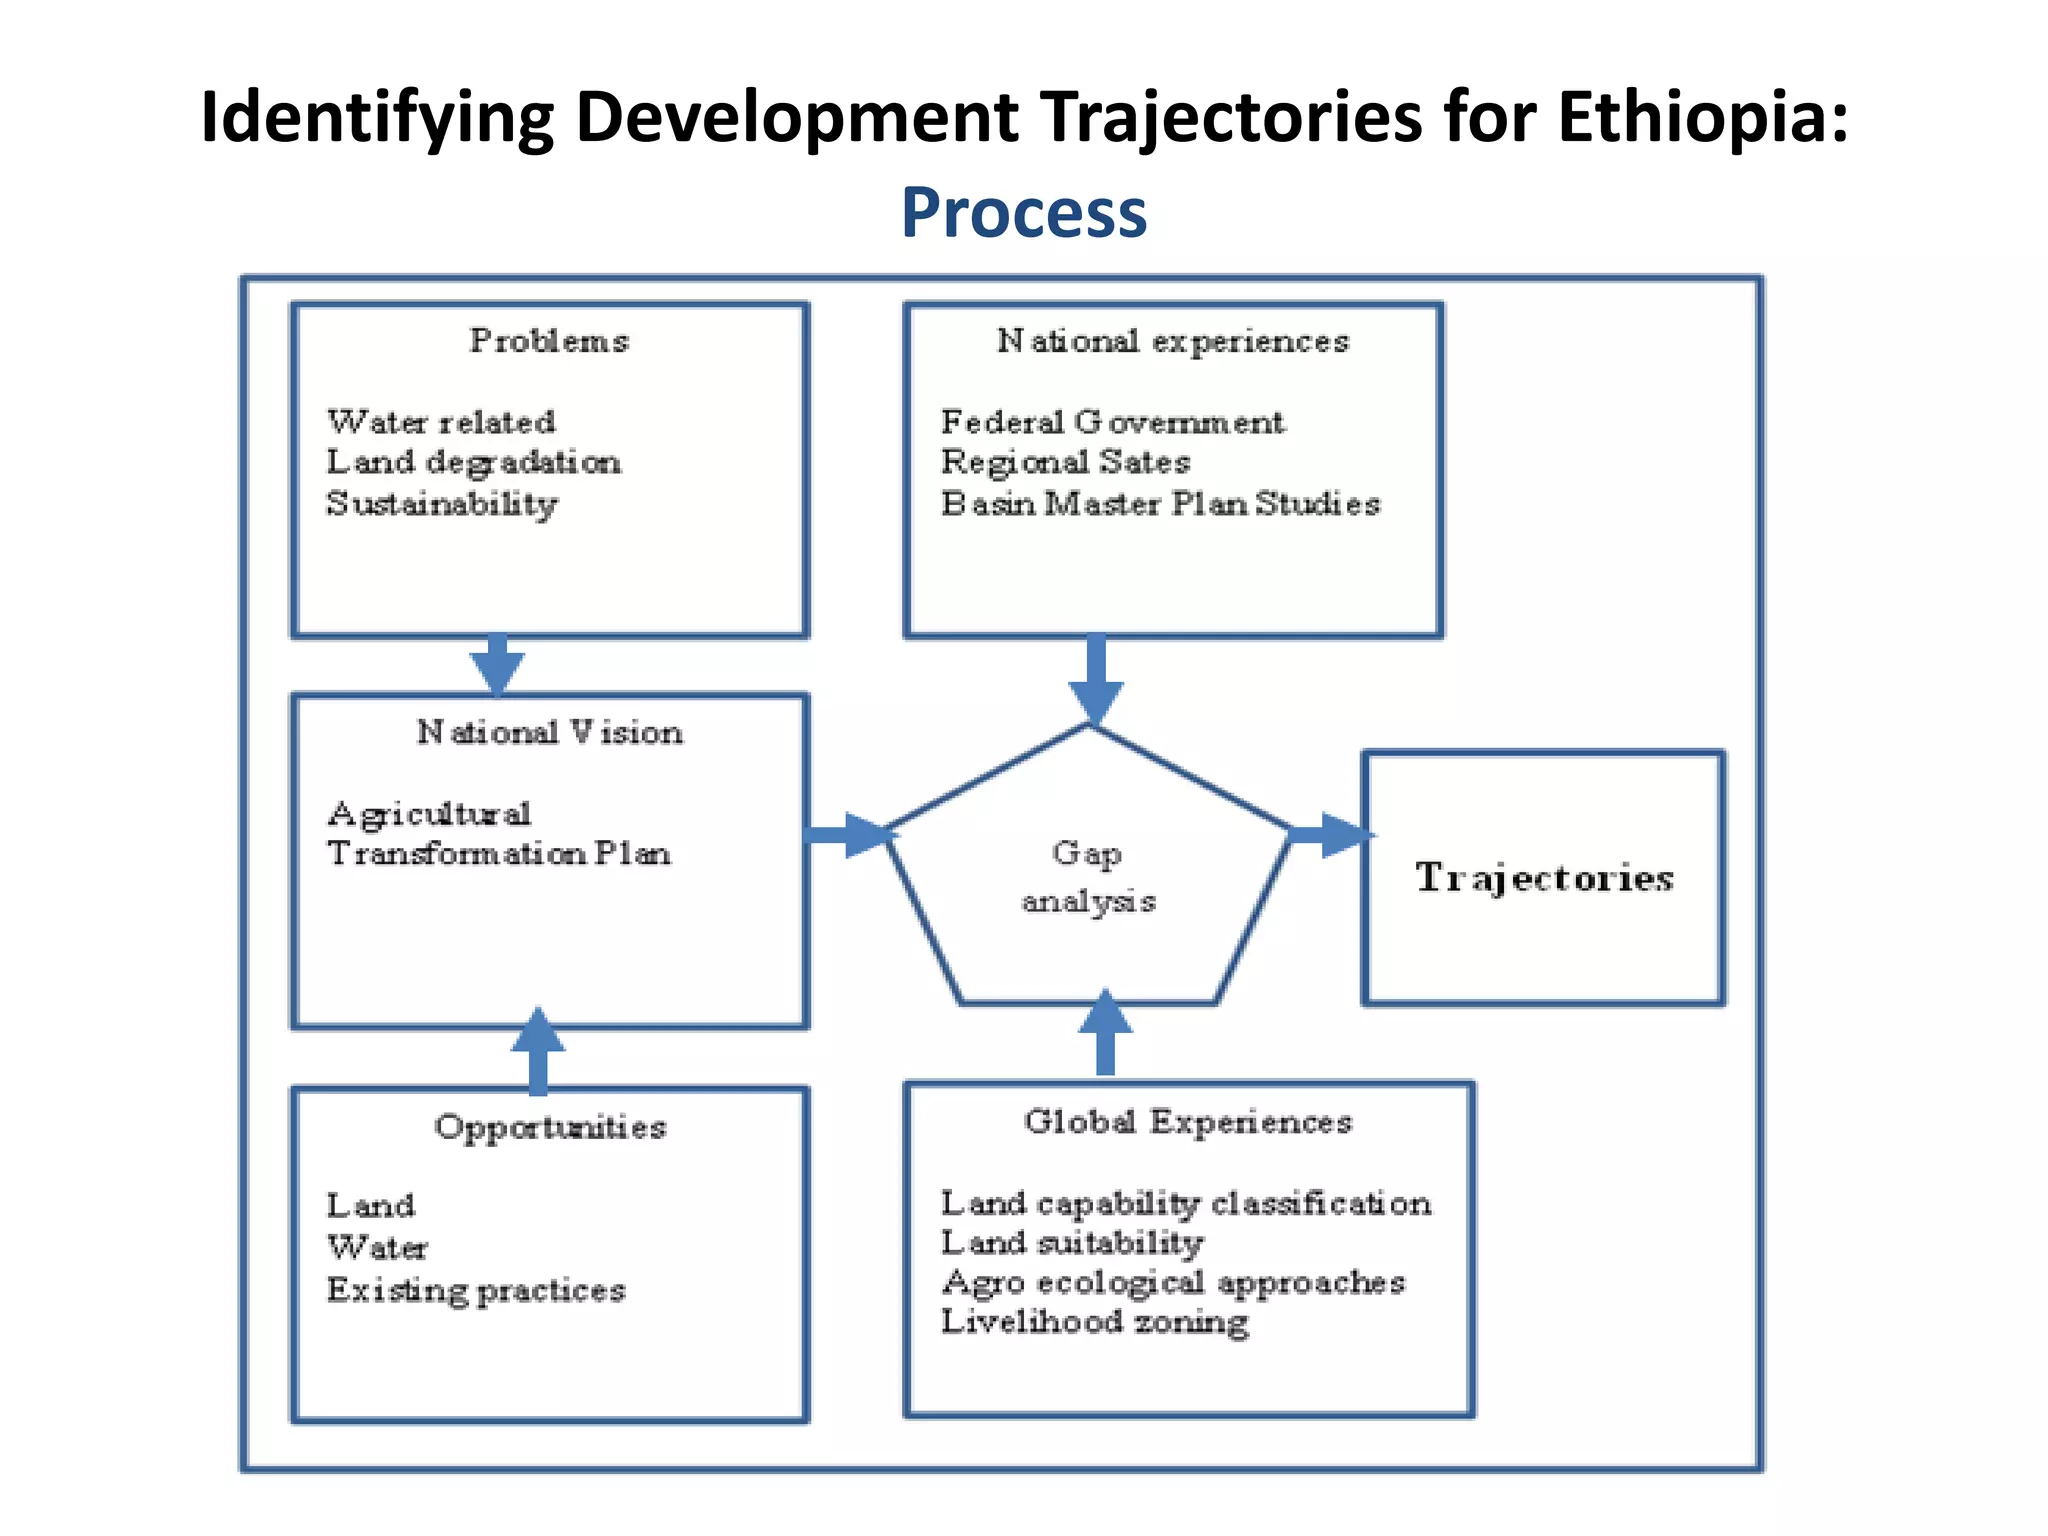
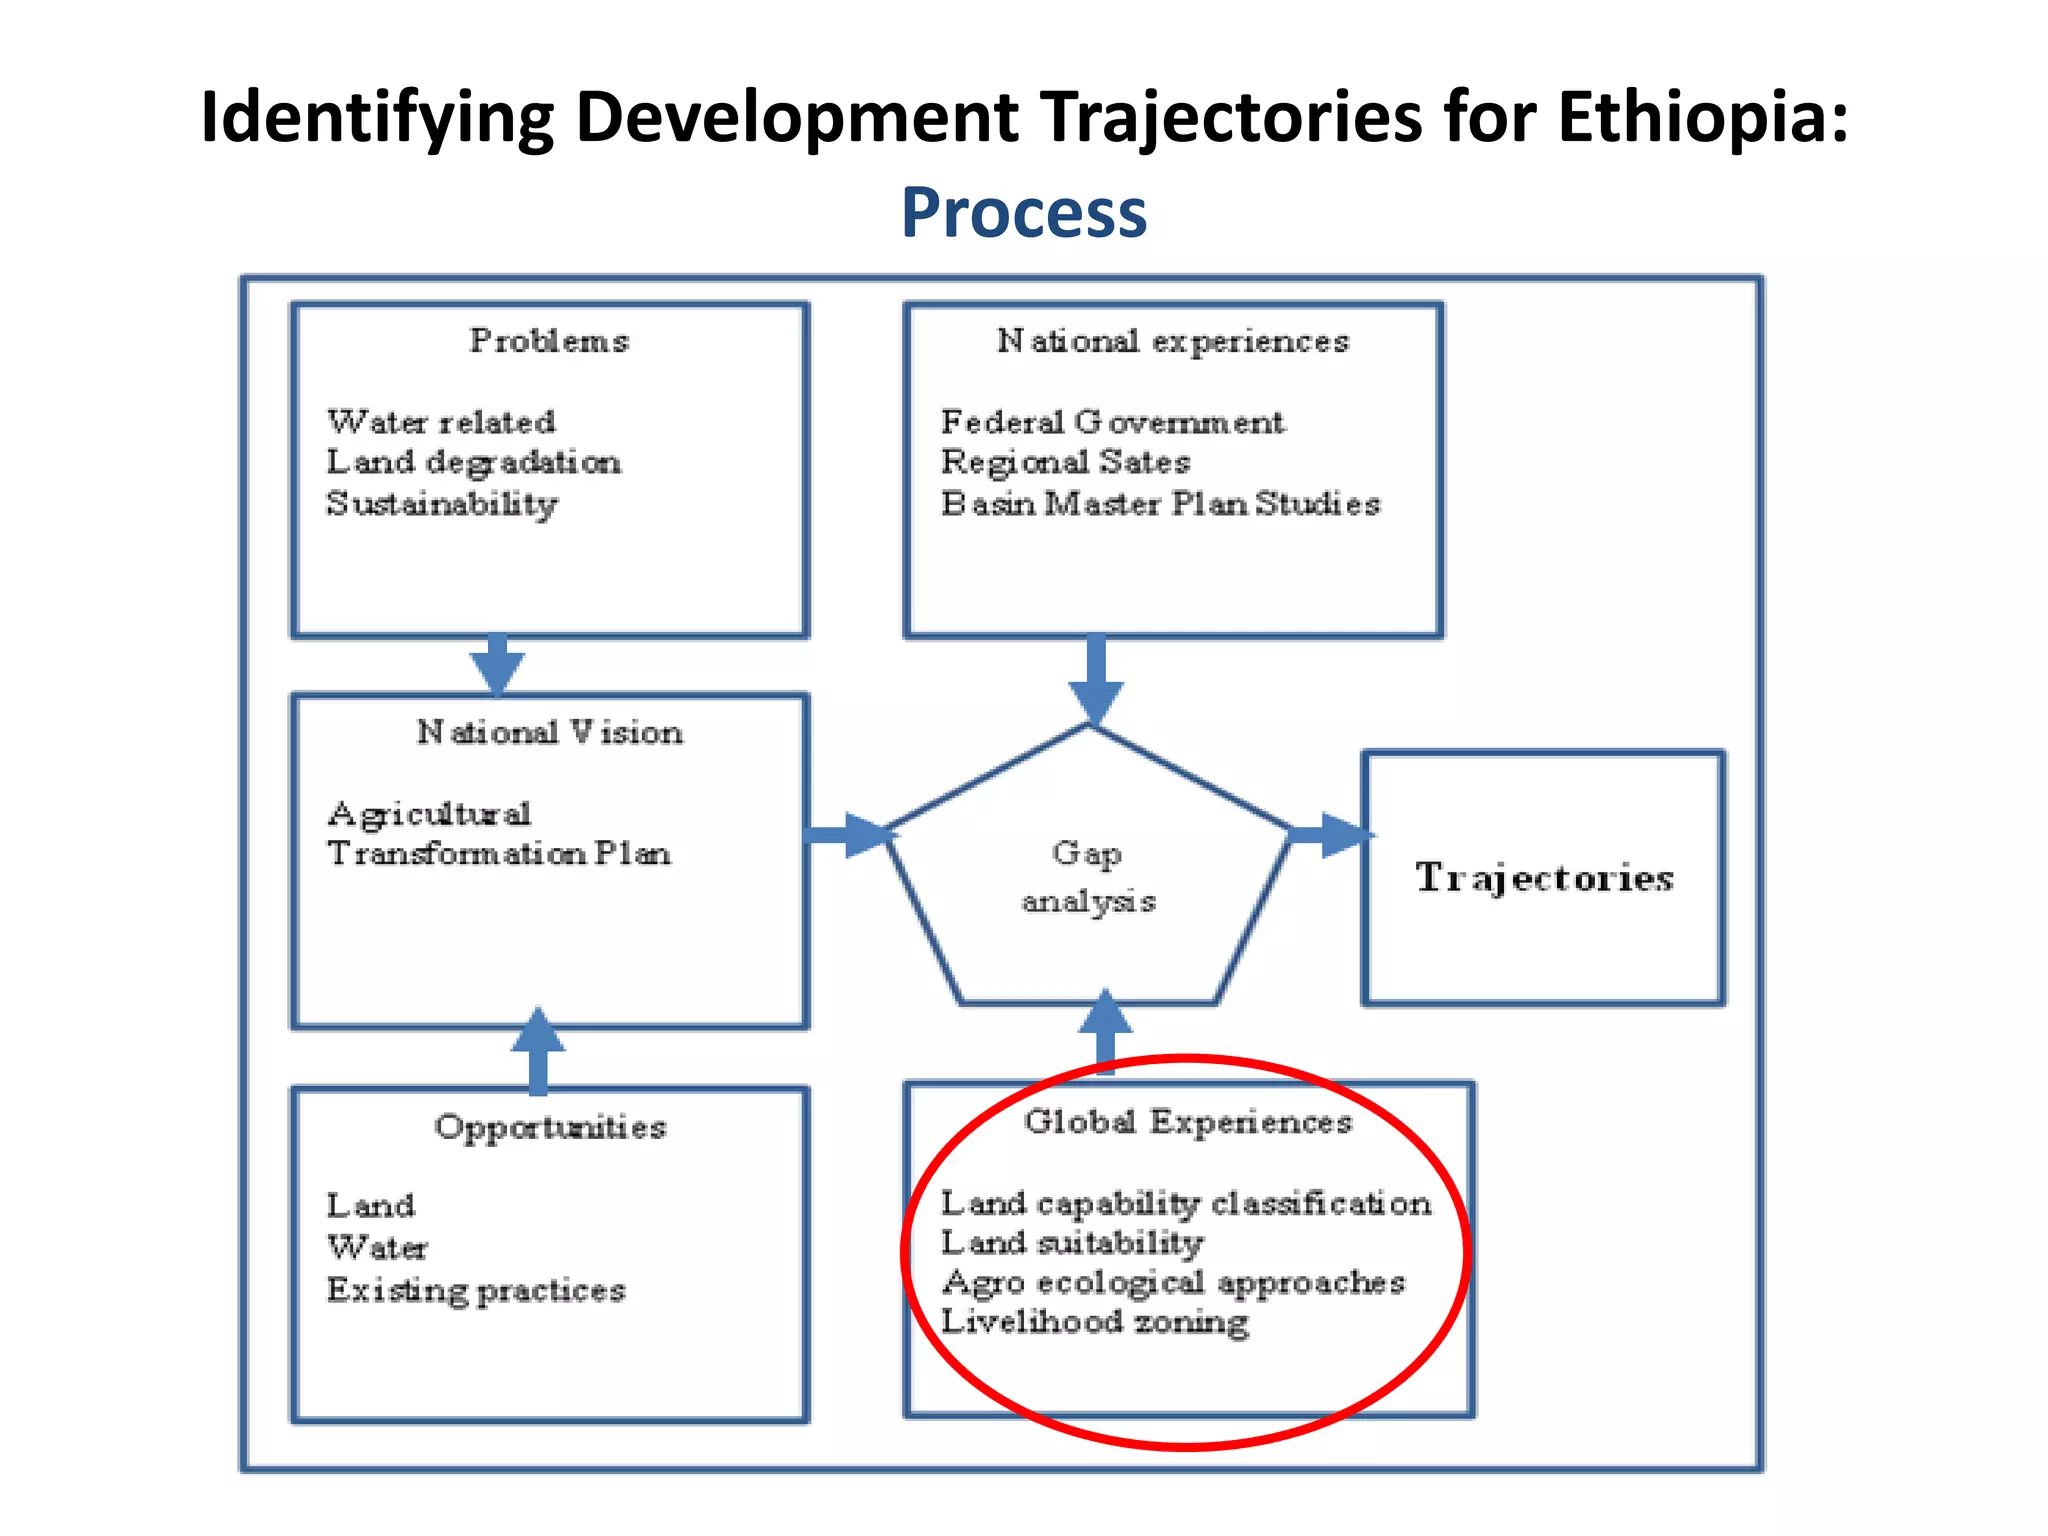
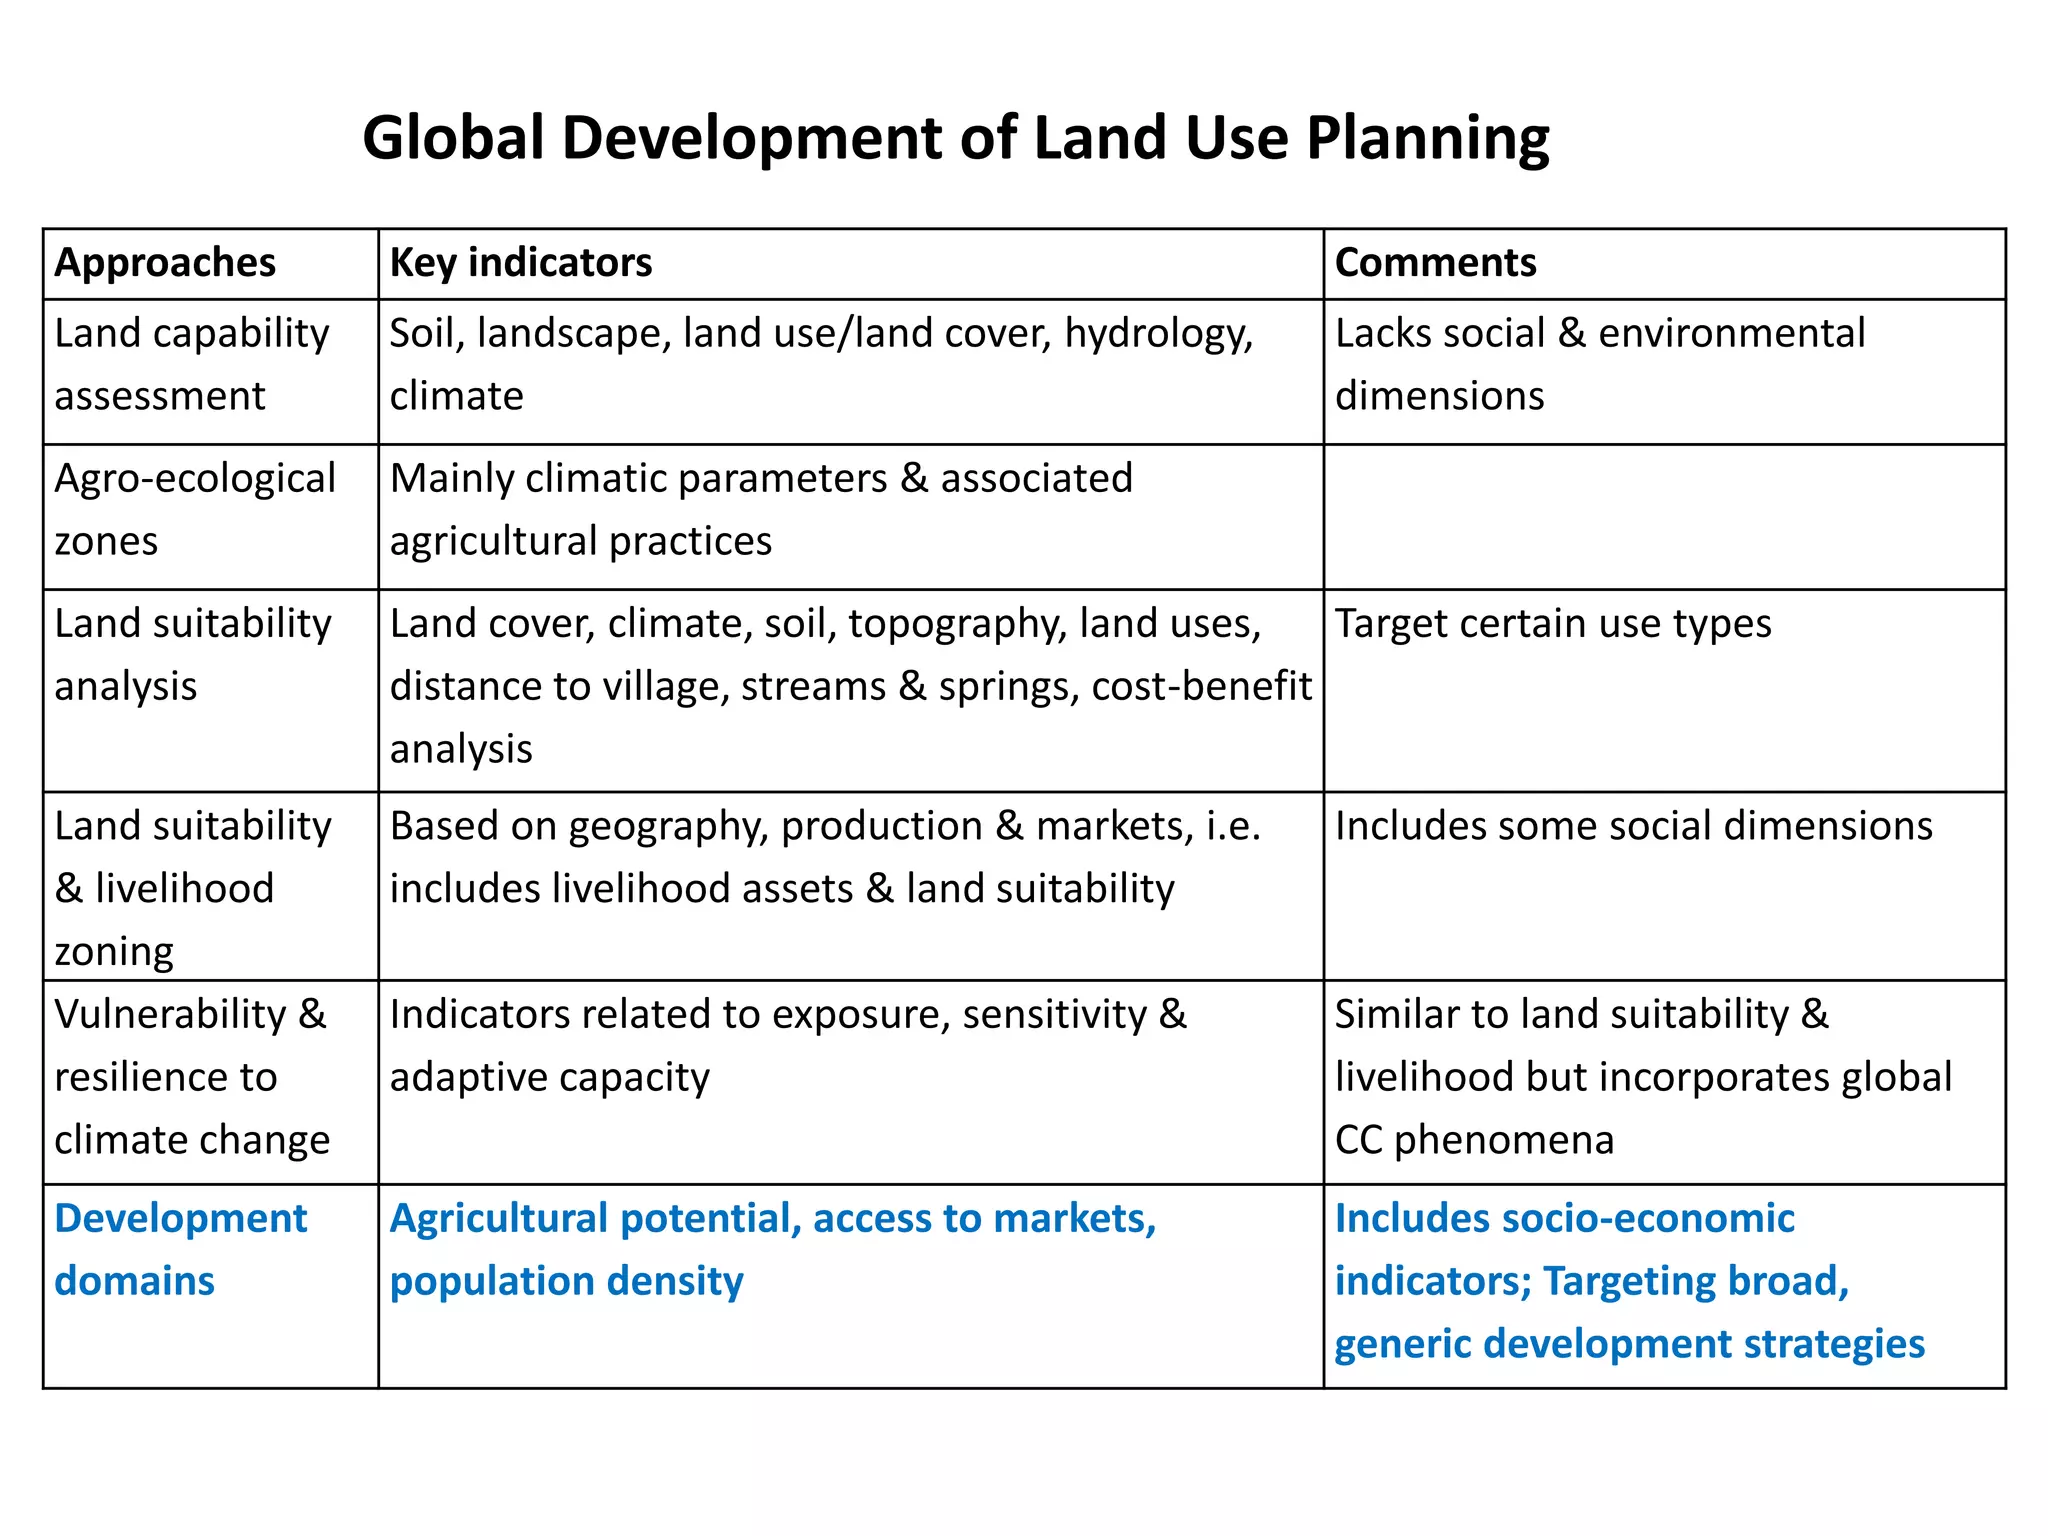
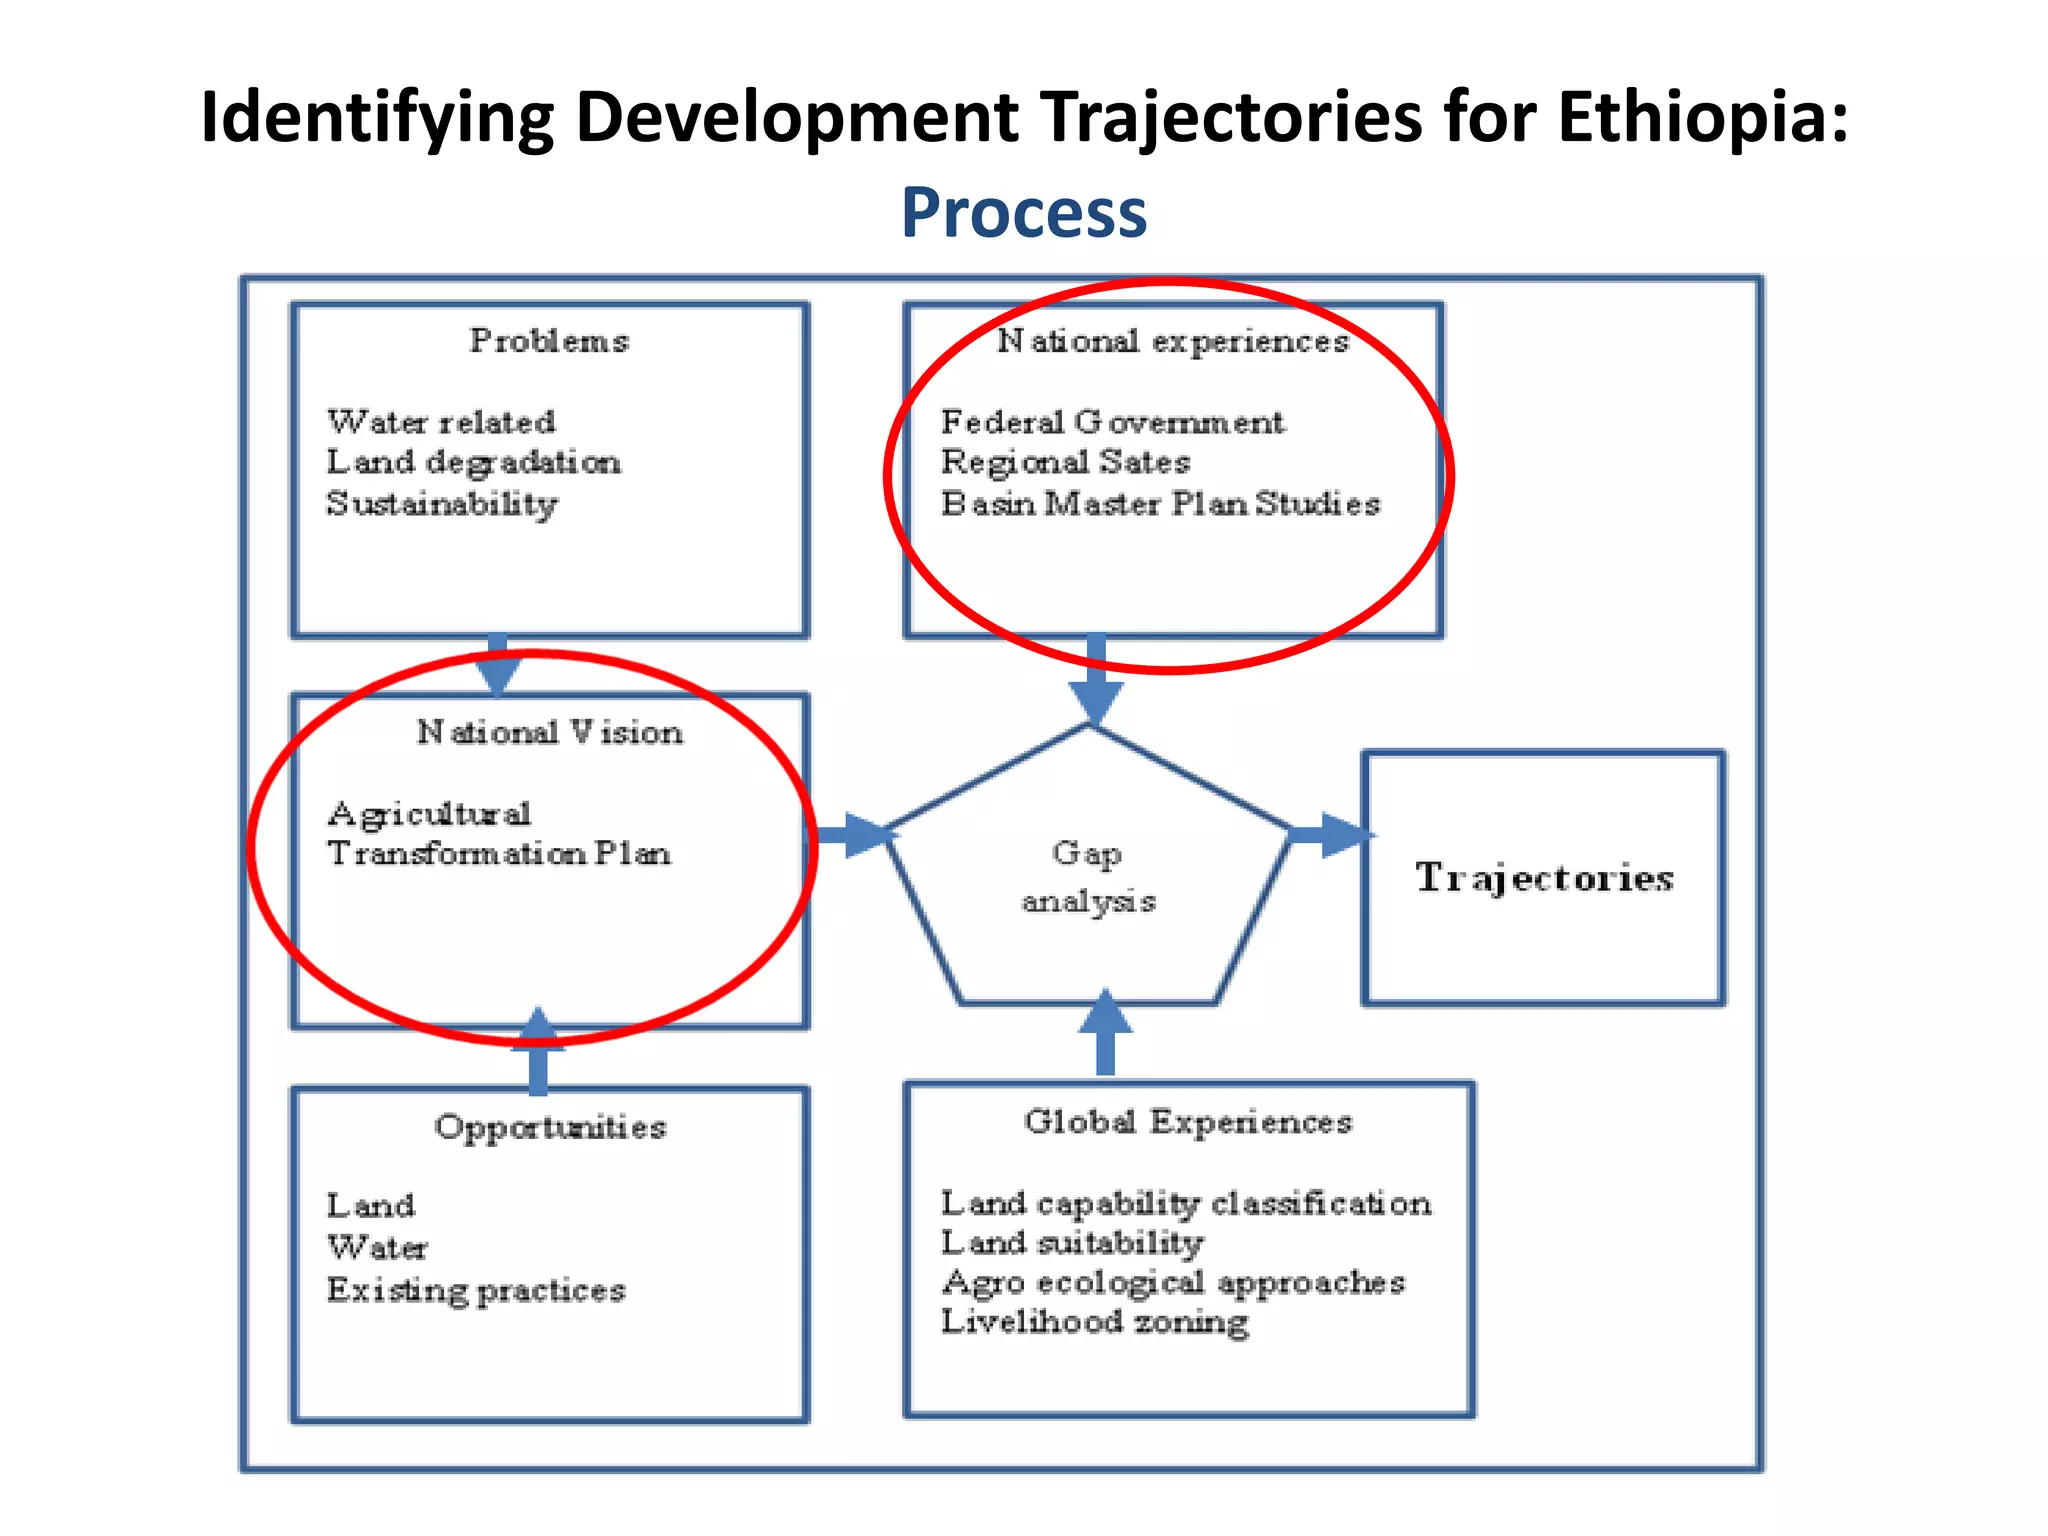
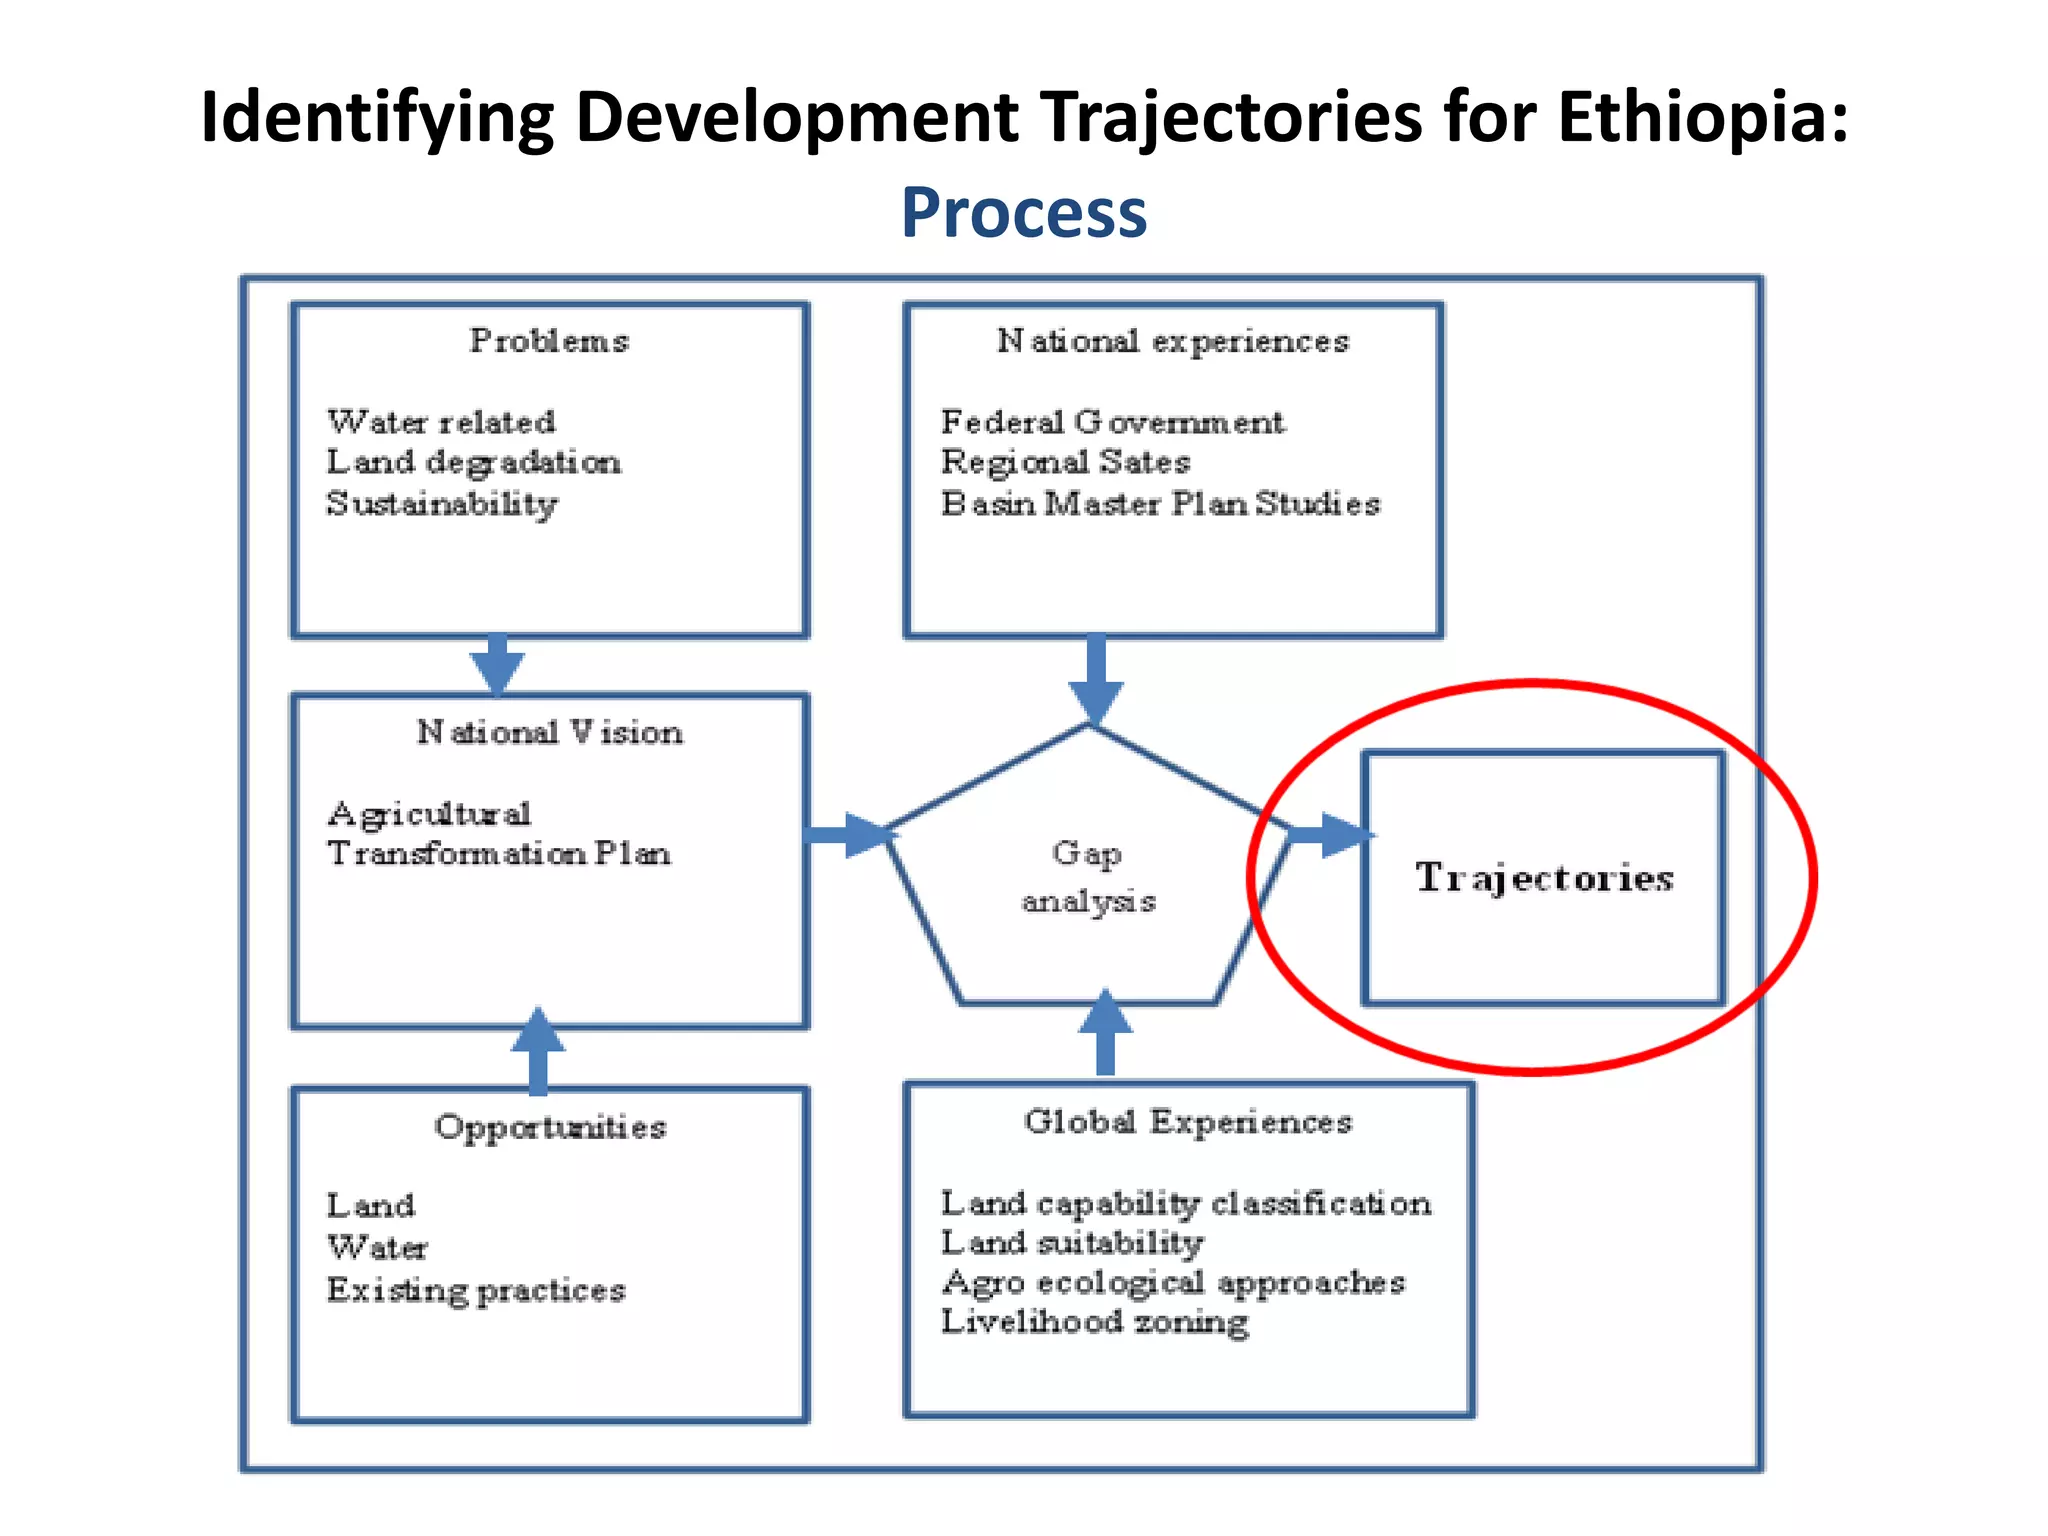

The document outlines updates on water-related indicators for sustainable crop-livestock intensification in Ethiopia as part of the 'Early Win' project. It discusses the project objectives, methodologies, and the outcomes aimed at alleviating hunger and poverty through improved farming systems. Furthermore, it addresses the challenges and principles for identifying effective agricultural intensification trajectories tailored to local biophysical and socio-economic conditions.


![[Day 1] Keynote - Opening Remarks and Challenges](https://cdn.slidesharecdn.com/ss_thumbnails/cgiar-csi-day1-31mar2009-opening-agra-090405004217-phpapp01-thumbnail.jpg?width=640&height=640&fit=bounds)


![Coded Agents – with UiPath SDK + LangGraph [Virtual Hands-on Workshop]](https://cdn.slidesharecdn.com/ss_thumbnails/codedagentsdeck-251215155422-5497c599-thumbnail.jpg?width=640&height=640&fit=bounds)
