Download to read offline

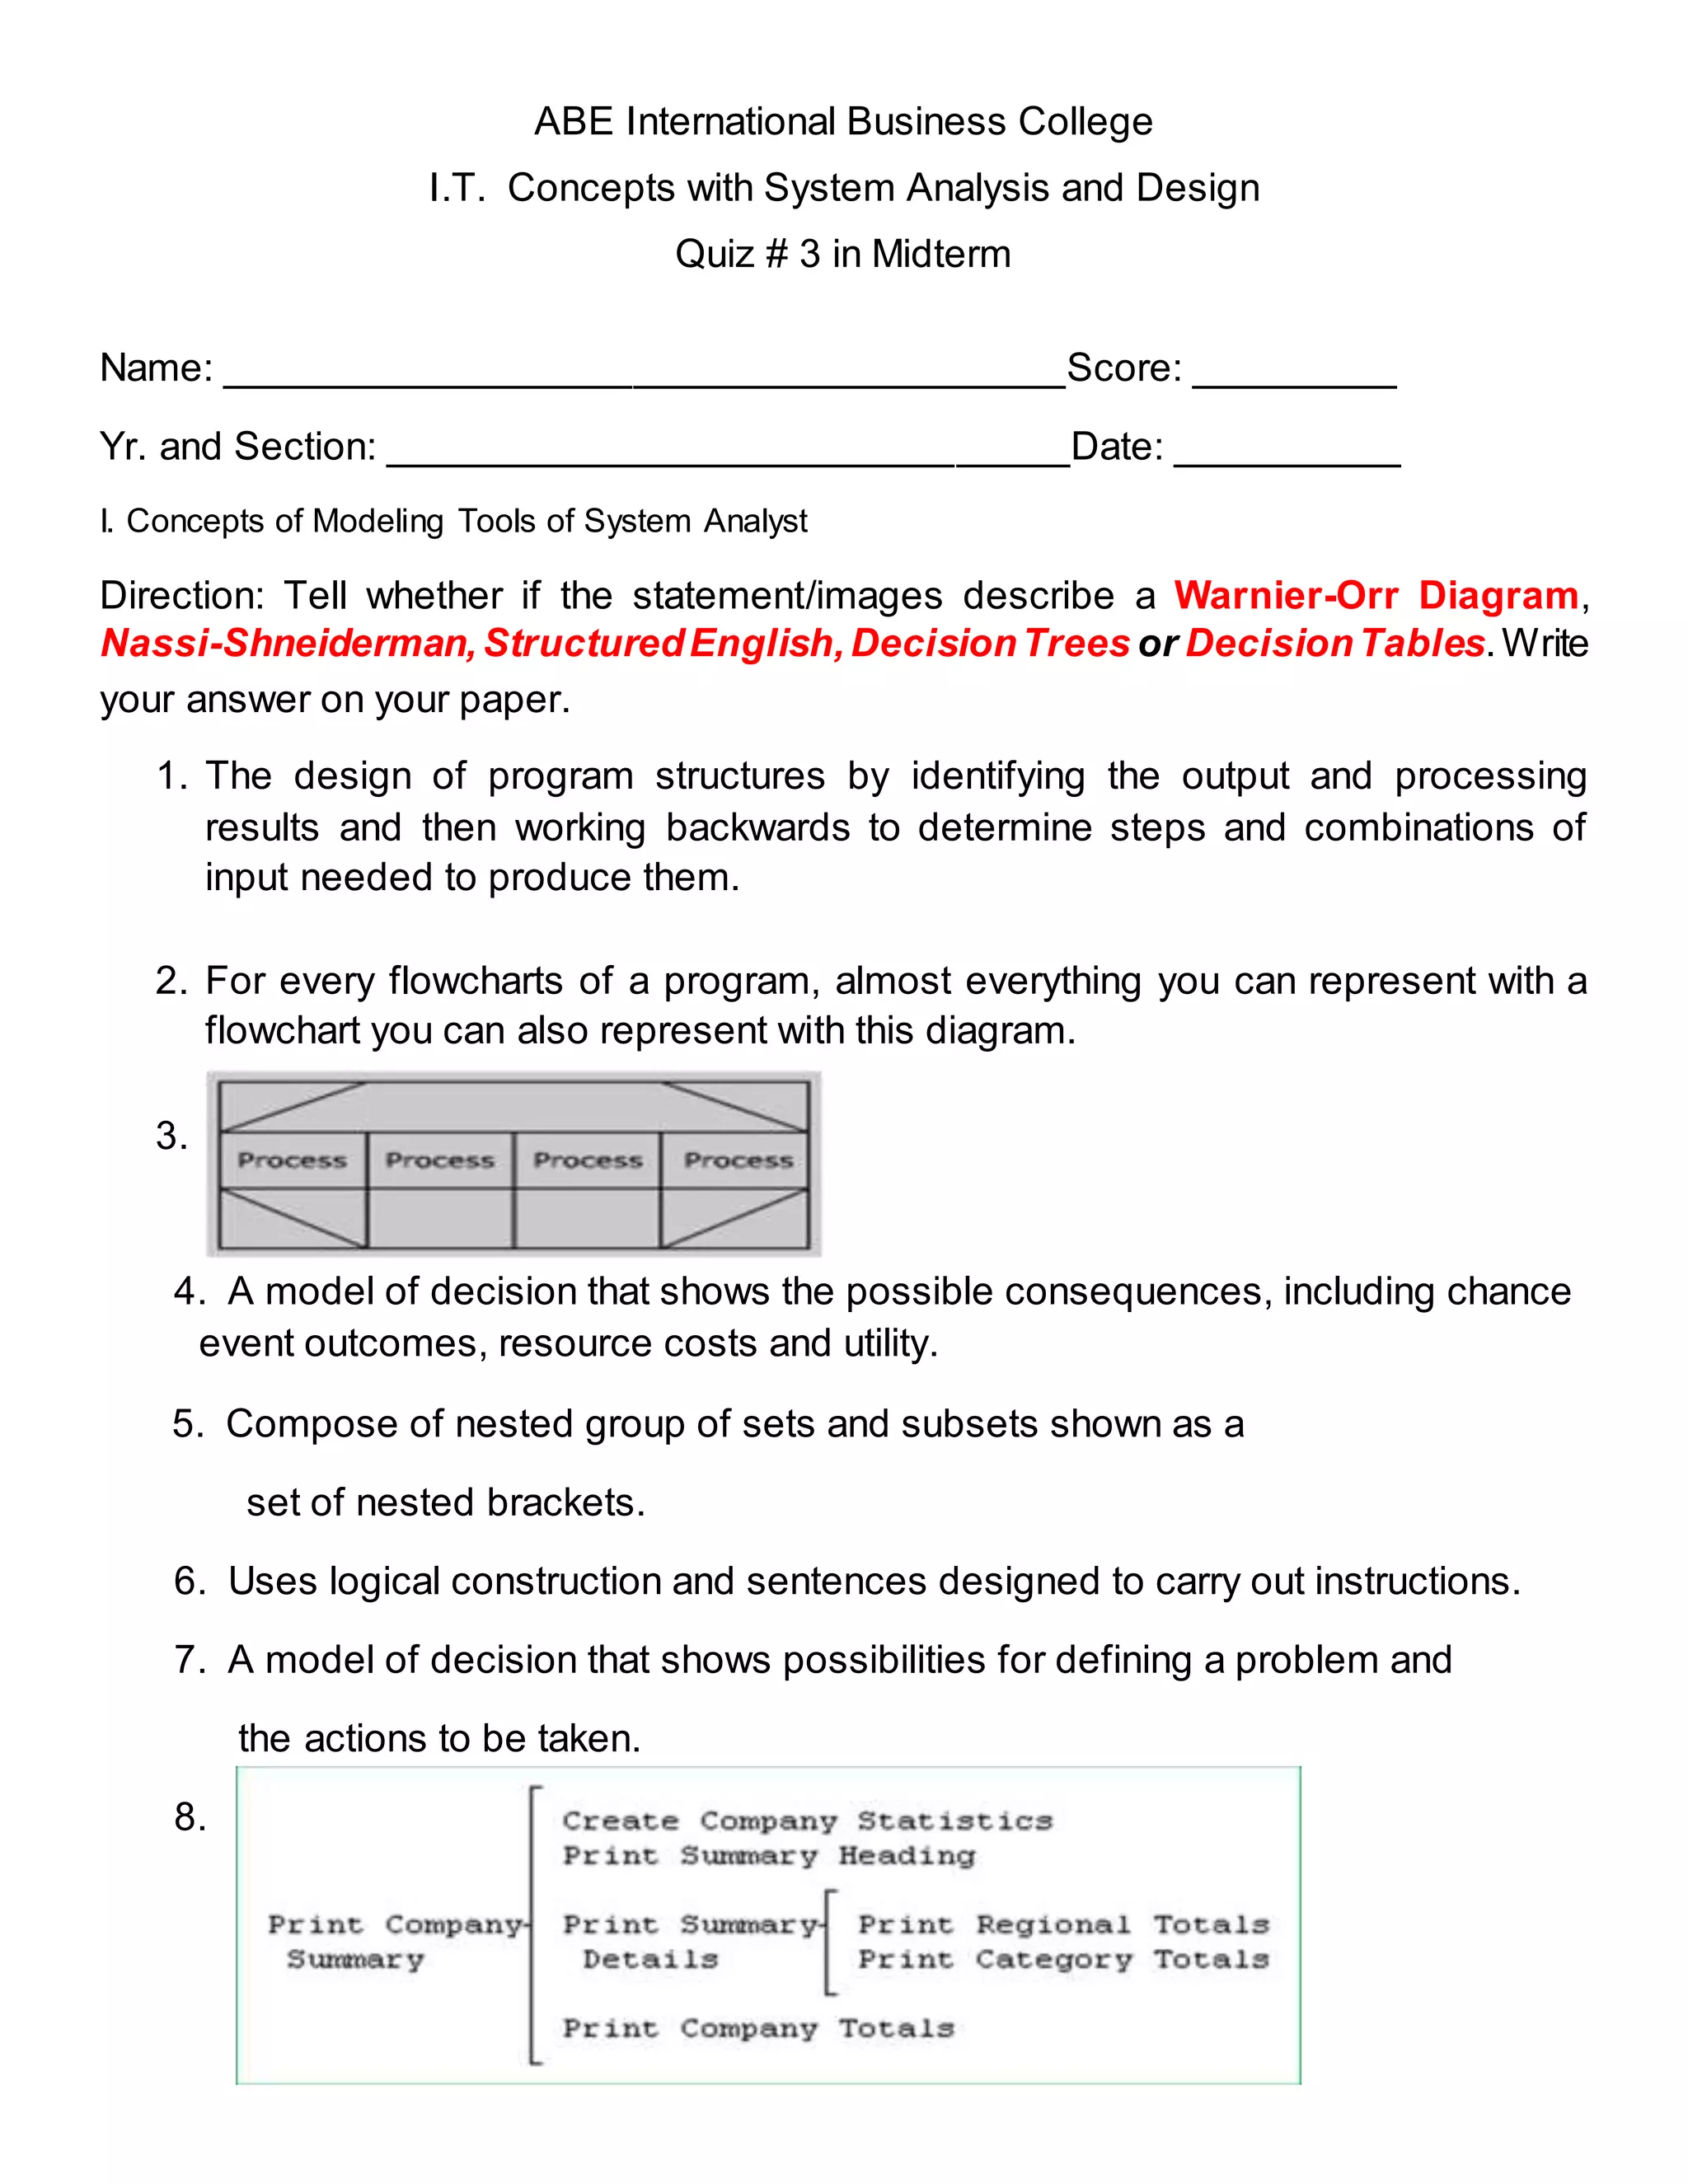
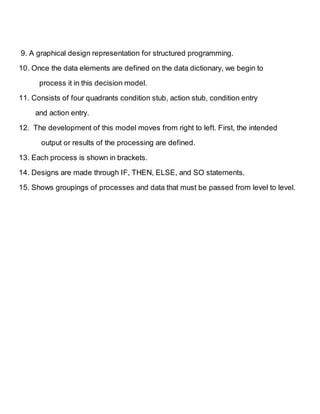

1. The document is a quiz from ABE International Business College assessing concepts of modeling tools used in system analysis and design. 2. The quiz contains 15 multiple choice questions asking students to identify whether statements or images describe a Warnier-Orr diagram, Nassi-Shneiderman diagram, structured English, decision trees, or decision tables. 3. The questions cover topics like the development process of different modeling tools, their graphical representations, logical constructions, and use in defining problems and determining necessary steps and combinations of inputs.