Download as PDF, PPTX


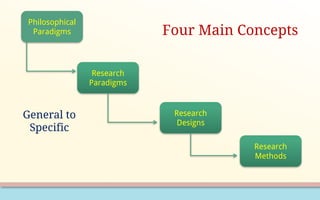

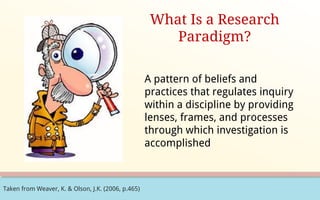
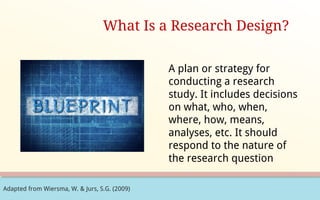
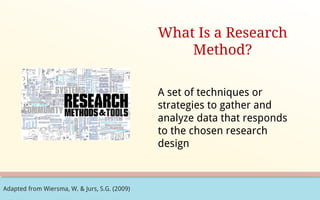

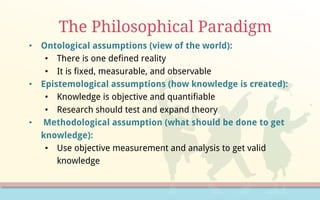
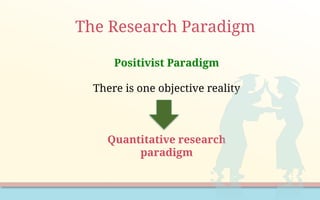
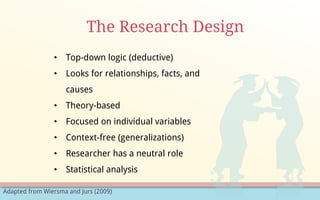
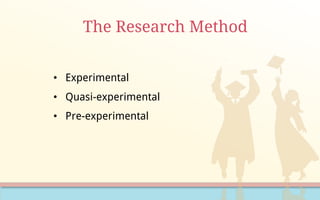
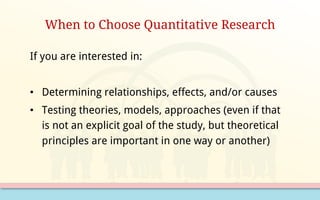
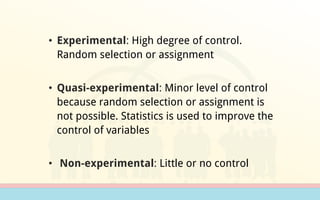


The document discusses the application of quantitative research methodologies in postgraduate education, focusing on key concepts like philosophical paradigms, research designs, and various quantitative research methods. It outlines characteristics of quantitative research, including the positivist paradigm, and details different experimental and quasi-experimental designs that can be utilized to establish relationships or effects within research studies. Additionally, it emphasizes how the research question dictates the appropriate methodological approach and highlights the importance of rigorous data analysis.


![Experimentalresearch[1]](https://cdn.slidesharecdn.com/ss_thumbnails/experimentalresearch1-090414212522-phpapp01-thumbnail.jpg?width=640&height=640&fit=bounds)