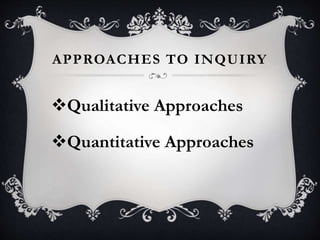
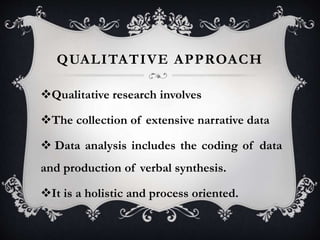
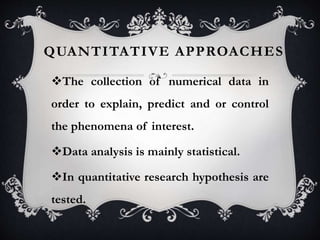
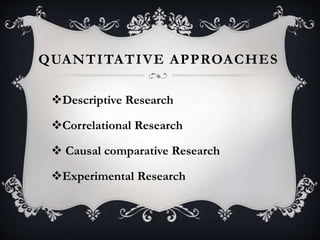
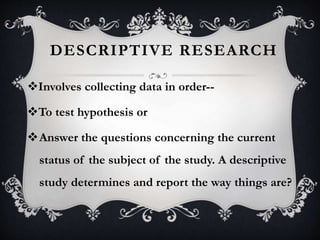
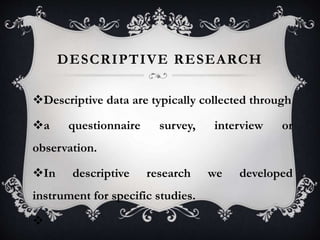
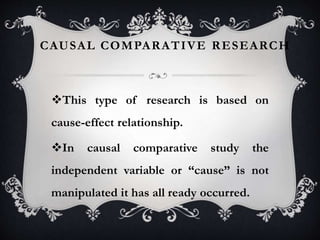
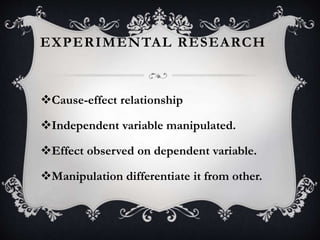
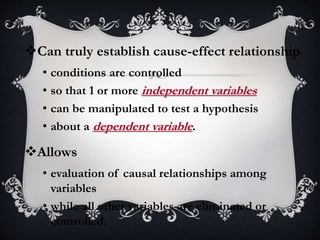
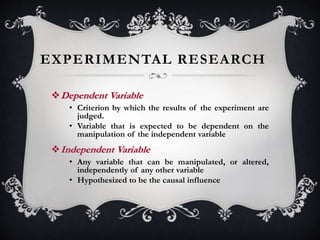
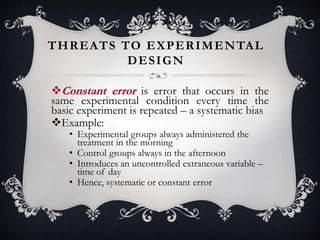
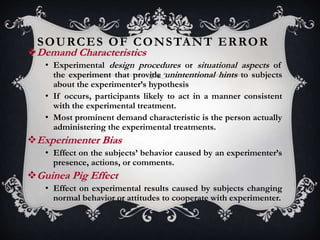
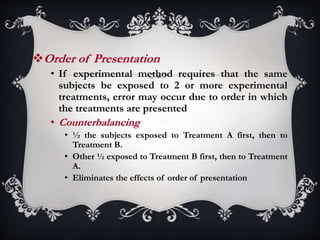
PRESENTATION
Assalam-o-Aliakum
Respected Madam
Class fellows
Presenter
Fazal Hayat
APPROACHES TO INQUIRY
Qualitative Approaches
Quantitative Approaches
QUALITATIVE APPROACH
In qualitative research we study many variables.
It give answer of what, why, how.
In qualitative research we do not want to
control or intervene anything,
But to study the phenomena as they are or were
in naturalistic setting
QUALITATIVE APPROACH
Qualitative research involves
The collection of extensive narrative data
 Data analysis includes the coding of data
and production of verbal synthesis.
It is a holistic and process oriented.
QUANTITATIVE APPROACHES
The collection of numerical data in
order to explain, predict and or control
the phenomena of interest.
Data analysis is mainly statistical.
In quantitative research hypothesis are
tested.
QUANTITATIVE APPROACHES
It is more focused and process oriented.
In this research we study one or small
number of variables in order to describe the
current relationship/condition.
It wants to control or intervene the
variables
QUANTITATIVE APPROACHES
Descriptive Research
Correlational Research
 Causal comparative Research
Experimental Research
DESCRIPTIVE RESEARCH
Involves collecting data in order--
To test hypothesis or
Answer the questions concerning the current
status of the subject of the study. A descriptive
study determines and report the way things are?
DESCRIPTIVE RESEARCH
Descriptive data are typically collected through
a questionnaire survey, interview or
observation.
In descriptive research we developed
instrument for specific studies.

DESCRIPTIVE RESEARCH
Instruments development requires
time and skills
For example: How does secondary
school teacher spend their time in
classroom.
CORRELATIONAL RESEARCH
Attempts to determine whether and, to what
degree, a relationship exist between two or
more quantifiable variables.
The purpose of correlational research study
may be establish relationship (or lack of it) or
to use a relationship to make prediction. The
correlational research never establish a cause-
effect relationship, only a relationship.
The existence of high relationship permits
prediction. The degree of relationship between
two variables are generally expressed as
correlation co-efficient which is a number
between 0.00 – 1.00.
Two variables that are not related will produced a
co-efficient near to .00 and the two variables that are
highly related will produced a co-efficient near to
1.00.
For making any decision the degree of
relationship is necessary
For Example:
The relation between intelligence and self-esteem.
CAUSAL COMPARATIVE RESEARCH
This type of research is based on
cause-effect relationship.
In causal comparative study the
independent variable or “cause” is not
manipulated it has all ready occurred.
Due to lack of manipulation and control
cause effect relationship established are the
best tenuous and tentative, causal
comparative studies are less expensive and
take less time to conduct
 For Example:
 The effect of Gender on algebra
achievement
EXPERIMENTAL RESEARCH
Cause-effect relationship
Independent variable manipulated.
Effect observed on dependent variable.
Manipulation differentiate it from other.
Can truly establish cause-effect relationship
• conditions are controlled
• so that 1 or more independent variables
• can be manipulated to test a hypothesis
• about a dependent variable.
Allows
• evaluation of causal relationships among
variables
• while all other variables are eliminated or
controlled.
EXPERIMENTAL RESEARCH
Dependent Variable
• Criterion by which the results of the experiment are
judged.
• Variable that is expected to be dependent on the
manipulation of the independent variable
Independent Variable
• Any variable that can be manipulated, or altered,
independently of any other variable
• Hypothesized to be the causal influence
Experimental Treatments
• Alternative manipulations of the independent
variable being investigated
Experimental Group
• Group of subjects exposed to the experimental
treatment
Control Group
• Group of subjects exposed to the control
condition
• Not exposed to the experimental treatment
SYMBOLISM FOR DIAGRAMMING
EXPERIMENTAL DESIGNS
 X = exposure of a group to an experimental treatment
 O = observation or measurement of the dependent
variable
 If multiple observations or measurements are taken,
 subscripts indicate temporal order – i.e., O1, O2, etc.
 R = random assignment of test units;
 individuals selected as subjects for the experiment
 are randomly assigned to the experimental groups
PRE-EXPERIMENTAL DESIGNS
Do not adequately control for the problems
associated with loss of external or internal validity
Cannot be classified as true experiments
Often used in exploratory research
Three Examples of Pre-Experimental Designs
• One-Shot Design
• One-Group Pretest-Posttest Design
• Static Group Design
ONE-SHOT DESIGN
 After-only design
 A single measure is recorded after the treatment is administered
 Study lacks any comparison or control of extraneous influences
 No measure of test units not exposed to the experimental
treatment
 May be the only viable choice in taste tests
 Diagrammed as: X O1
ONE-GROUP PRETEST-POSTTEST
DESIGN
Subjects in the experimental group are measured
before and after the treatment is administered.
No control group
Offers comparison of the same individuals before
and after the treatment (e.g., training)
If time between 1st & 2nd measurements is extended,
may suffer maturation
Can also suffer from history, mortality, and testing
effects
Diagrammed as O1 X O2
STATIC GROUP DESIGN
 After-only design with control group
 Experimental group is measured after being exposed to the
experimental treatment
 Control group is measured without having been exposed to the
experimental treatment
 No pre-measure is taken
 Major weakness is lack of assurance that the groups were equal on
variables of interest prior to the treatment
 Diagrammed as: Experimental Group X O1
Control Group O2
PRETEST-POSTTEST
CONTROL GROUP DESIGN
Diagrammed as
Experimental Group: R O1 X O2
• Control Group: R O3 O4
Effect of the experimental
treatment equals
(O2 – O1) -- (O4 – O3)
POSTTEST-ONLY CONTROL
GROUP DESIGN
 After-Only with Control
 True experimental design
 Experimental group tested after treatment exposure
 Control group tested at same time without exposure to experimental treatment
 Includes random assignment to groups
 Effect of all extraneous variables assumed to be the same on both groups
 Do not run the risk of a testing effect
 Use in situations when cannot pretest
Diagrammed as
• Experimental Group: X O1
• Control Group: O2
Effect of the experimental treatment
equals
(O2 – O1)
SOLOMON FOUR-GROUP DESIGN
 True experimental design
 Combines pretest-posttest with control group design
and the posttest-only with control group design
 Provides means for controlling the interactive testing
effect and other sources of extraneous variation
 Does include random assignment
Diagrammed as
• Experimental Group 1: R O1 X O2
• Control Group 1: R O3 O4
• Experimental Group 2: R X O5
• Control Group 2: R O6
Effect of independent variable (O2 – O4) & (O5 – O6)
Effect of pretesting (O4 – O6)
Effect of pretesting & measuring (O2 – O5)
Effect of random assignment (O1 – O3)
THREATS TO EXPERIMENTAL
DESIGN
Constant error is error that occurs in the
same experimental condition every time the
basic experiment is repeated – a systematic bias
Example:
• Experimental groups always administered the
treatment in the morning
• Control groups always in the afternoon
• Introduces an uncontrolled extraneous variable –
time of day
• Hence, systematic or constant error
SOURCES OF CONSTANT ERROR
Demand Characteristics
• Experimental design procedures or situational aspects of
the experiment that provide unintentional hints to subjects
about the experimenter’s hypothesis
• If occurs, participants likely to act in a manner consistent
with the experimental treatment.
• Most prominent demand characteristic is the person actually
administering the experimental treatments.
Experimenter Bias
• Effect on the subjects’ behavior caused by an experimenter’s
presence, actions, or comments.
Guinea Pig Effect
• Effect on experimental results caused by subjects changing
normal behavior or attitudes to cooperate with experimenter.
FACTORS AFFECTING
INTERNAL VALIDITY
History Effect
• Specific events in the external environment between the 1st
& 2nd measurements that are beyond the experimenter’s
control
• Common history effect occurs when competitors change
their marketing strategies during a test marketing
experiment
Cohort Effect
• Change in the dependent variable that occurs because
members of one experimental group experienced different
historical situations than members of other experimental
groups
Maturation Effect
• Effect on experimental results caused by
experimental subjects maturing or changing over
time
• During a daylong experiment, subjects may grow
hungry, tired, or bored
Testing Effect
• In before-and-after studies, pretesting may
sensitize subjects when taking a test for the 2nd
time.
• May cause subjects to act differently than they
would have if no pretest measures were taken
Instrumentation Effect
• Caused by a change in the wording of questions, in
interviewers, or in other procedures used to measure
the dependent variable.
Selection Effect
• Sampling bias that results from differential selection
of respondents for the comparison groups.
Mortality or Sample Attrition
• Results from the withdrawal of some subjects from
the experiment before it is completed
• Effects randomization
• Especially troublesome if some withdraw from one
treatment group and not from the others (or at least
at different rates)
CONTROLLING
EXTRANEOUS VARIABLES
Blinding
• Technique used to control subjects’ knowledge of whether
or not they have been given the experimental treatment.
• Taste tests, placebos (chemically inert pills), etc.
Constancy of Conditions
• Subjects in experimental & control groups are exposed to
identical situations except for differing conditions of the
independent variable.
Order of Presentation
• If experimental method requires that the same
subjects be exposed to 2 or more experimental
treatments, error may occur due to order in which
the treatments are presented
• Counterbalancing
• ½ the subjects exposed to Treatment A first, then to
Treatment B.
• Other ½ exposed to Treatment B first, then to Treatment
A.
• Eliminates the effects of order of presentation
THANKS

A Presentation on Types of Quantitative Research

  • 1.
  • 2.
    APPROACHES TO INQUIRY QualitativeApproaches Quantitative Approaches
  • 3.
    QUALITATIVE APPROACH In qualitativeresearch we study many variables. It give answer of what, why, how. In qualitative research we do not want to control or intervene anything, But to study the phenomena as they are or were in naturalistic setting
  • 4.
    QUALITATIVE APPROACH Qualitative researchinvolves The collection of extensive narrative data  Data analysis includes the coding of data and production of verbal synthesis. It is a holistic and process oriented.
  • 5.
    QUANTITATIVE APPROACHES The collectionof numerical data in order to explain, predict and or control the phenomena of interest. Data analysis is mainly statistical. In quantitative research hypothesis are tested.
  • 6.
    QUANTITATIVE APPROACHES It ismore focused and process oriented. In this research we study one or small number of variables in order to describe the current relationship/condition. It wants to control or intervene the variables
  • 7.
    QUANTITATIVE APPROACHES Descriptive Research CorrelationalResearch  Causal comparative Research Experimental Research
  • 8.
    DESCRIPTIVE RESEARCH Involves collectingdata in order-- To test hypothesis or Answer the questions concerning the current status of the subject of the study. A descriptive study determines and report the way things are?
  • 9.
    DESCRIPTIVE RESEARCH Descriptive dataare typically collected through a questionnaire survey, interview or observation. In descriptive research we developed instrument for specific studies. 
  • 10.
    DESCRIPTIVE RESEARCH Instruments developmentrequires time and skills For example: How does secondary school teacher spend their time in classroom.
  • 11.
    CORRELATIONAL RESEARCH Attempts todetermine whether and, to what degree, a relationship exist between two or more quantifiable variables. The purpose of correlational research study may be establish relationship (or lack of it) or to use a relationship to make prediction. The correlational research never establish a cause- effect relationship, only a relationship.
  • 12.
    The existence ofhigh relationship permits prediction. The degree of relationship between two variables are generally expressed as correlation co-efficient which is a number between 0.00 – 1.00.
  • 13.
    Two variables thatare not related will produced a co-efficient near to .00 and the two variables that are highly related will produced a co-efficient near to 1.00. For making any decision the degree of relationship is necessary For Example: The relation between intelligence and self-esteem.
  • 14.
    CAUSAL COMPARATIVE RESEARCH Thistype of research is based on cause-effect relationship. In causal comparative study the independent variable or “cause” is not manipulated it has all ready occurred.
  • 15.
    Due to lackof manipulation and control cause effect relationship established are the best tenuous and tentative, causal comparative studies are less expensive and take less time to conduct  For Example:  The effect of Gender on algebra achievement
  • 16.
    EXPERIMENTAL RESEARCH Cause-effect relationship Independentvariable manipulated. Effect observed on dependent variable. Manipulation differentiate it from other.
  • 17.
    Can truly establishcause-effect relationship • conditions are controlled • so that 1 or more independent variables • can be manipulated to test a hypothesis • about a dependent variable. Allows • evaluation of causal relationships among variables • while all other variables are eliminated or controlled.
  • 18.
    EXPERIMENTAL RESEARCH Dependent Variable •Criterion by which the results of the experiment are judged. • Variable that is expected to be dependent on the manipulation of the independent variable Independent Variable • Any variable that can be manipulated, or altered, independently of any other variable • Hypothesized to be the causal influence
  • 19.
    Experimental Treatments • Alternativemanipulations of the independent variable being investigated Experimental Group • Group of subjects exposed to the experimental treatment Control Group • Group of subjects exposed to the control condition • Not exposed to the experimental treatment
  • 20.
    SYMBOLISM FOR DIAGRAMMING EXPERIMENTALDESIGNS  X = exposure of a group to an experimental treatment  O = observation or measurement of the dependent variable  If multiple observations or measurements are taken,  subscripts indicate temporal order – i.e., O1, O2, etc.  R = random assignment of test units;  individuals selected as subjects for the experiment  are randomly assigned to the experimental groups
  • 21.
    PRE-EXPERIMENTAL DESIGNS Do notadequately control for the problems associated with loss of external or internal validity Cannot be classified as true experiments Often used in exploratory research Three Examples of Pre-Experimental Designs • One-Shot Design • One-Group Pretest-Posttest Design • Static Group Design
  • 22.
    ONE-SHOT DESIGN  After-onlydesign  A single measure is recorded after the treatment is administered  Study lacks any comparison or control of extraneous influences  No measure of test units not exposed to the experimental treatment  May be the only viable choice in taste tests  Diagrammed as: X O1
  • 23.
    ONE-GROUP PRETEST-POSTTEST DESIGN Subjects inthe experimental group are measured before and after the treatment is administered. No control group Offers comparison of the same individuals before and after the treatment (e.g., training) If time between 1st & 2nd measurements is extended, may suffer maturation Can also suffer from history, mortality, and testing effects Diagrammed as O1 X O2
  • 24.
    STATIC GROUP DESIGN After-only design with control group  Experimental group is measured after being exposed to the experimental treatment  Control group is measured without having been exposed to the experimental treatment  No pre-measure is taken  Major weakness is lack of assurance that the groups were equal on variables of interest prior to the treatment  Diagrammed as: Experimental Group X O1 Control Group O2
  • 25.
    PRETEST-POSTTEST CONTROL GROUP DESIGN Diagrammedas Experimental Group: R O1 X O2 • Control Group: R O3 O4 Effect of the experimental treatment equals (O2 – O1) -- (O4 – O3)
  • 26.
    POSTTEST-ONLY CONTROL GROUP DESIGN After-Only with Control  True experimental design  Experimental group tested after treatment exposure  Control group tested at same time without exposure to experimental treatment  Includes random assignment to groups  Effect of all extraneous variables assumed to be the same on both groups  Do not run the risk of a testing effect  Use in situations when cannot pretest
  • 27.
    Diagrammed as • ExperimentalGroup: X O1 • Control Group: O2 Effect of the experimental treatment equals (O2 – O1)
  • 28.
    SOLOMON FOUR-GROUP DESIGN True experimental design  Combines pretest-posttest with control group design and the posttest-only with control group design  Provides means for controlling the interactive testing effect and other sources of extraneous variation  Does include random assignment
  • 29.
    Diagrammed as • ExperimentalGroup 1: R O1 X O2 • Control Group 1: R O3 O4 • Experimental Group 2: R X O5 • Control Group 2: R O6 Effect of independent variable (O2 – O4) & (O5 – O6) Effect of pretesting (O4 – O6) Effect of pretesting & measuring (O2 – O5) Effect of random assignment (O1 – O3)
  • 30.
    THREATS TO EXPERIMENTAL DESIGN Constanterror is error that occurs in the same experimental condition every time the basic experiment is repeated – a systematic bias Example: • Experimental groups always administered the treatment in the morning • Control groups always in the afternoon • Introduces an uncontrolled extraneous variable – time of day • Hence, systematic or constant error
  • 31.
    SOURCES OF CONSTANTERROR Demand Characteristics • Experimental design procedures or situational aspects of the experiment that provide unintentional hints to subjects about the experimenter’s hypothesis • If occurs, participants likely to act in a manner consistent with the experimental treatment. • Most prominent demand characteristic is the person actually administering the experimental treatments. Experimenter Bias • Effect on the subjects’ behavior caused by an experimenter’s presence, actions, or comments. Guinea Pig Effect • Effect on experimental results caused by subjects changing normal behavior or attitudes to cooperate with experimenter.
  • 32.
    FACTORS AFFECTING INTERNAL VALIDITY HistoryEffect • Specific events in the external environment between the 1st & 2nd measurements that are beyond the experimenter’s control • Common history effect occurs when competitors change their marketing strategies during a test marketing experiment Cohort Effect • Change in the dependent variable that occurs because members of one experimental group experienced different historical situations than members of other experimental groups
  • 33.
    Maturation Effect • Effecton experimental results caused by experimental subjects maturing or changing over time • During a daylong experiment, subjects may grow hungry, tired, or bored Testing Effect • In before-and-after studies, pretesting may sensitize subjects when taking a test for the 2nd time. • May cause subjects to act differently than they would have if no pretest measures were taken
  • 34.
    Instrumentation Effect • Causedby a change in the wording of questions, in interviewers, or in other procedures used to measure the dependent variable. Selection Effect • Sampling bias that results from differential selection of respondents for the comparison groups. Mortality or Sample Attrition • Results from the withdrawal of some subjects from the experiment before it is completed • Effects randomization • Especially troublesome if some withdraw from one treatment group and not from the others (or at least at different rates)
  • 35.
    CONTROLLING EXTRANEOUS VARIABLES Blinding • Techniqueused to control subjects’ knowledge of whether or not they have been given the experimental treatment. • Taste tests, placebos (chemically inert pills), etc. Constancy of Conditions • Subjects in experimental & control groups are exposed to identical situations except for differing conditions of the independent variable.
  • 36.
    Order of Presentation •If experimental method requires that the same subjects be exposed to 2 or more experimental treatments, error may occur due to order in which the treatments are presented • Counterbalancing • ½ the subjects exposed to Treatment A first, then to Treatment B. • Other ½ exposed to Treatment B first, then to Treatment A. • Eliminates the effects of order of presentation
  • 37.