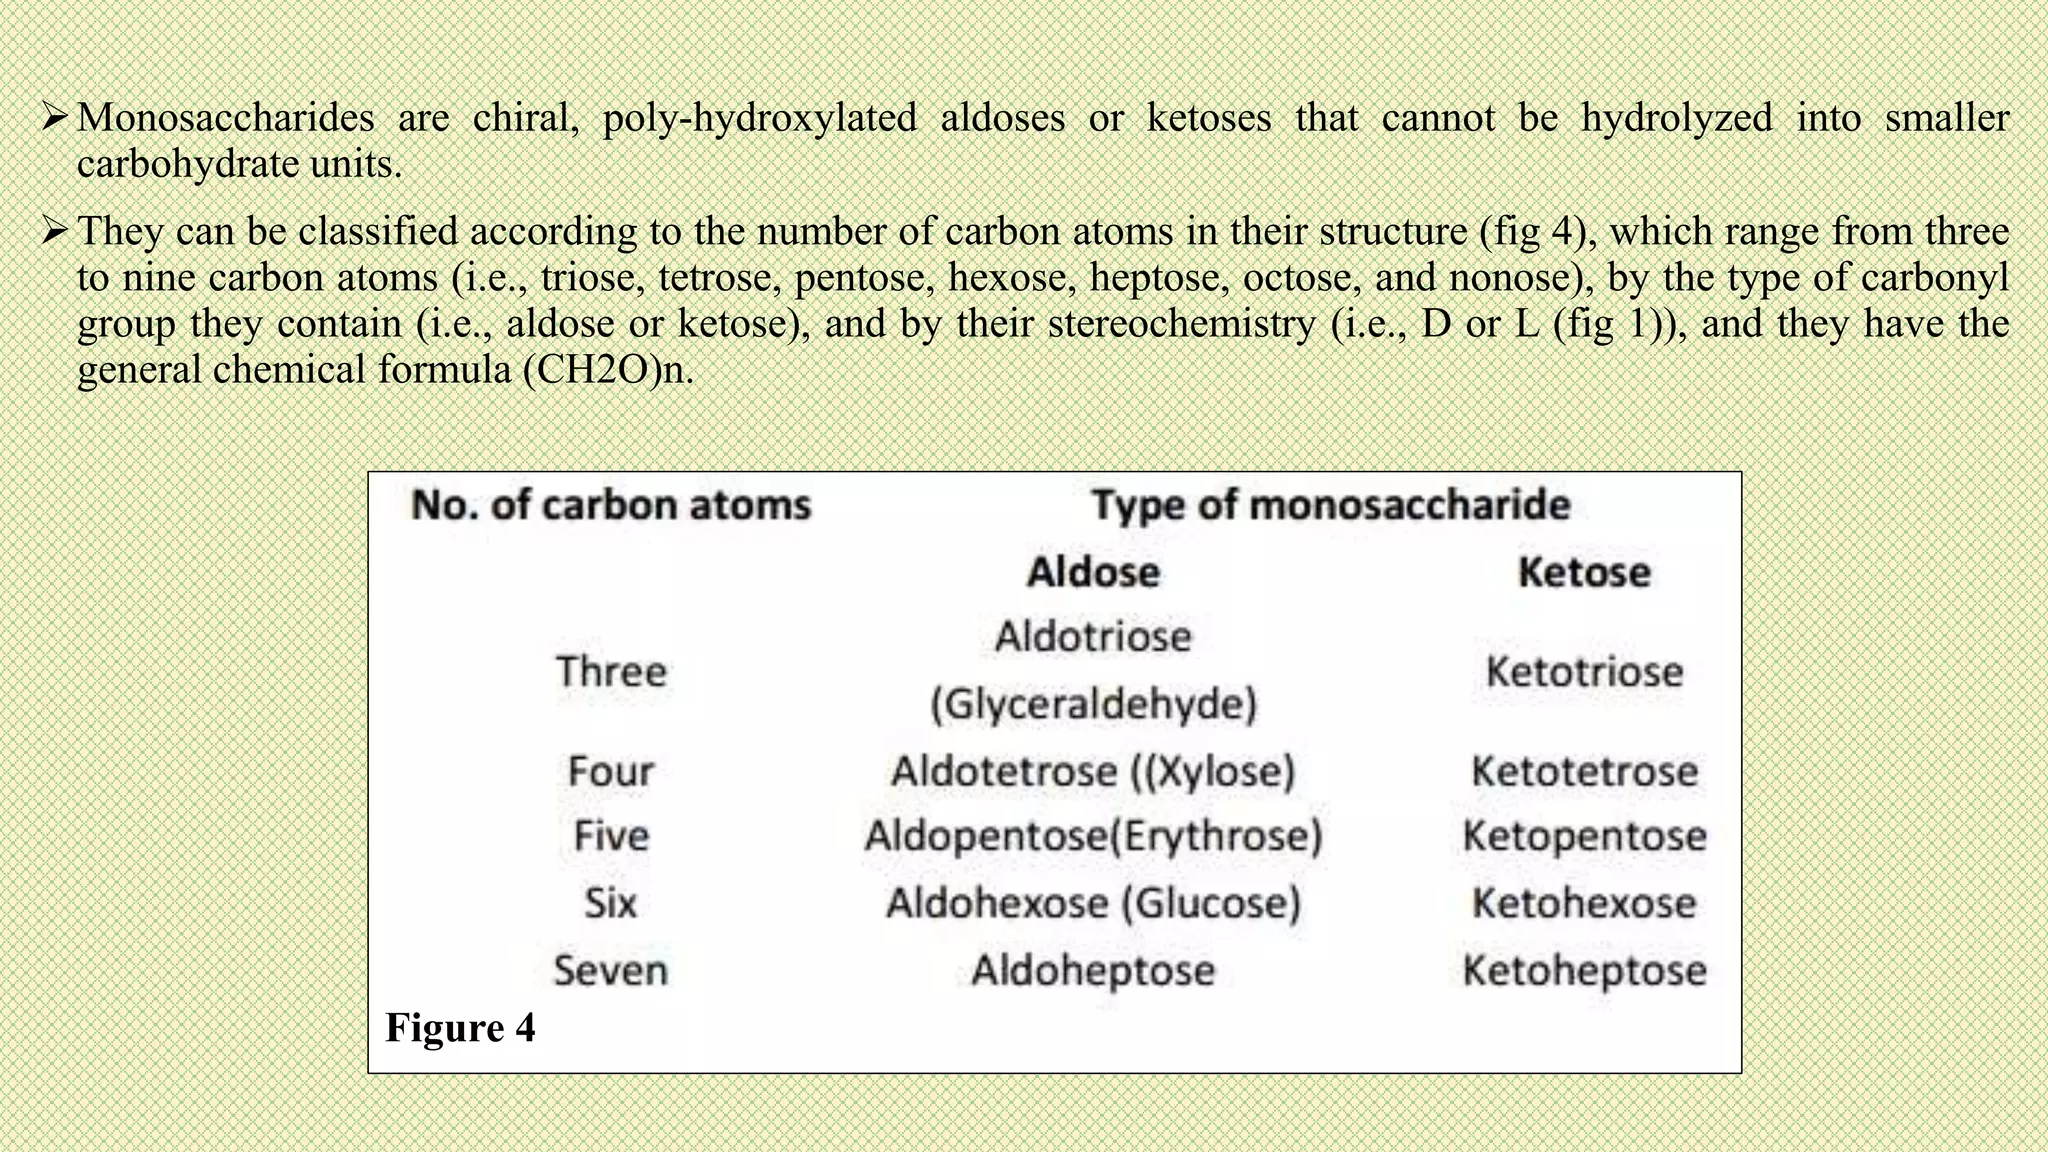
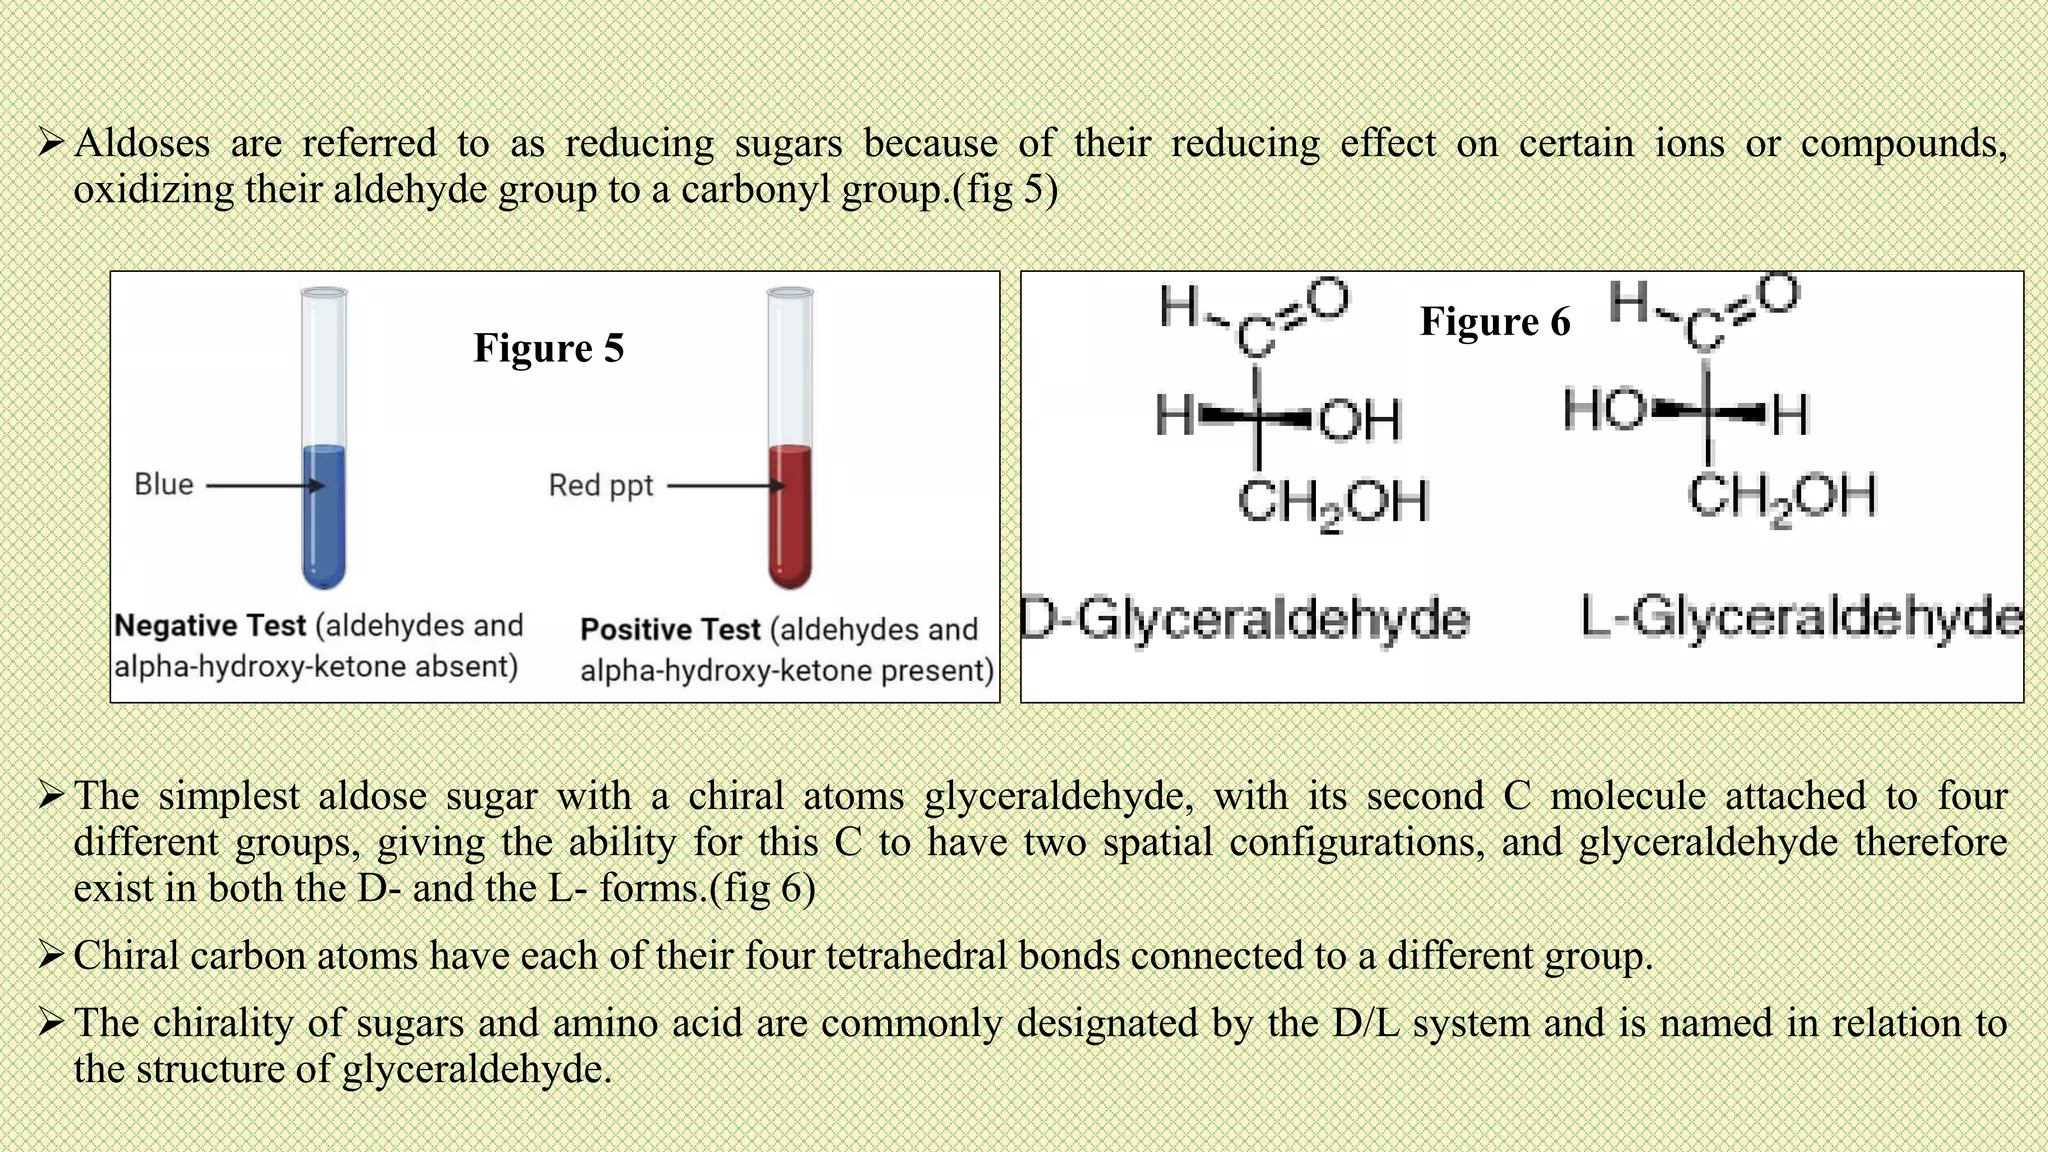
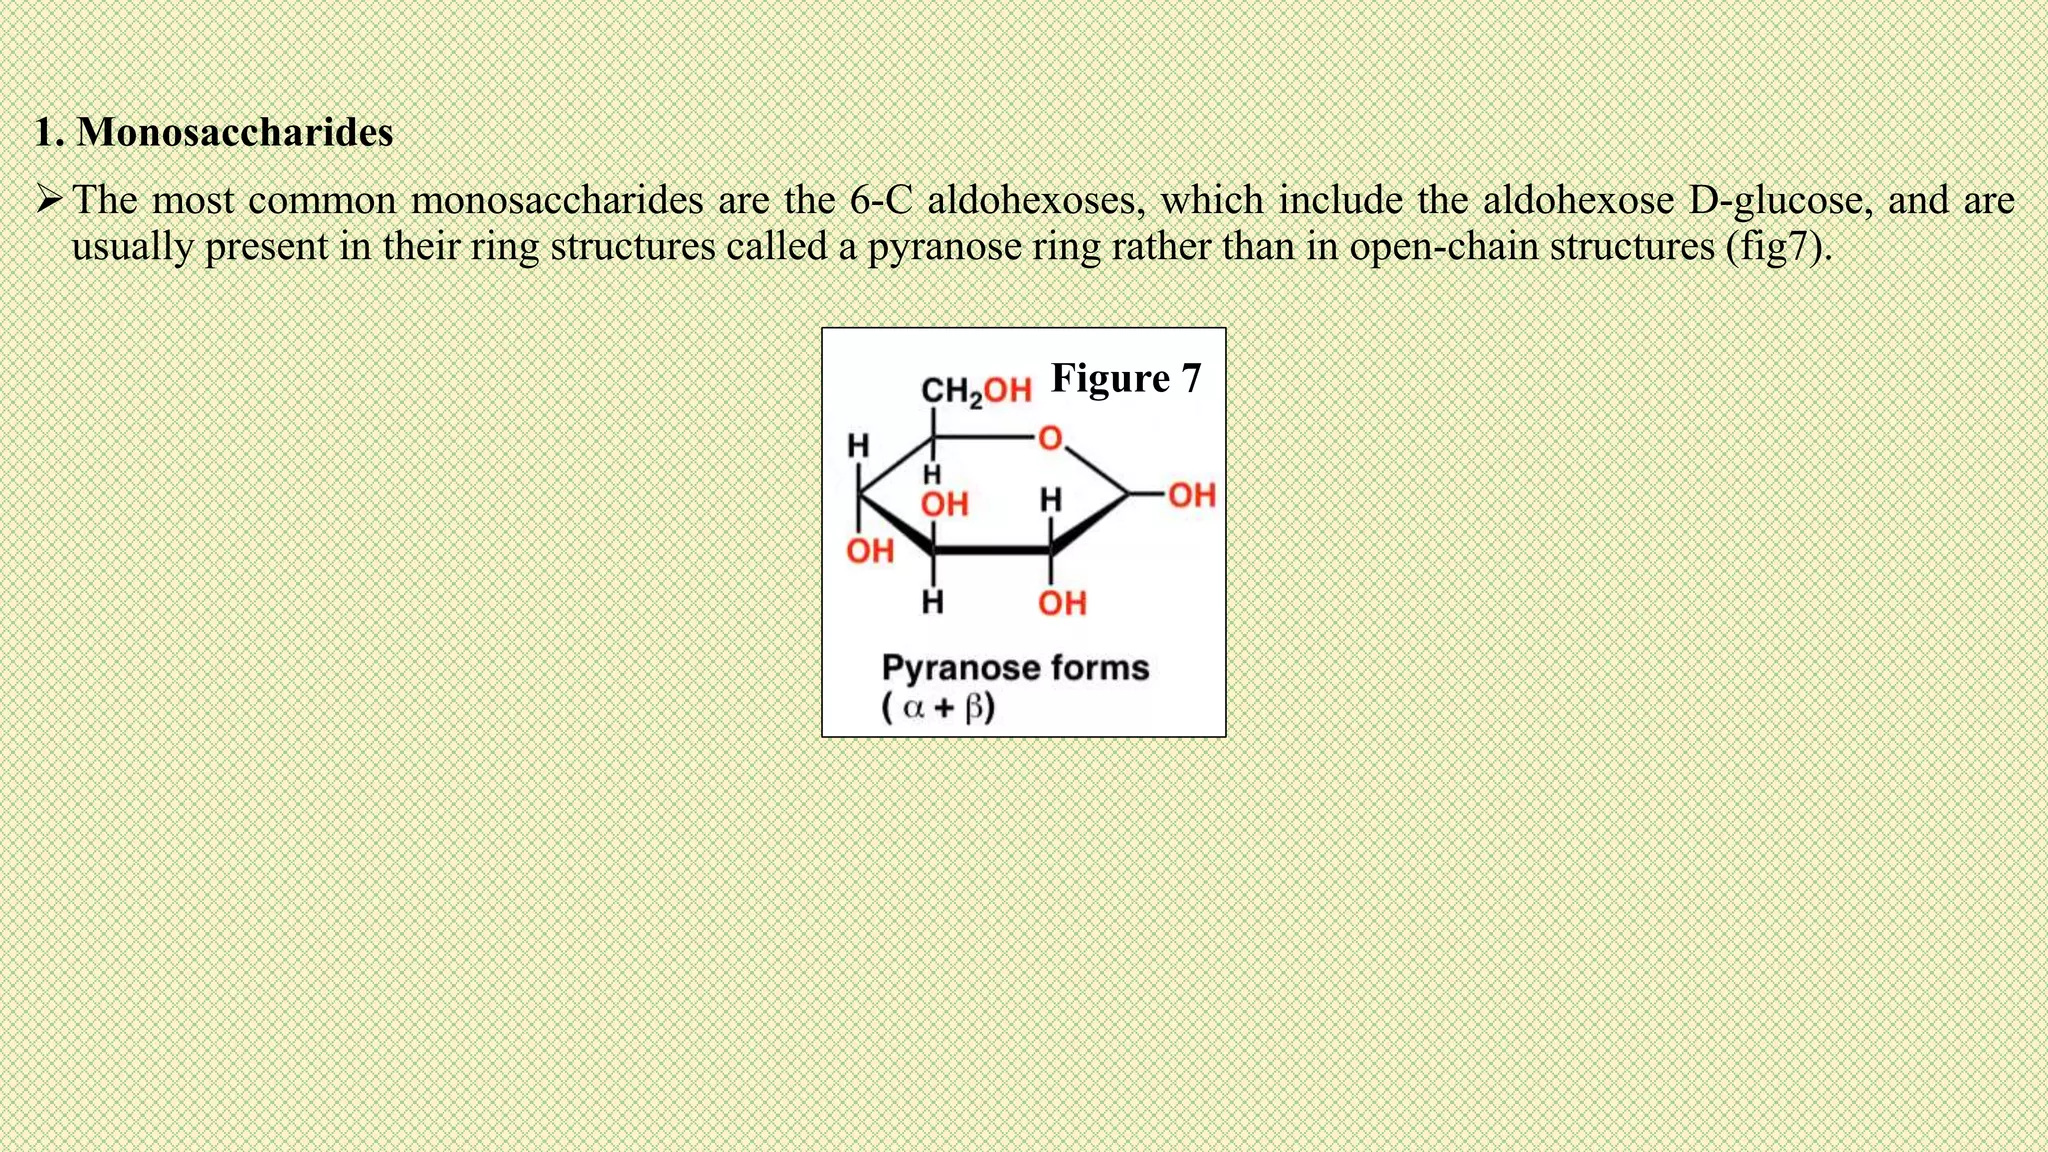
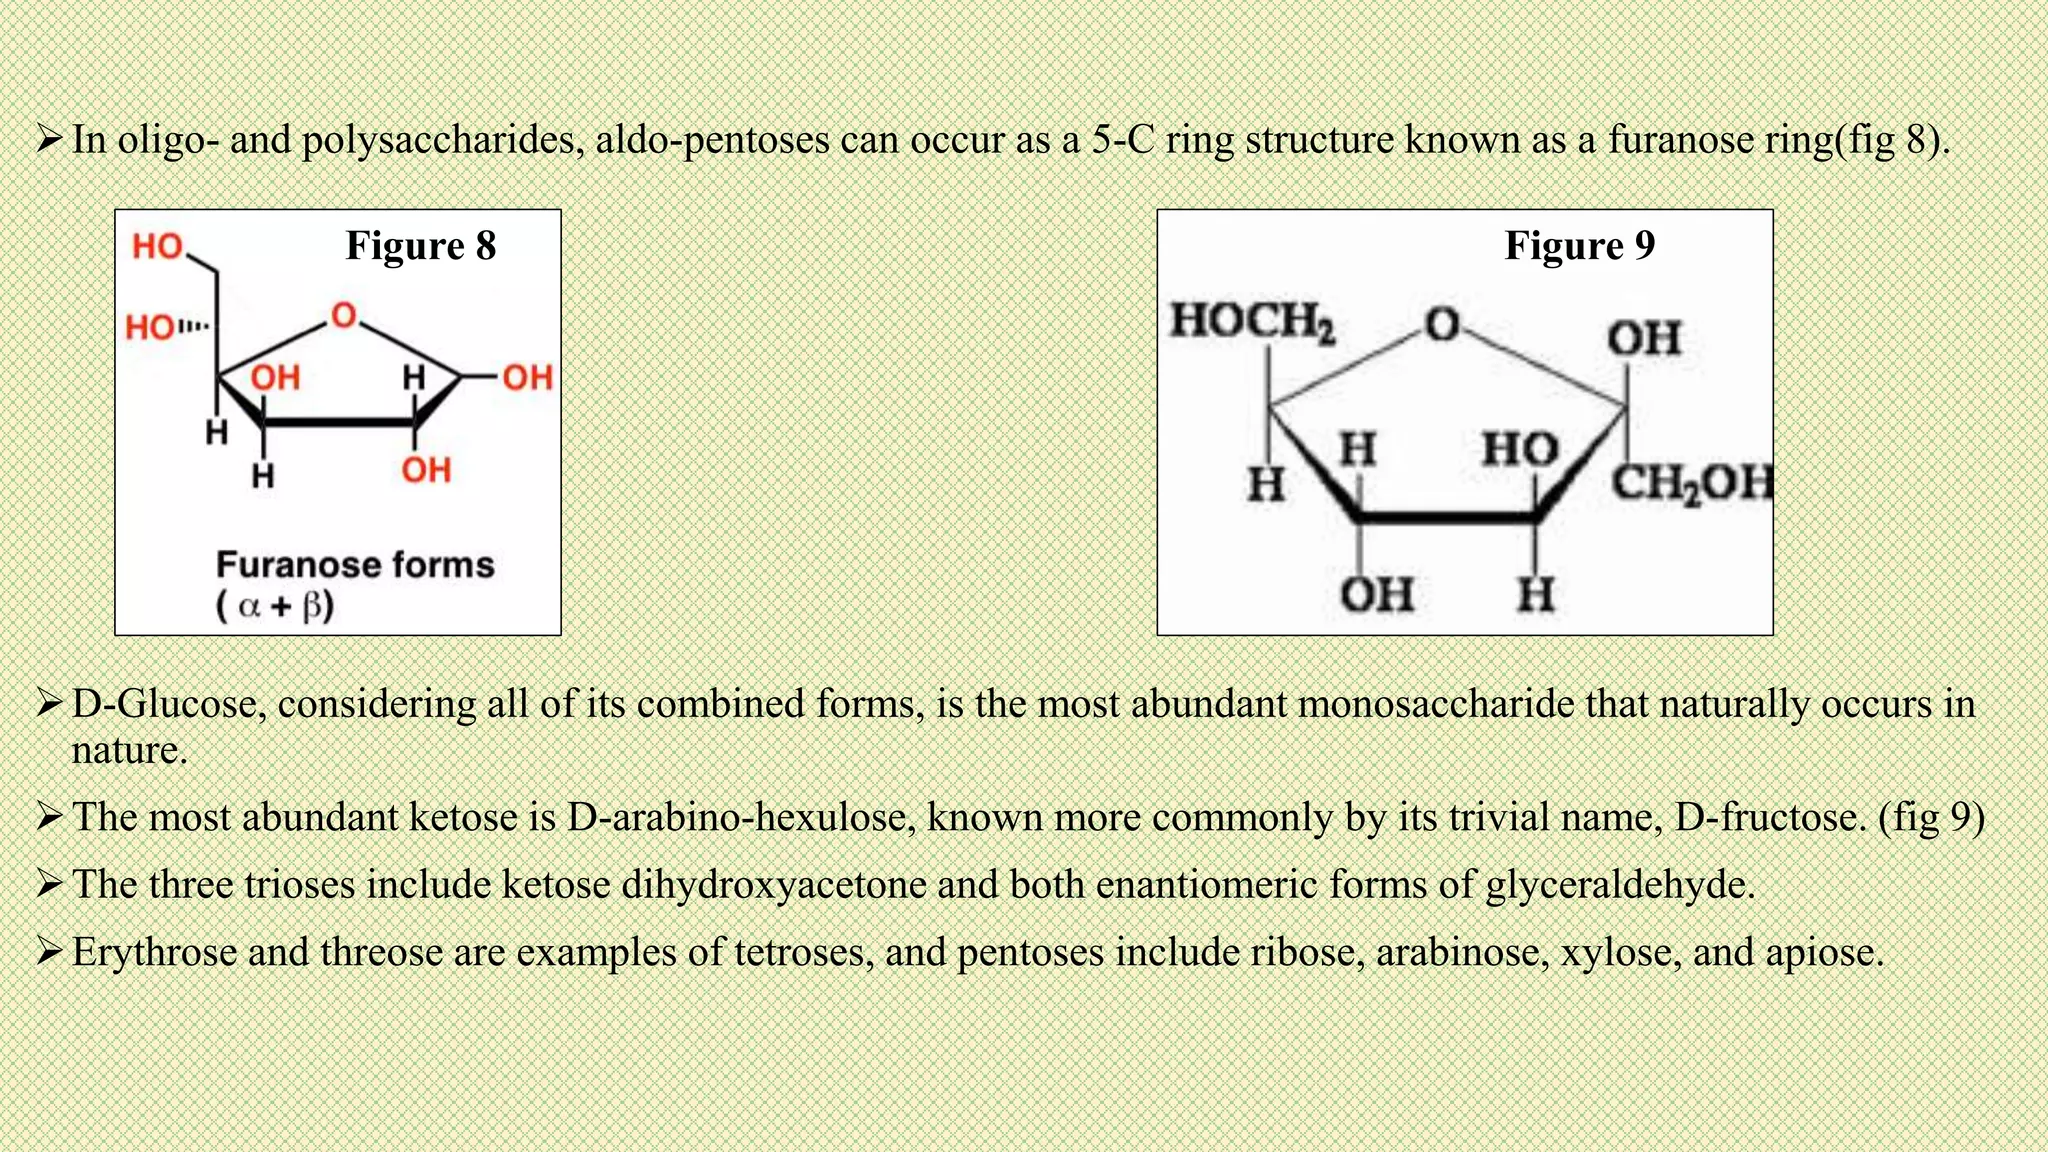
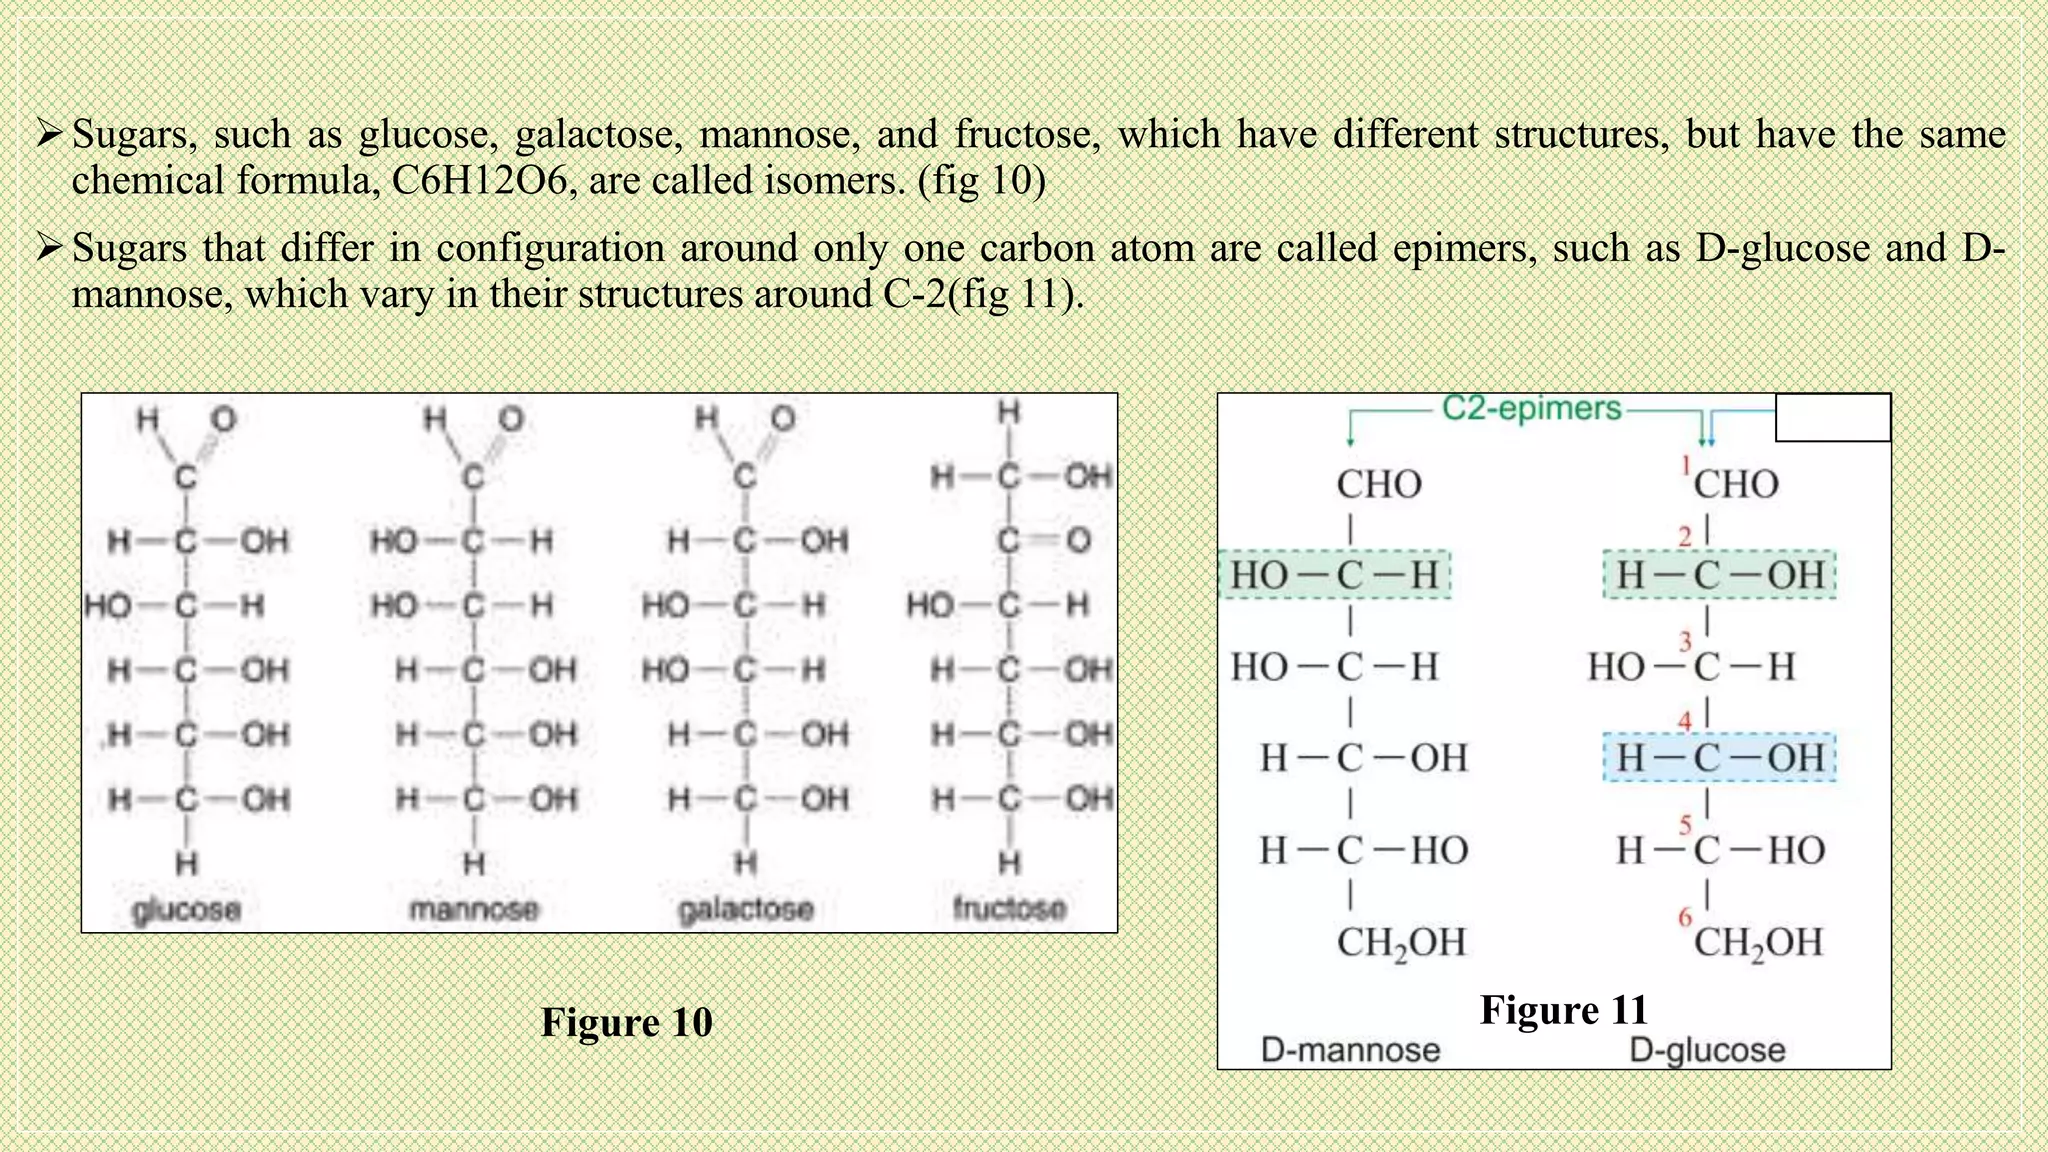
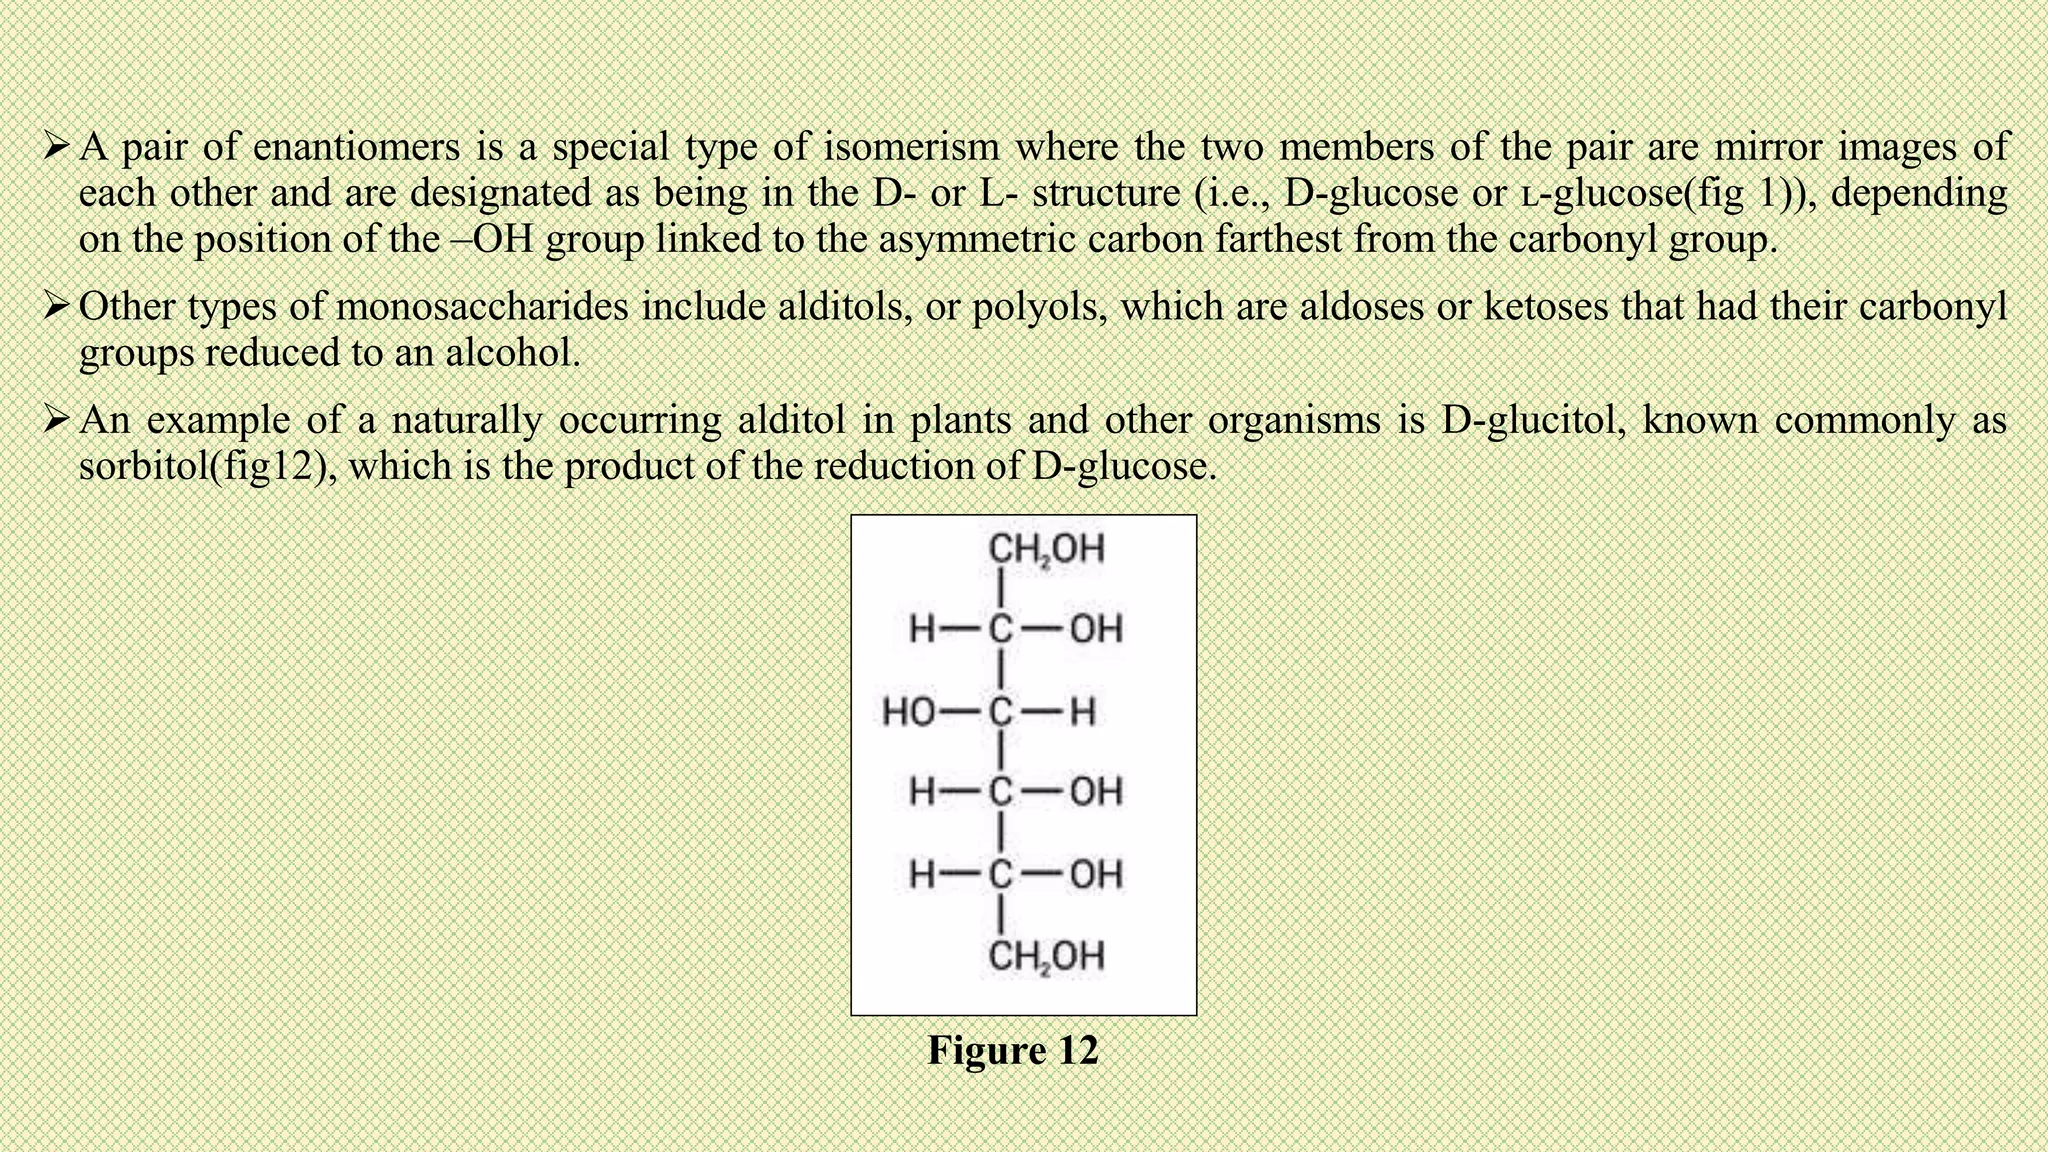
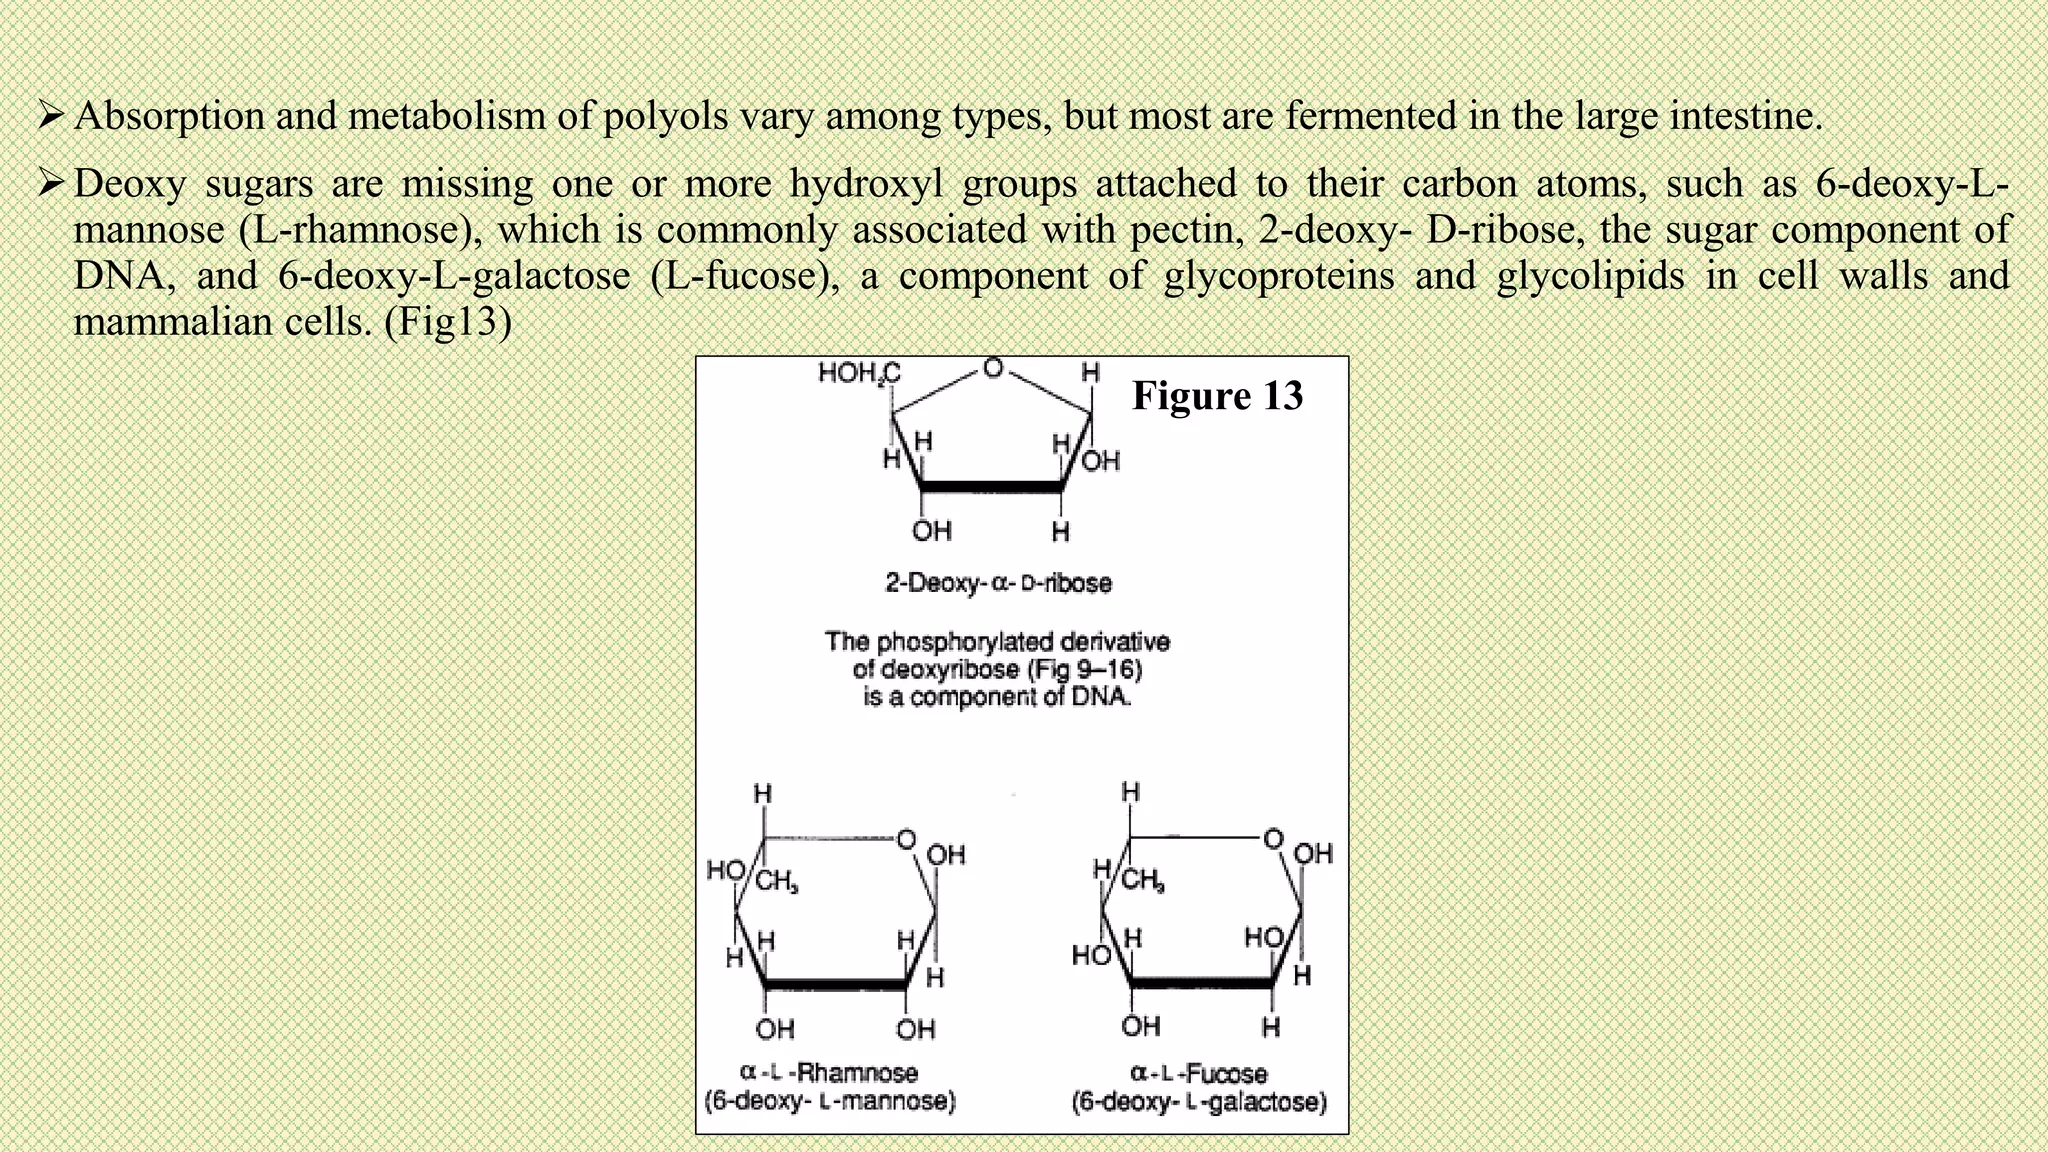
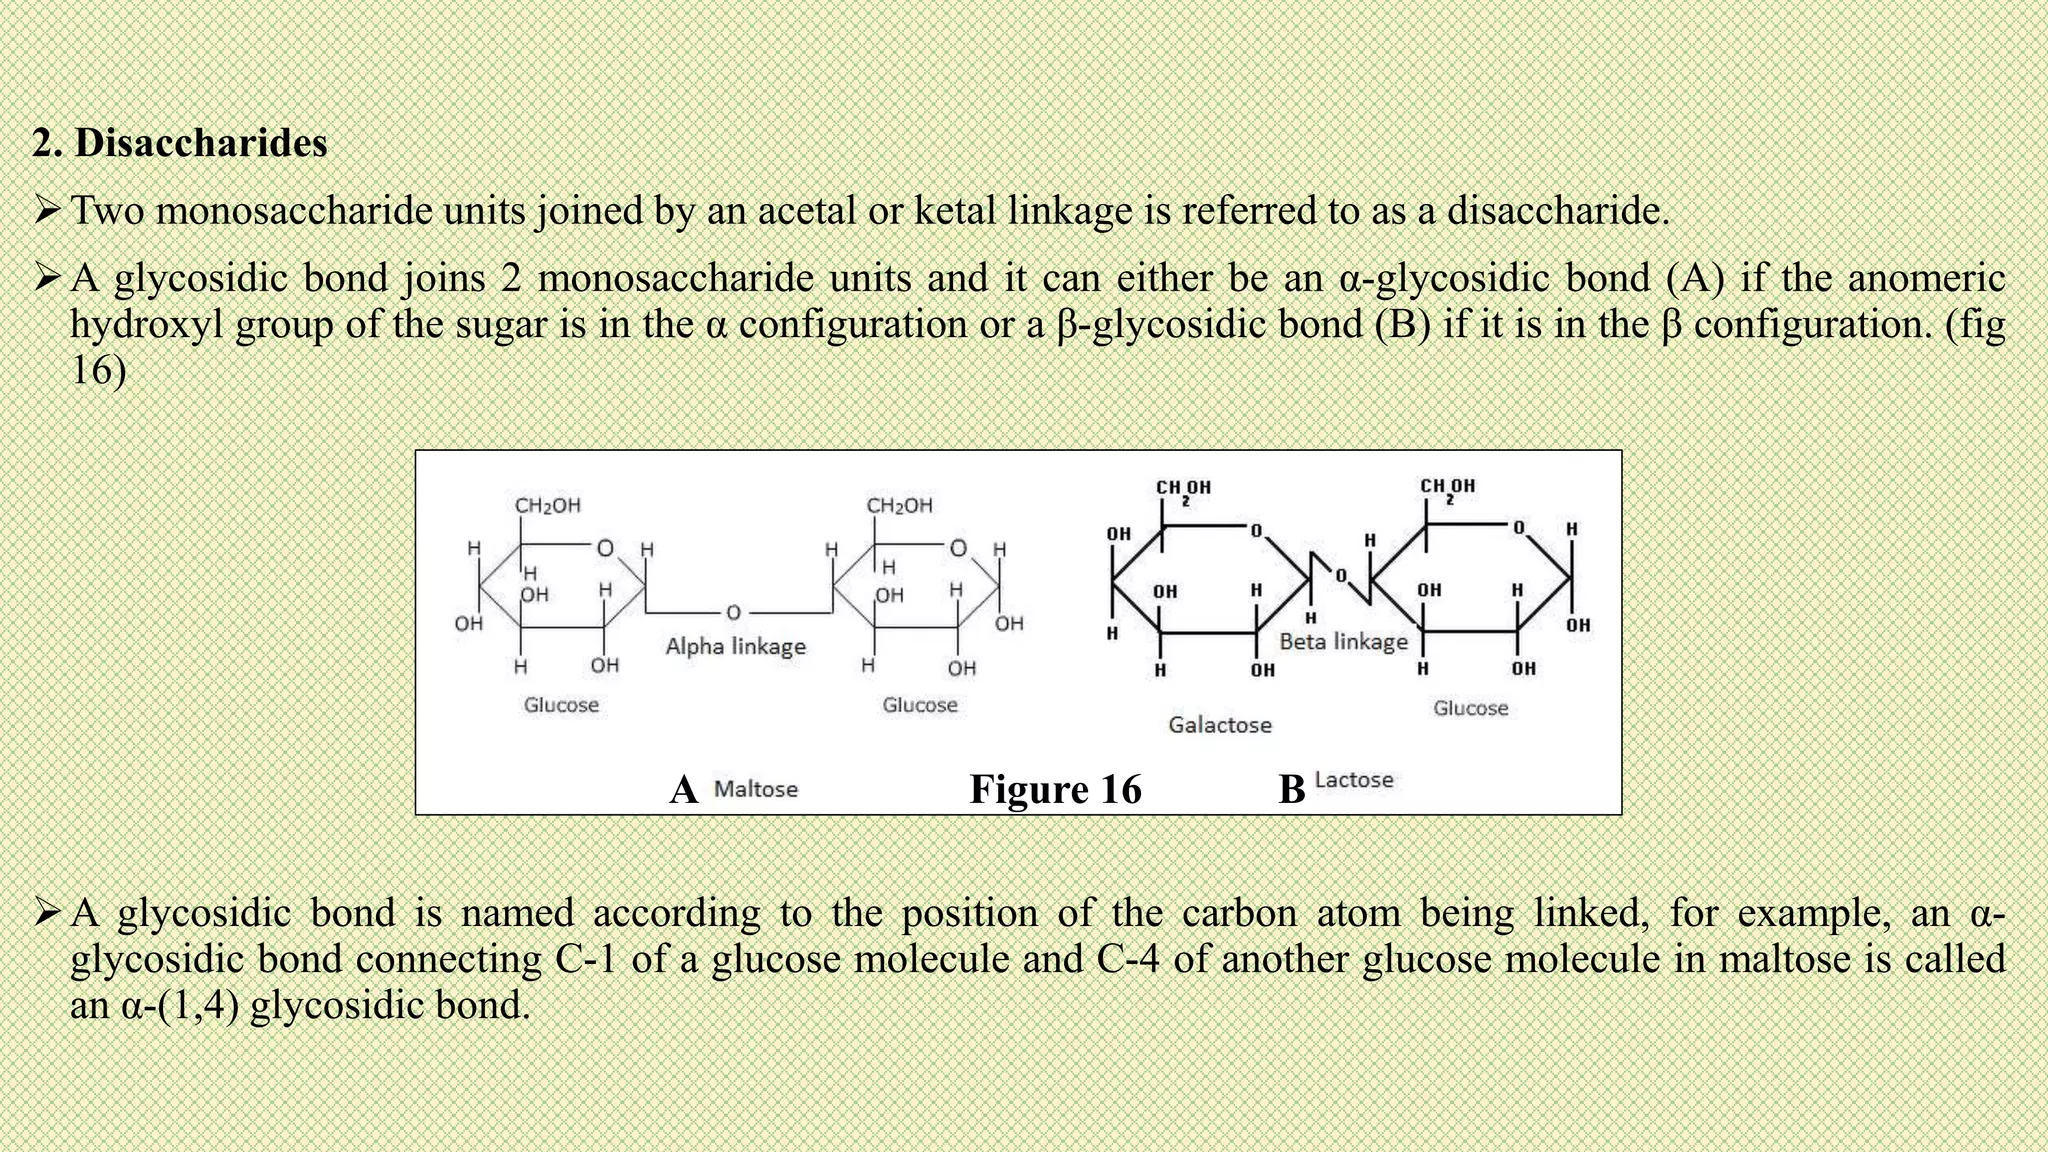
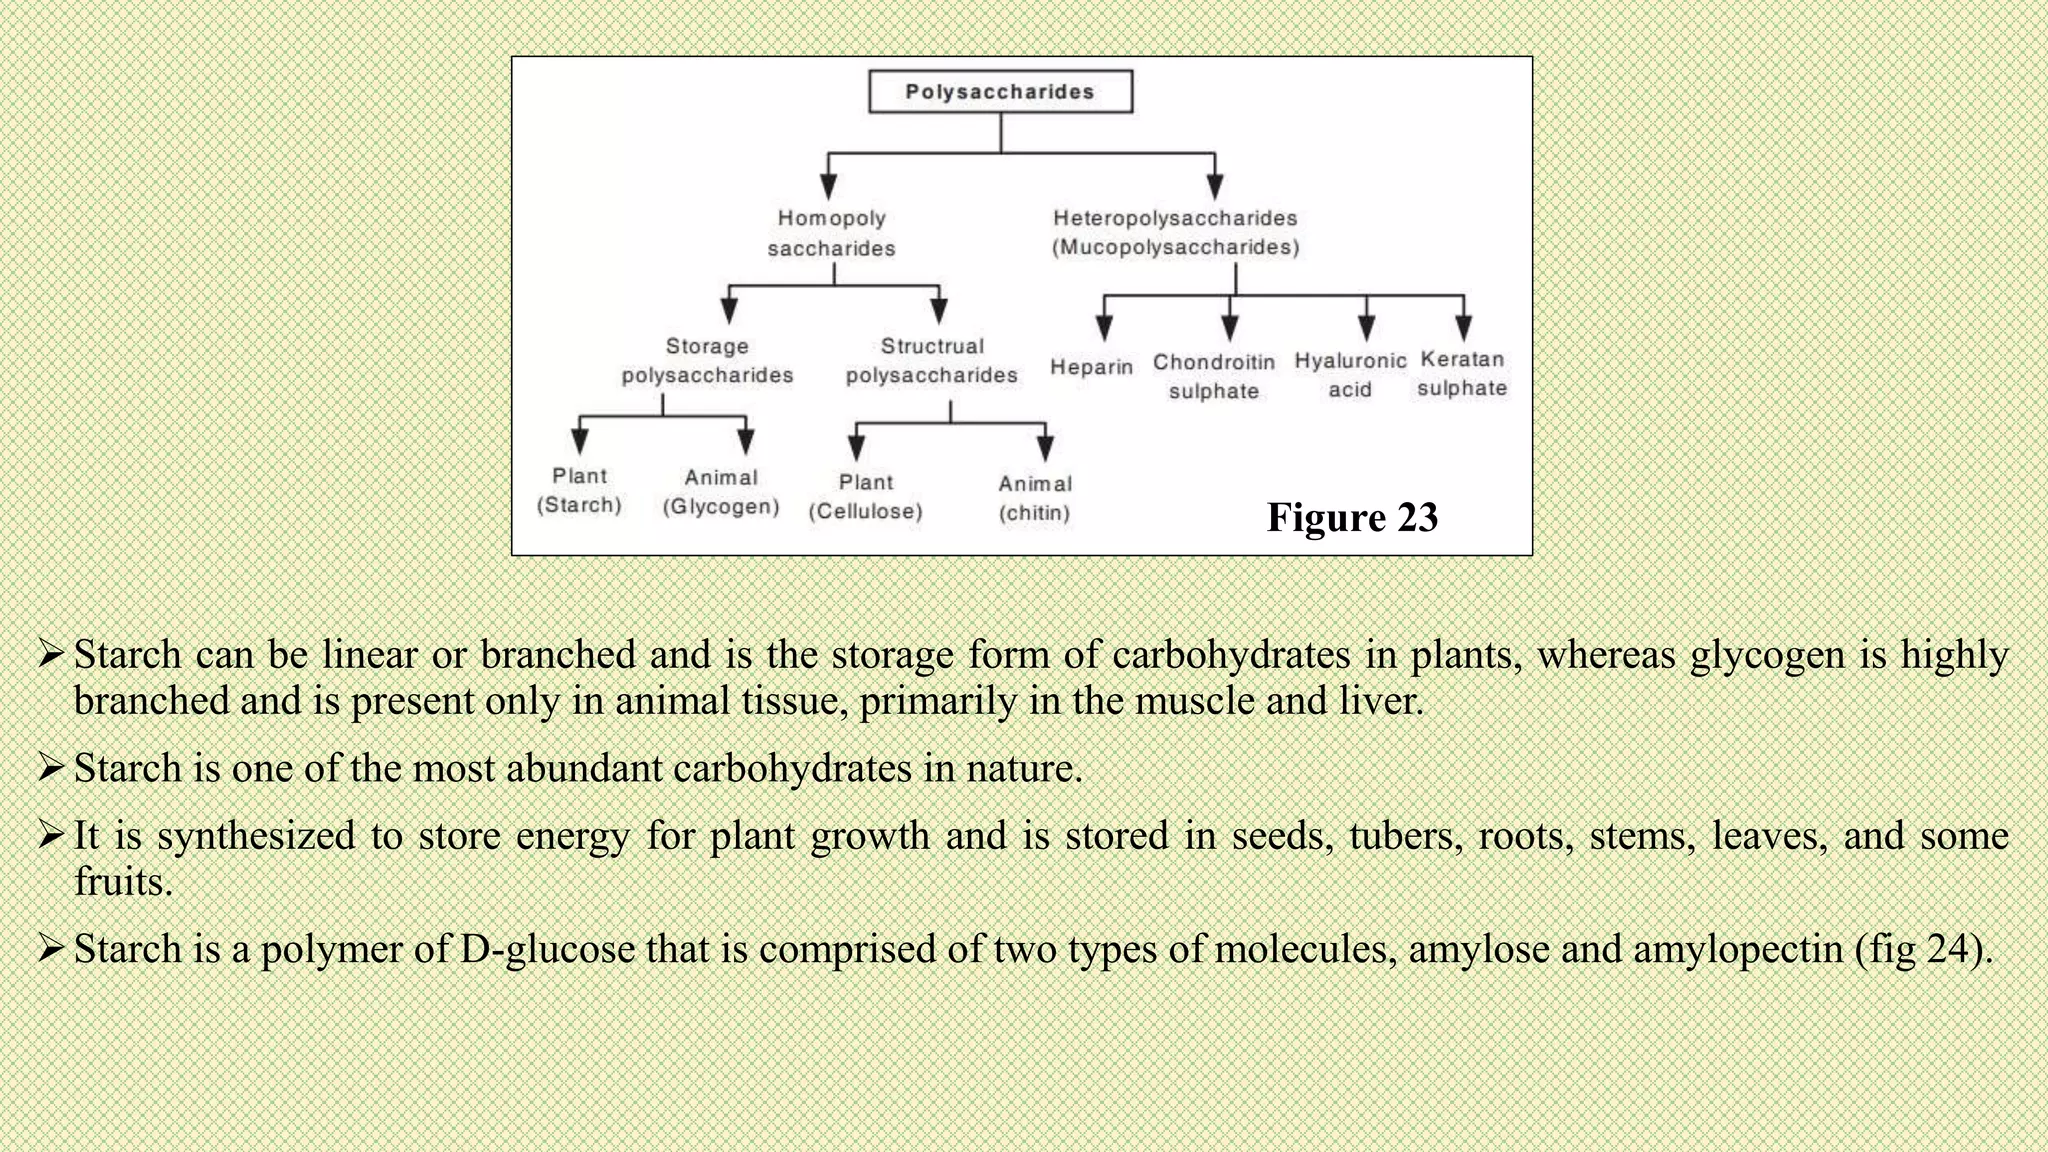
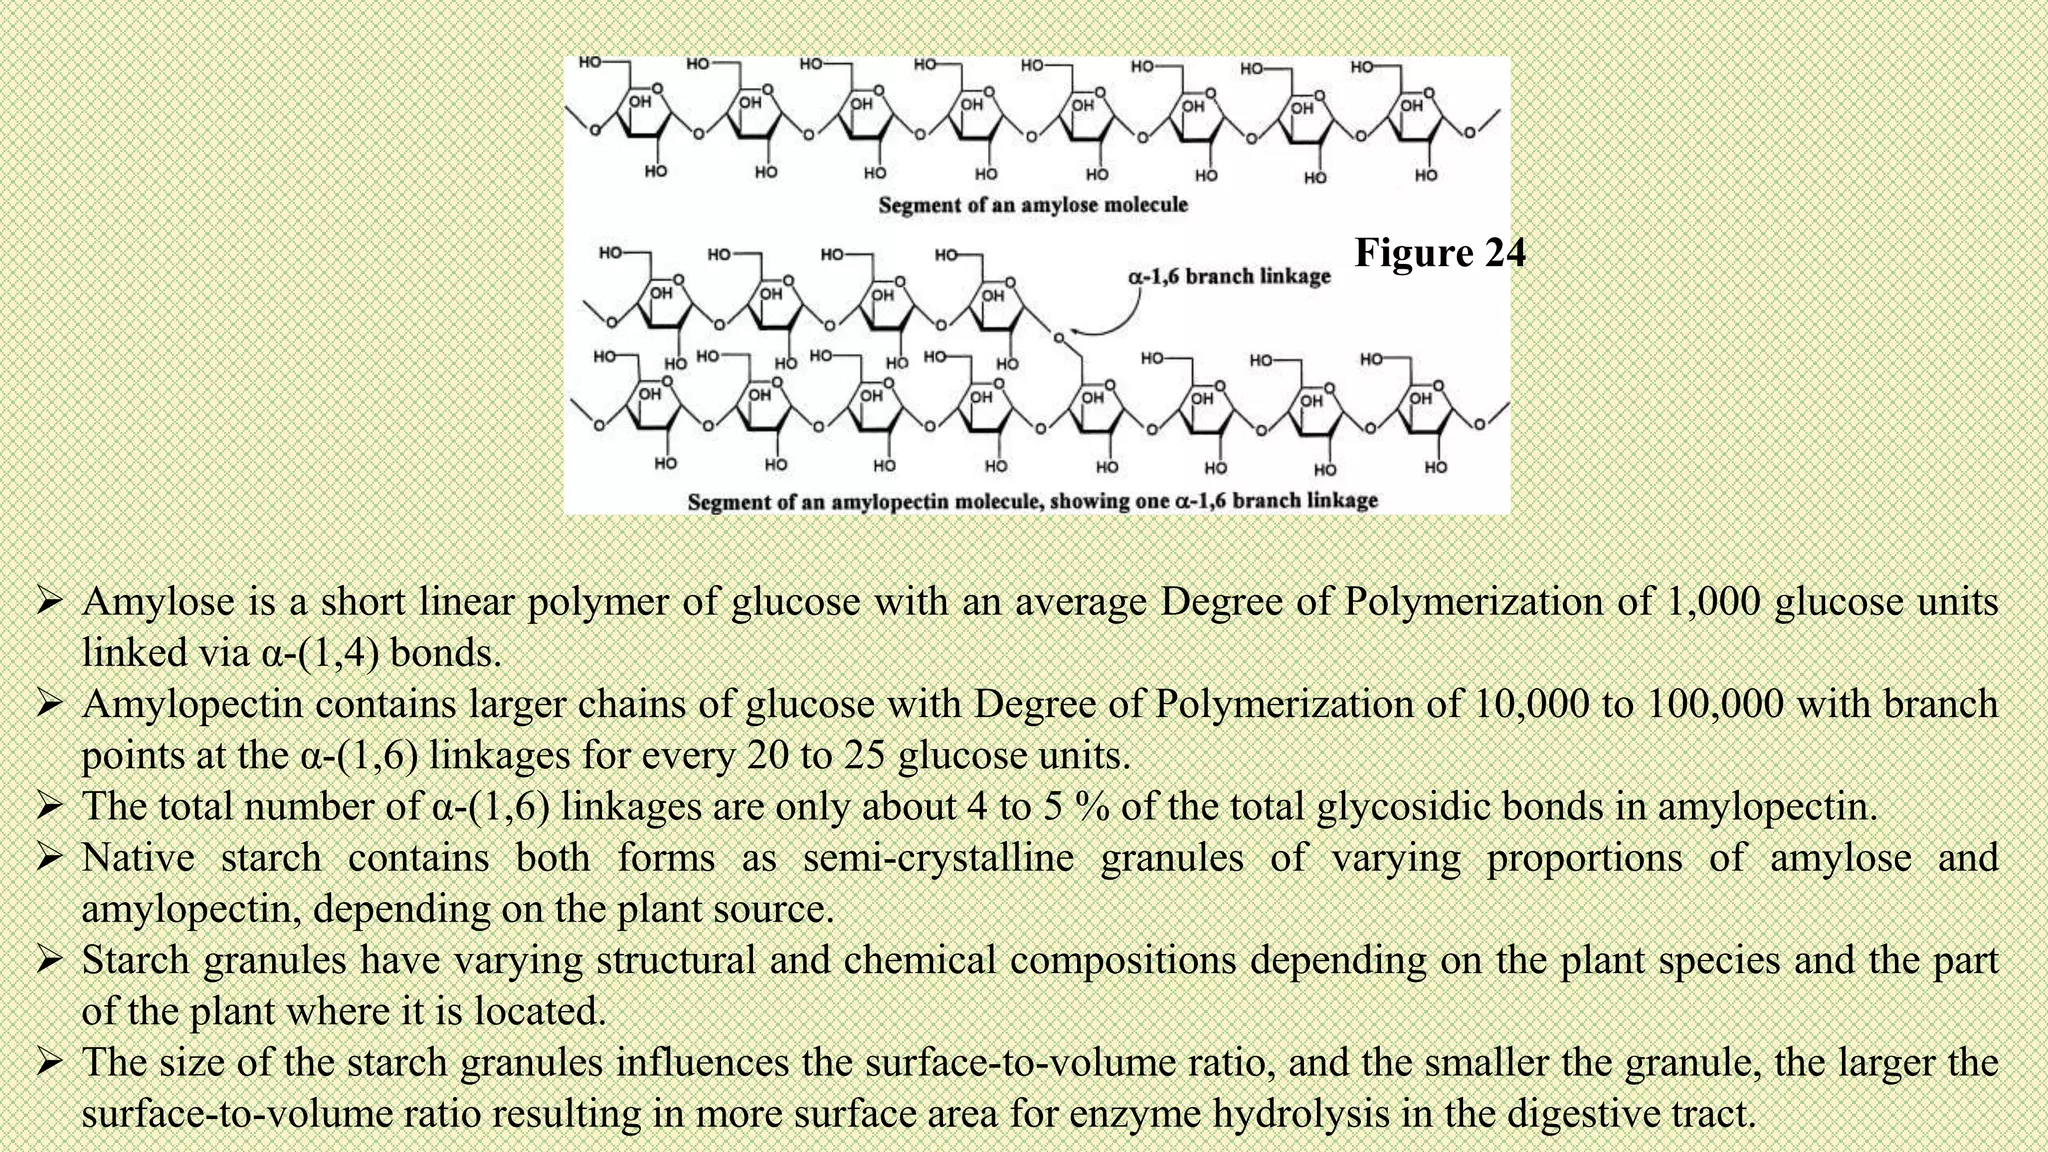
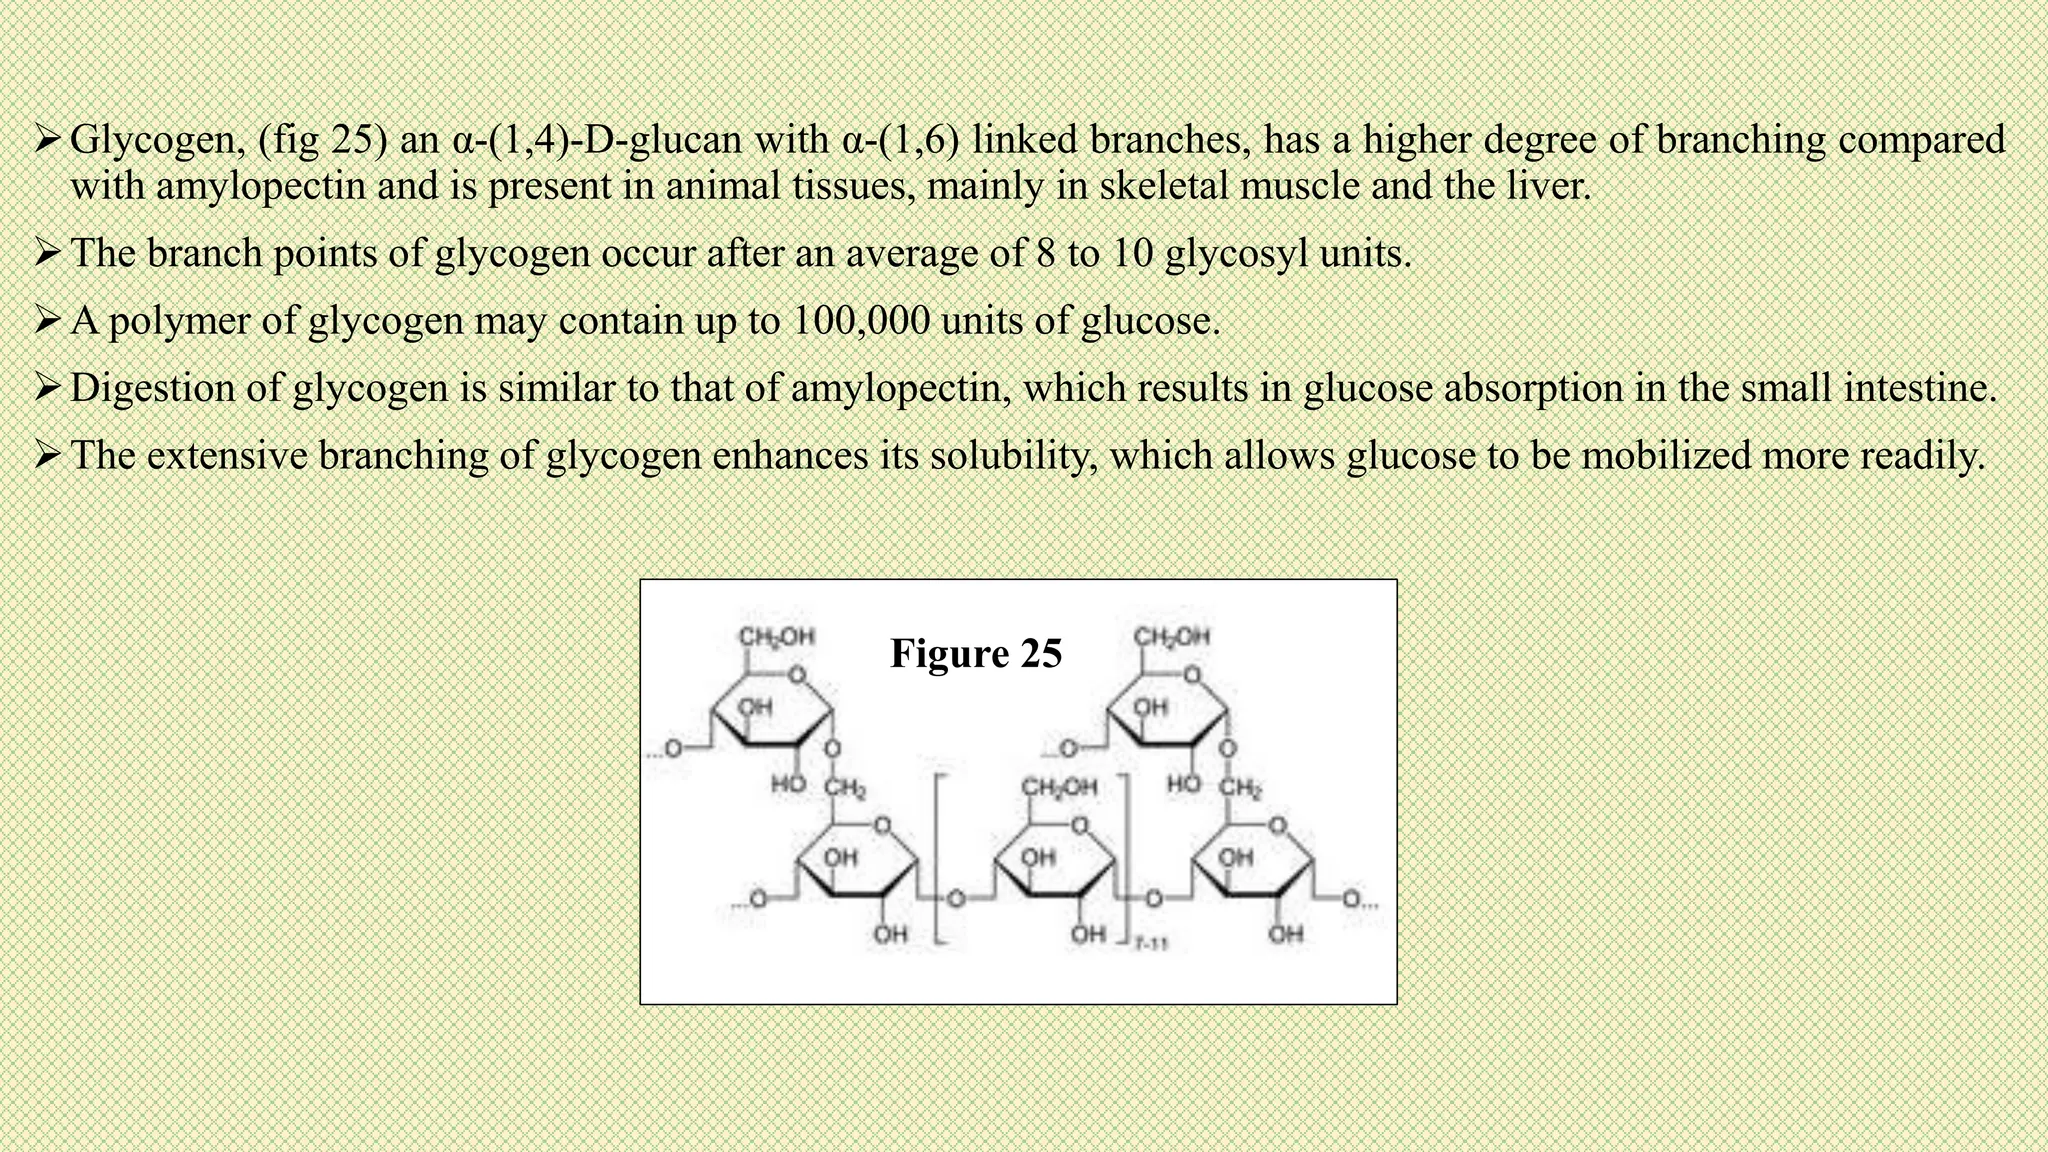
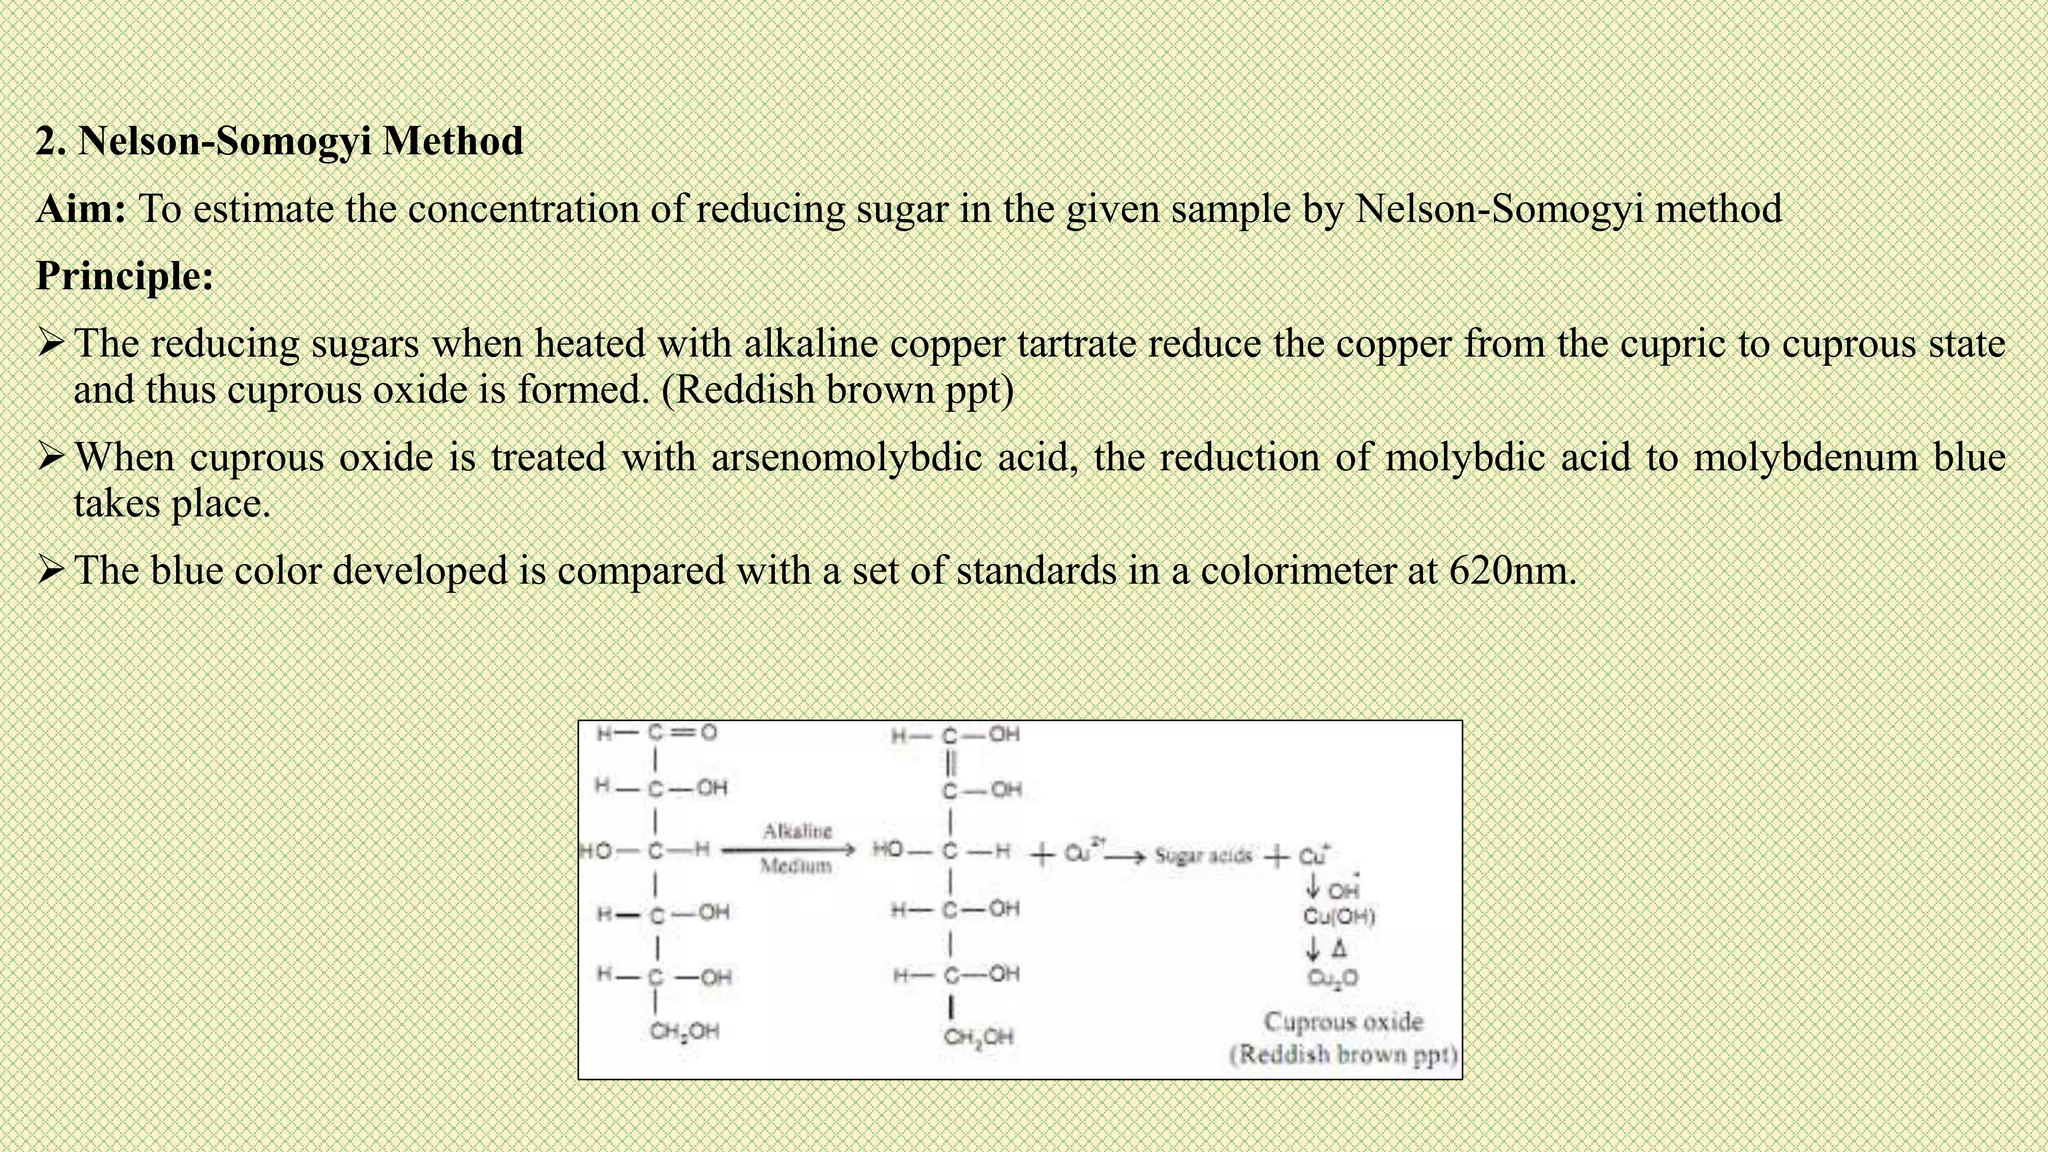
The document discusses carbohydrates, their classification into monosaccharides, disaccharides, oligosaccharides, and polysaccharides, and their importance as energy sources for living organisms. It describes various methods for quantitative analysis of carbohydrates and details the digestive processes involving these compounds in animals, including the roles of dietary fiber. Additionally, it highlights the significance of carbohydrate estimation in medical, agricultural, and food industry applications.


![Arsenomolybdate reagent:
(a)Dissolve 2.5 g ammonium molybdate in 45 mL water. Add 2.5 mL sulphuric acid and mix well. Then add 0.3
g disodium hydrogen arsenate dissolved in 25 mL water. Mix well and incubate at 37°C for 24–48 hours.
Standard glucose solution: Stock: 100 mg in 100 mL distilled water.
Working standard: 10 mL of stock diluted to 100 mL with distilled water [100 µg/mL].
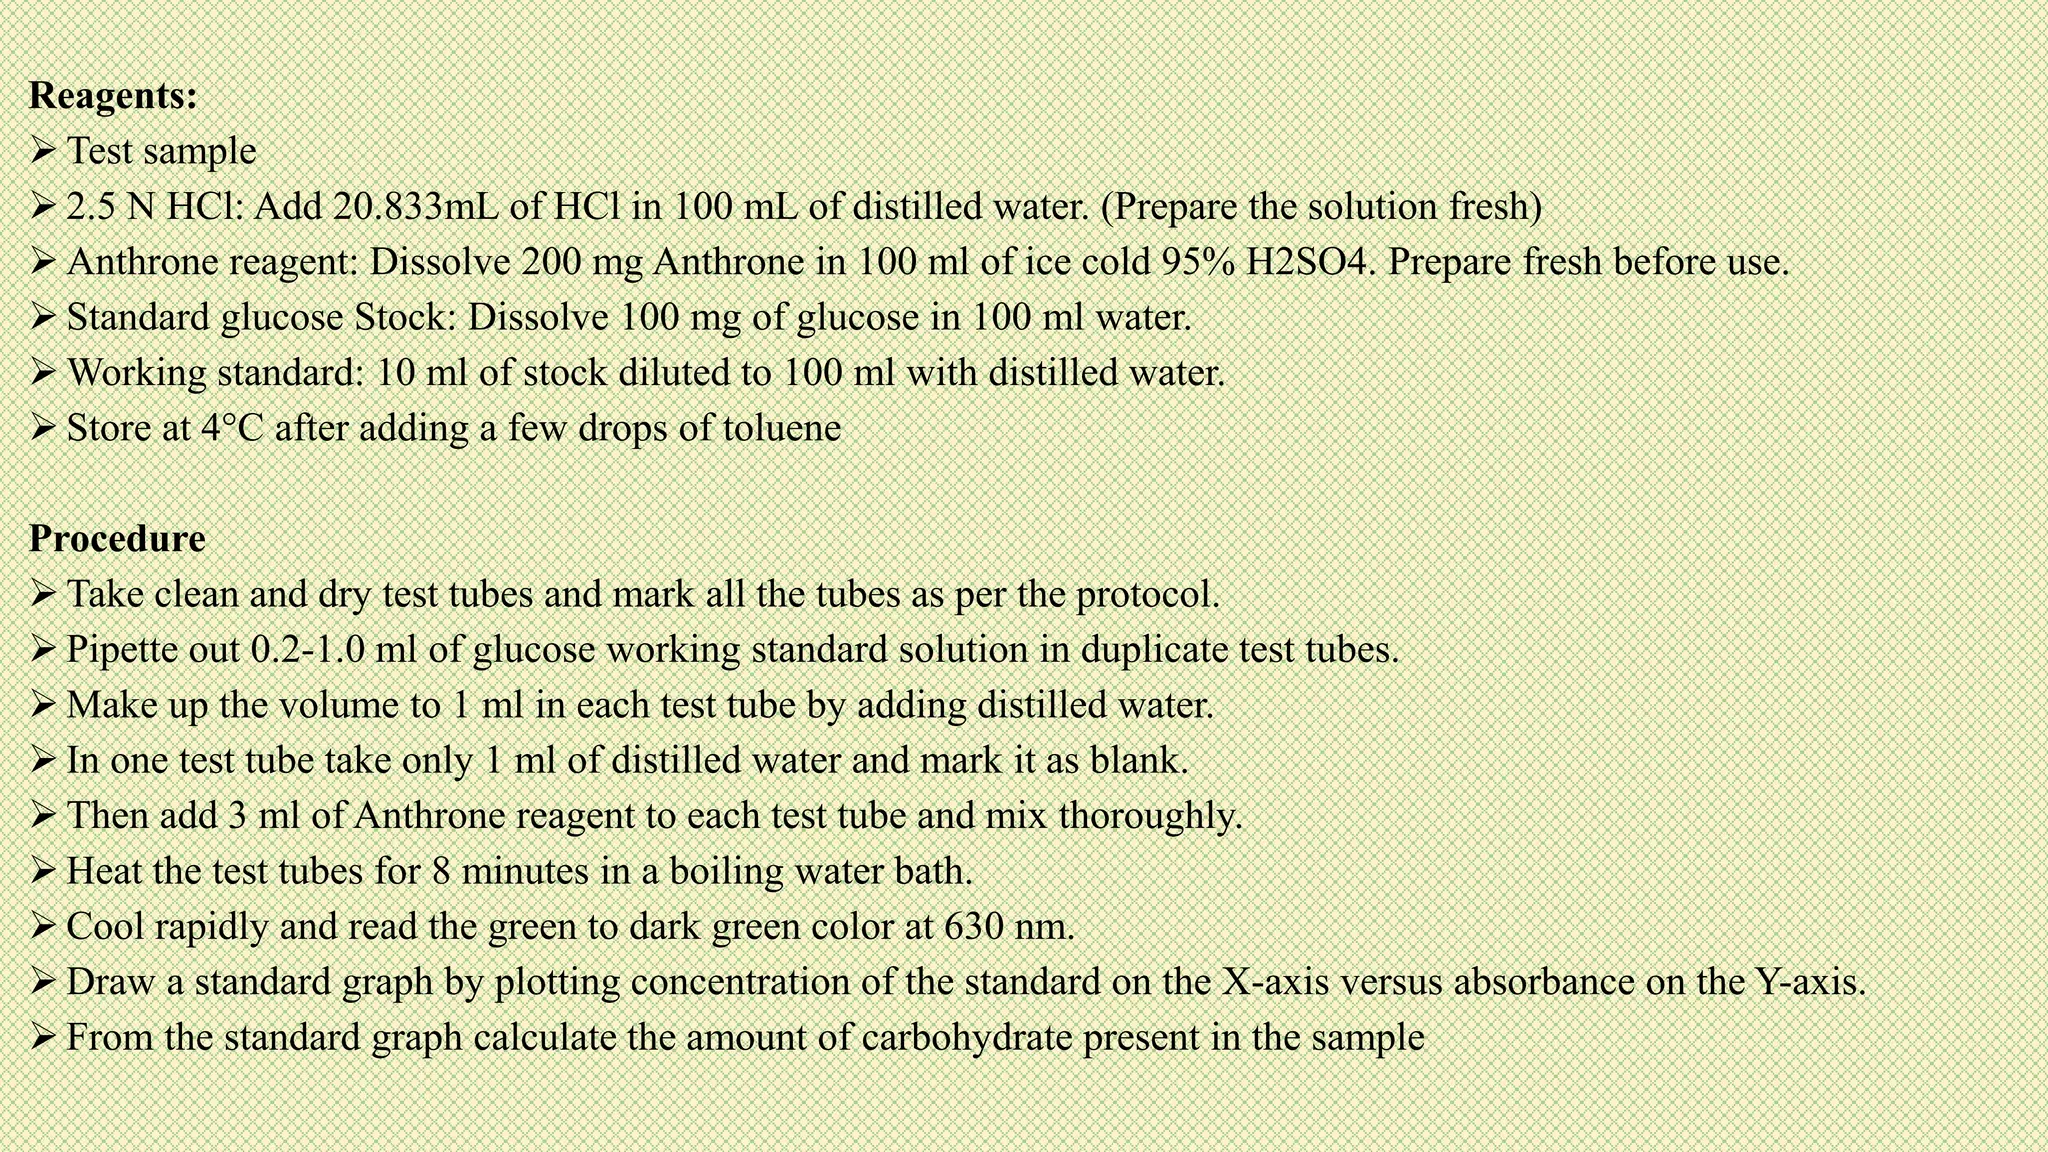
Procedure:
Take clean and dry test tubes and mark all the tubes as per the protocol.
Pipette out 0.2-1.0 ml of glucose working standard solution in duplicate test tubes.
Make up the volume to 1 ml in each test tube by adding distilled water.
In one test tube take only 1 ml of distilled water and mark it as blank.
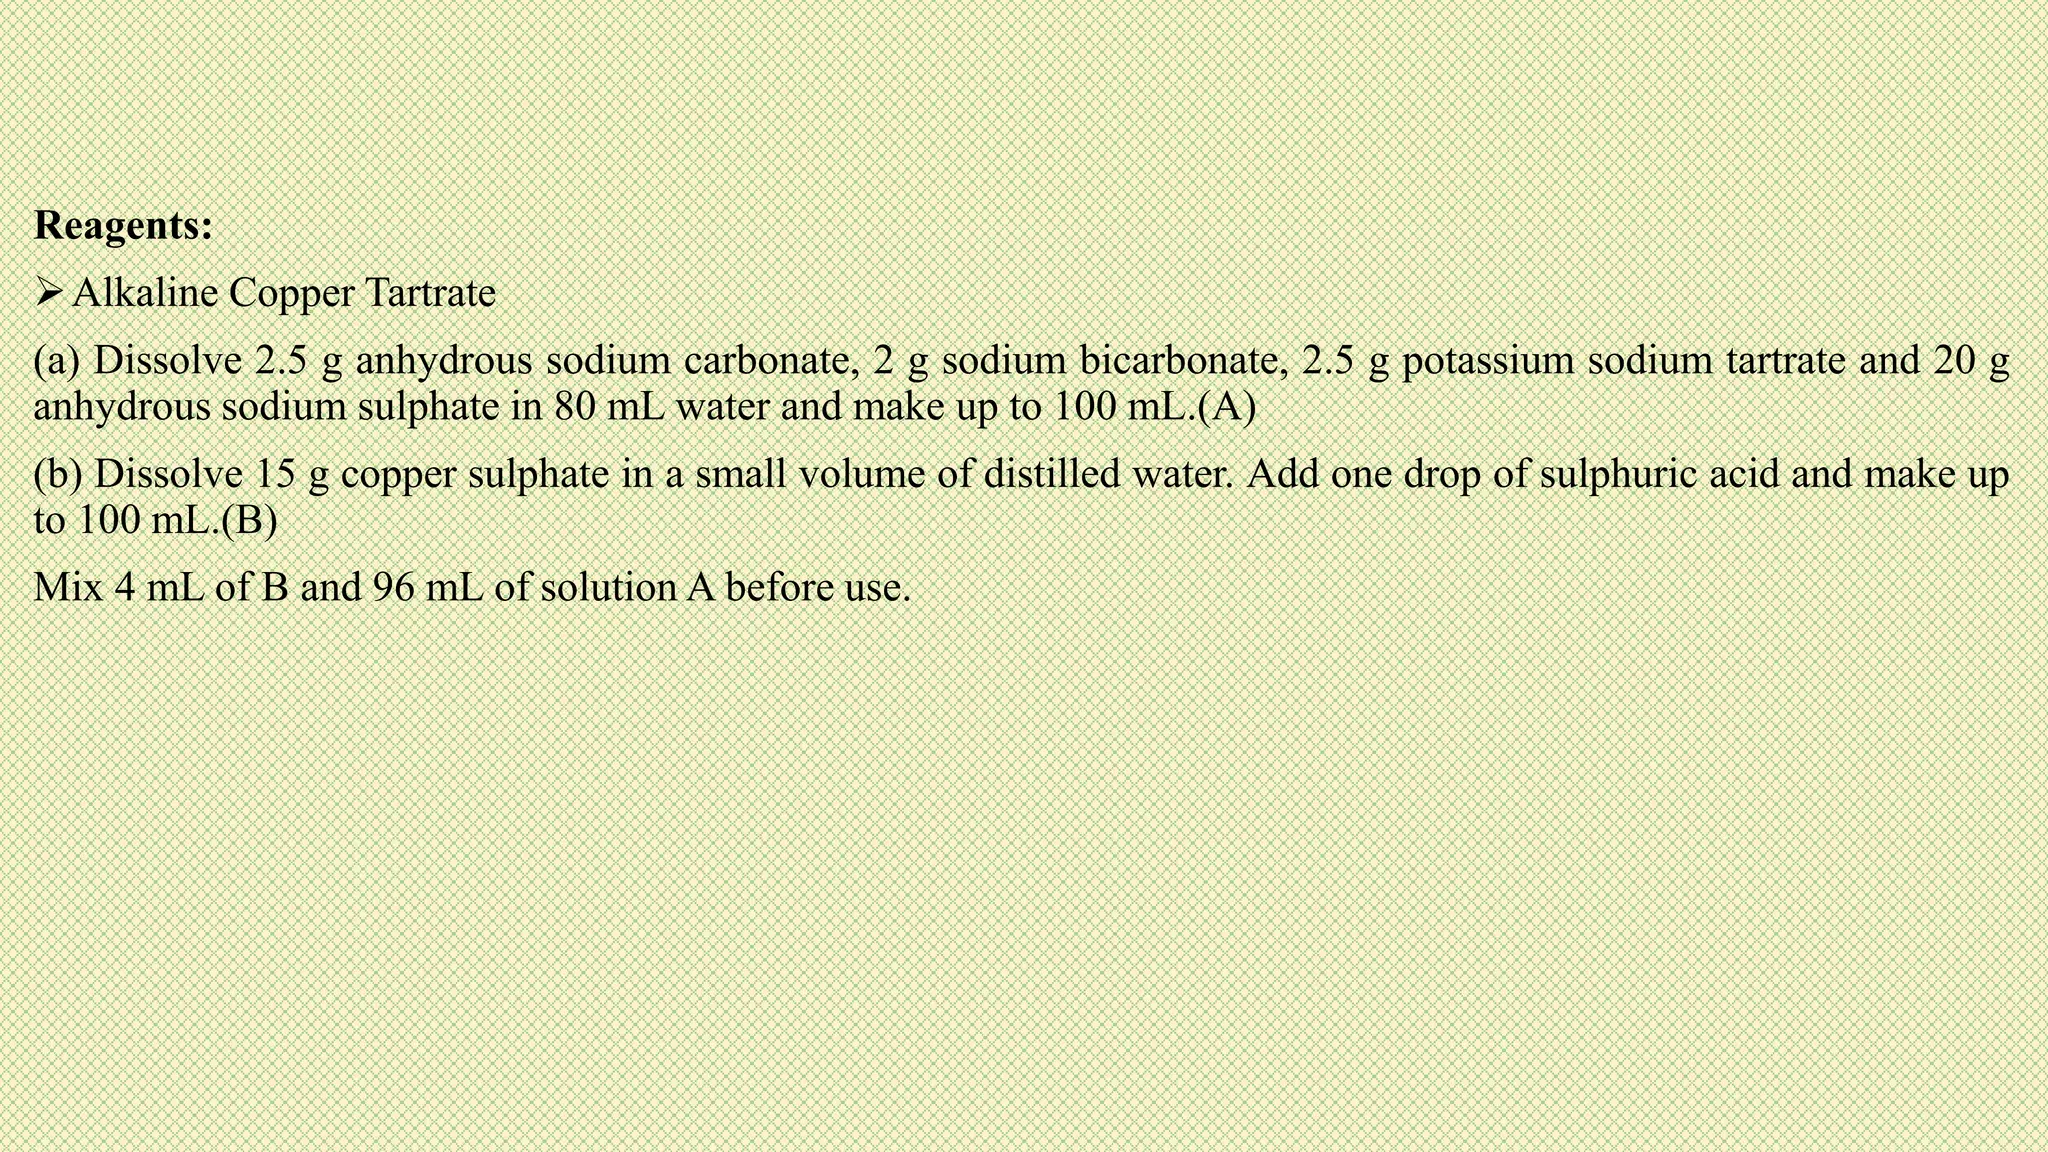
Add 1 mL of alkaline copper tartrate reagent to each tube.
Place the tubes in a boiling water for 10 minutes.
Cool the tubes and add 1 mL of arsenomolybolic acid reagent to all the tubes.](https://image.slidesharecdn.com/quantitativeestimationofcarbohydrateslikhithk-211224114603/75/Quantitative-estimation-of-carbohydrates-Likhith-K-35-2048.jpg)