Downloaded 69 times
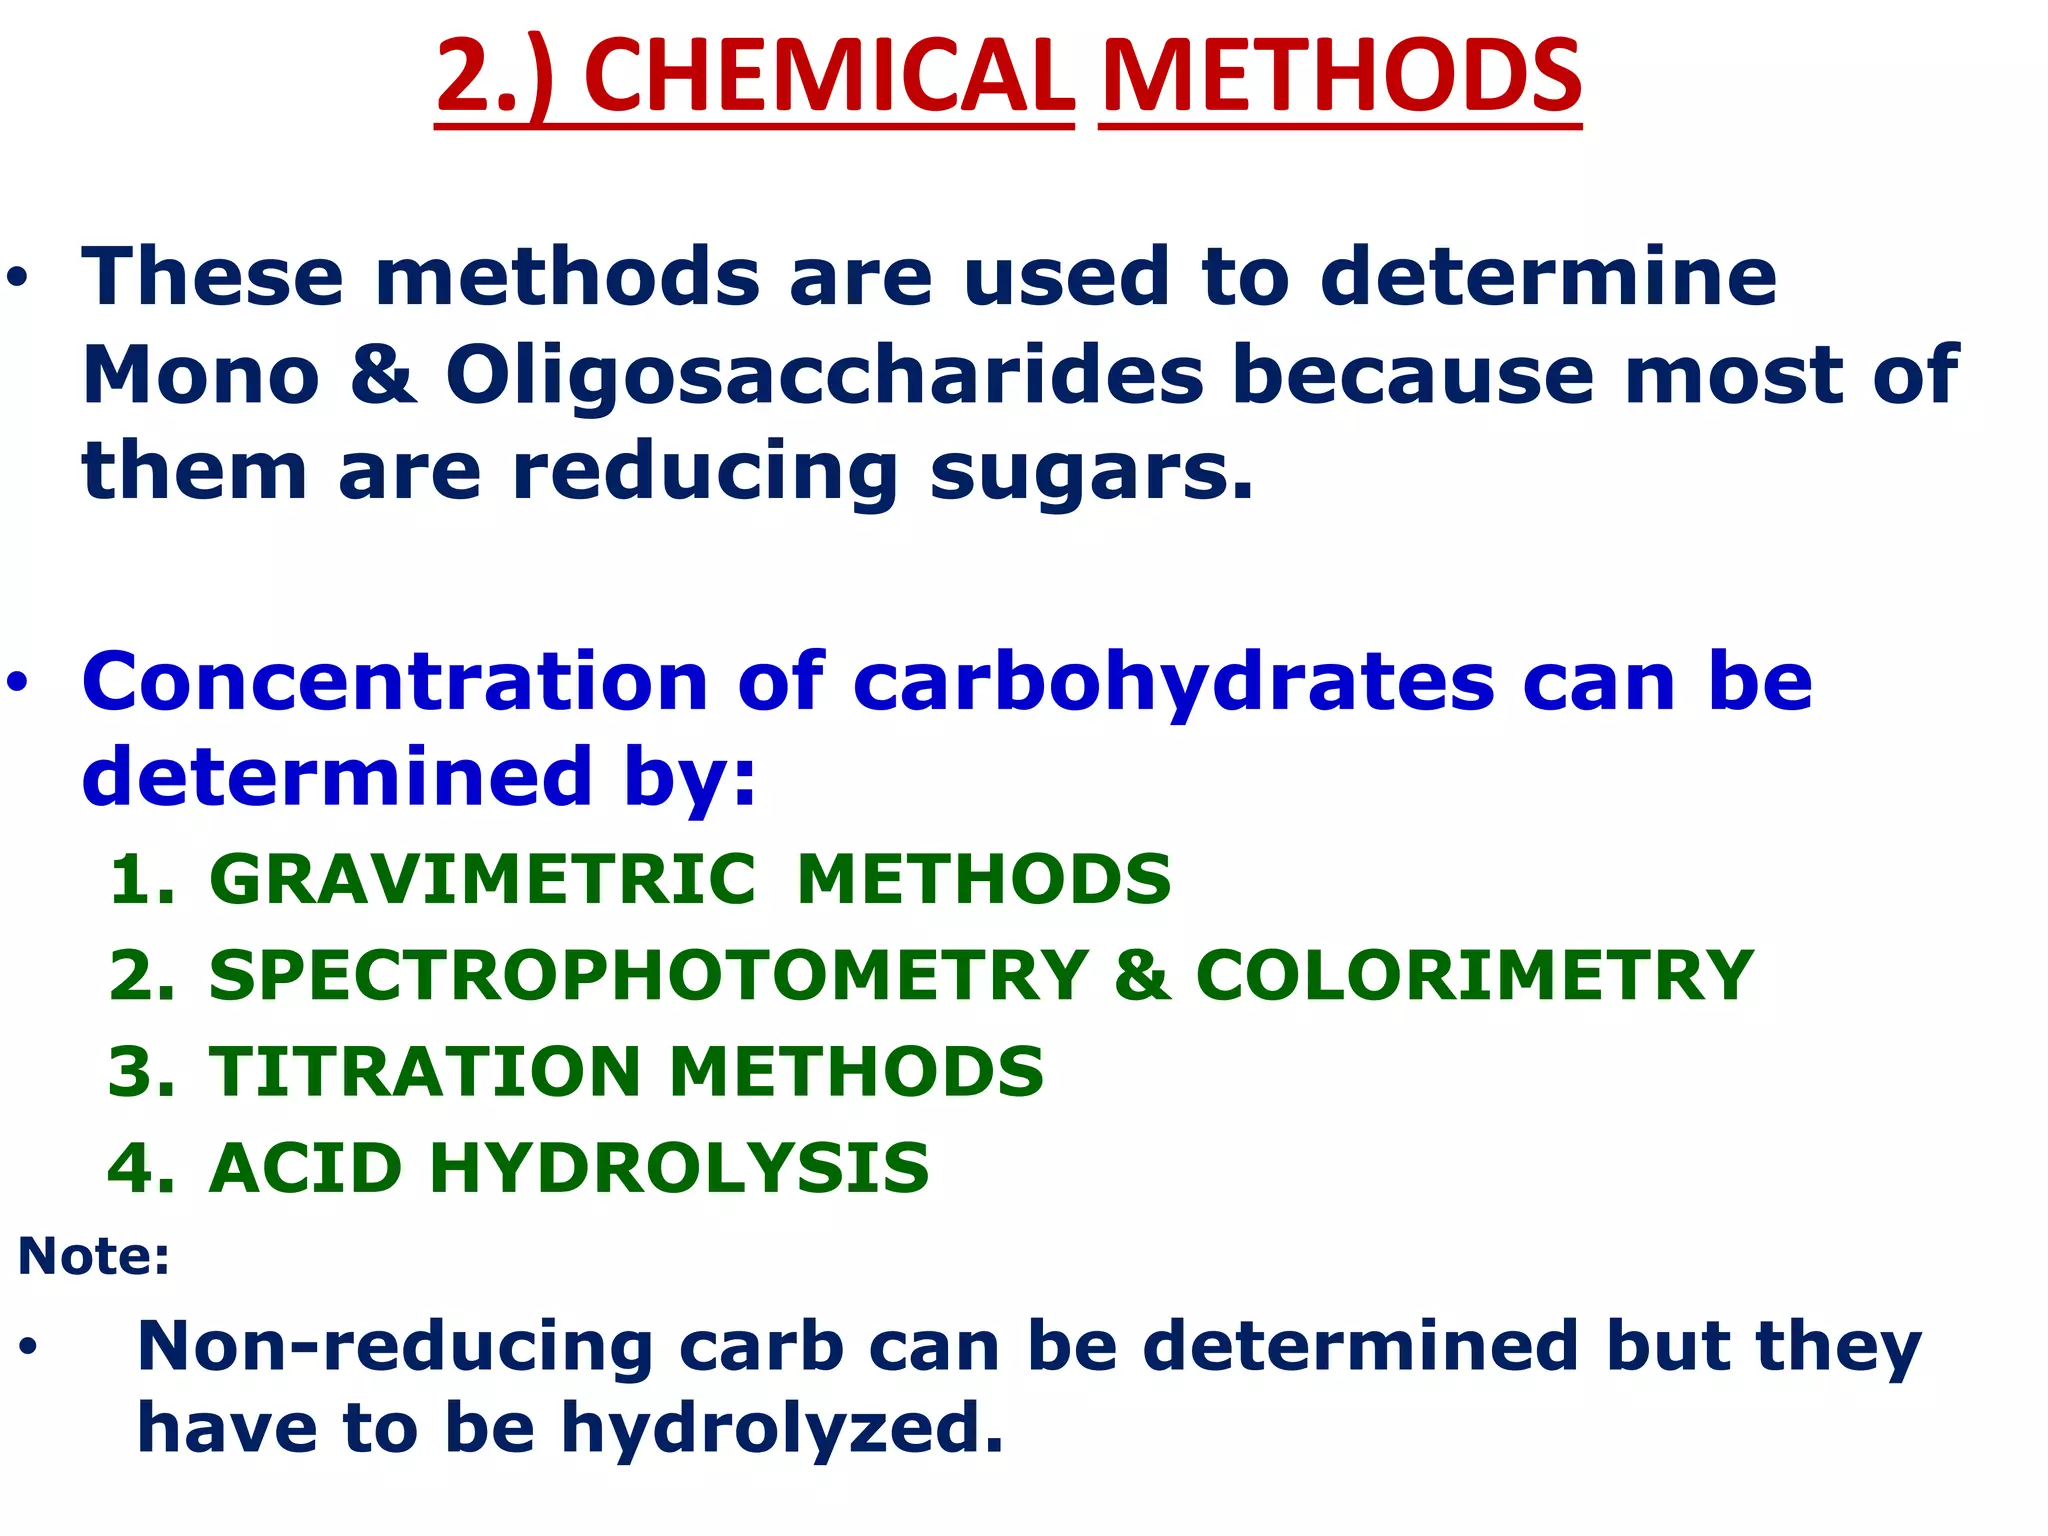

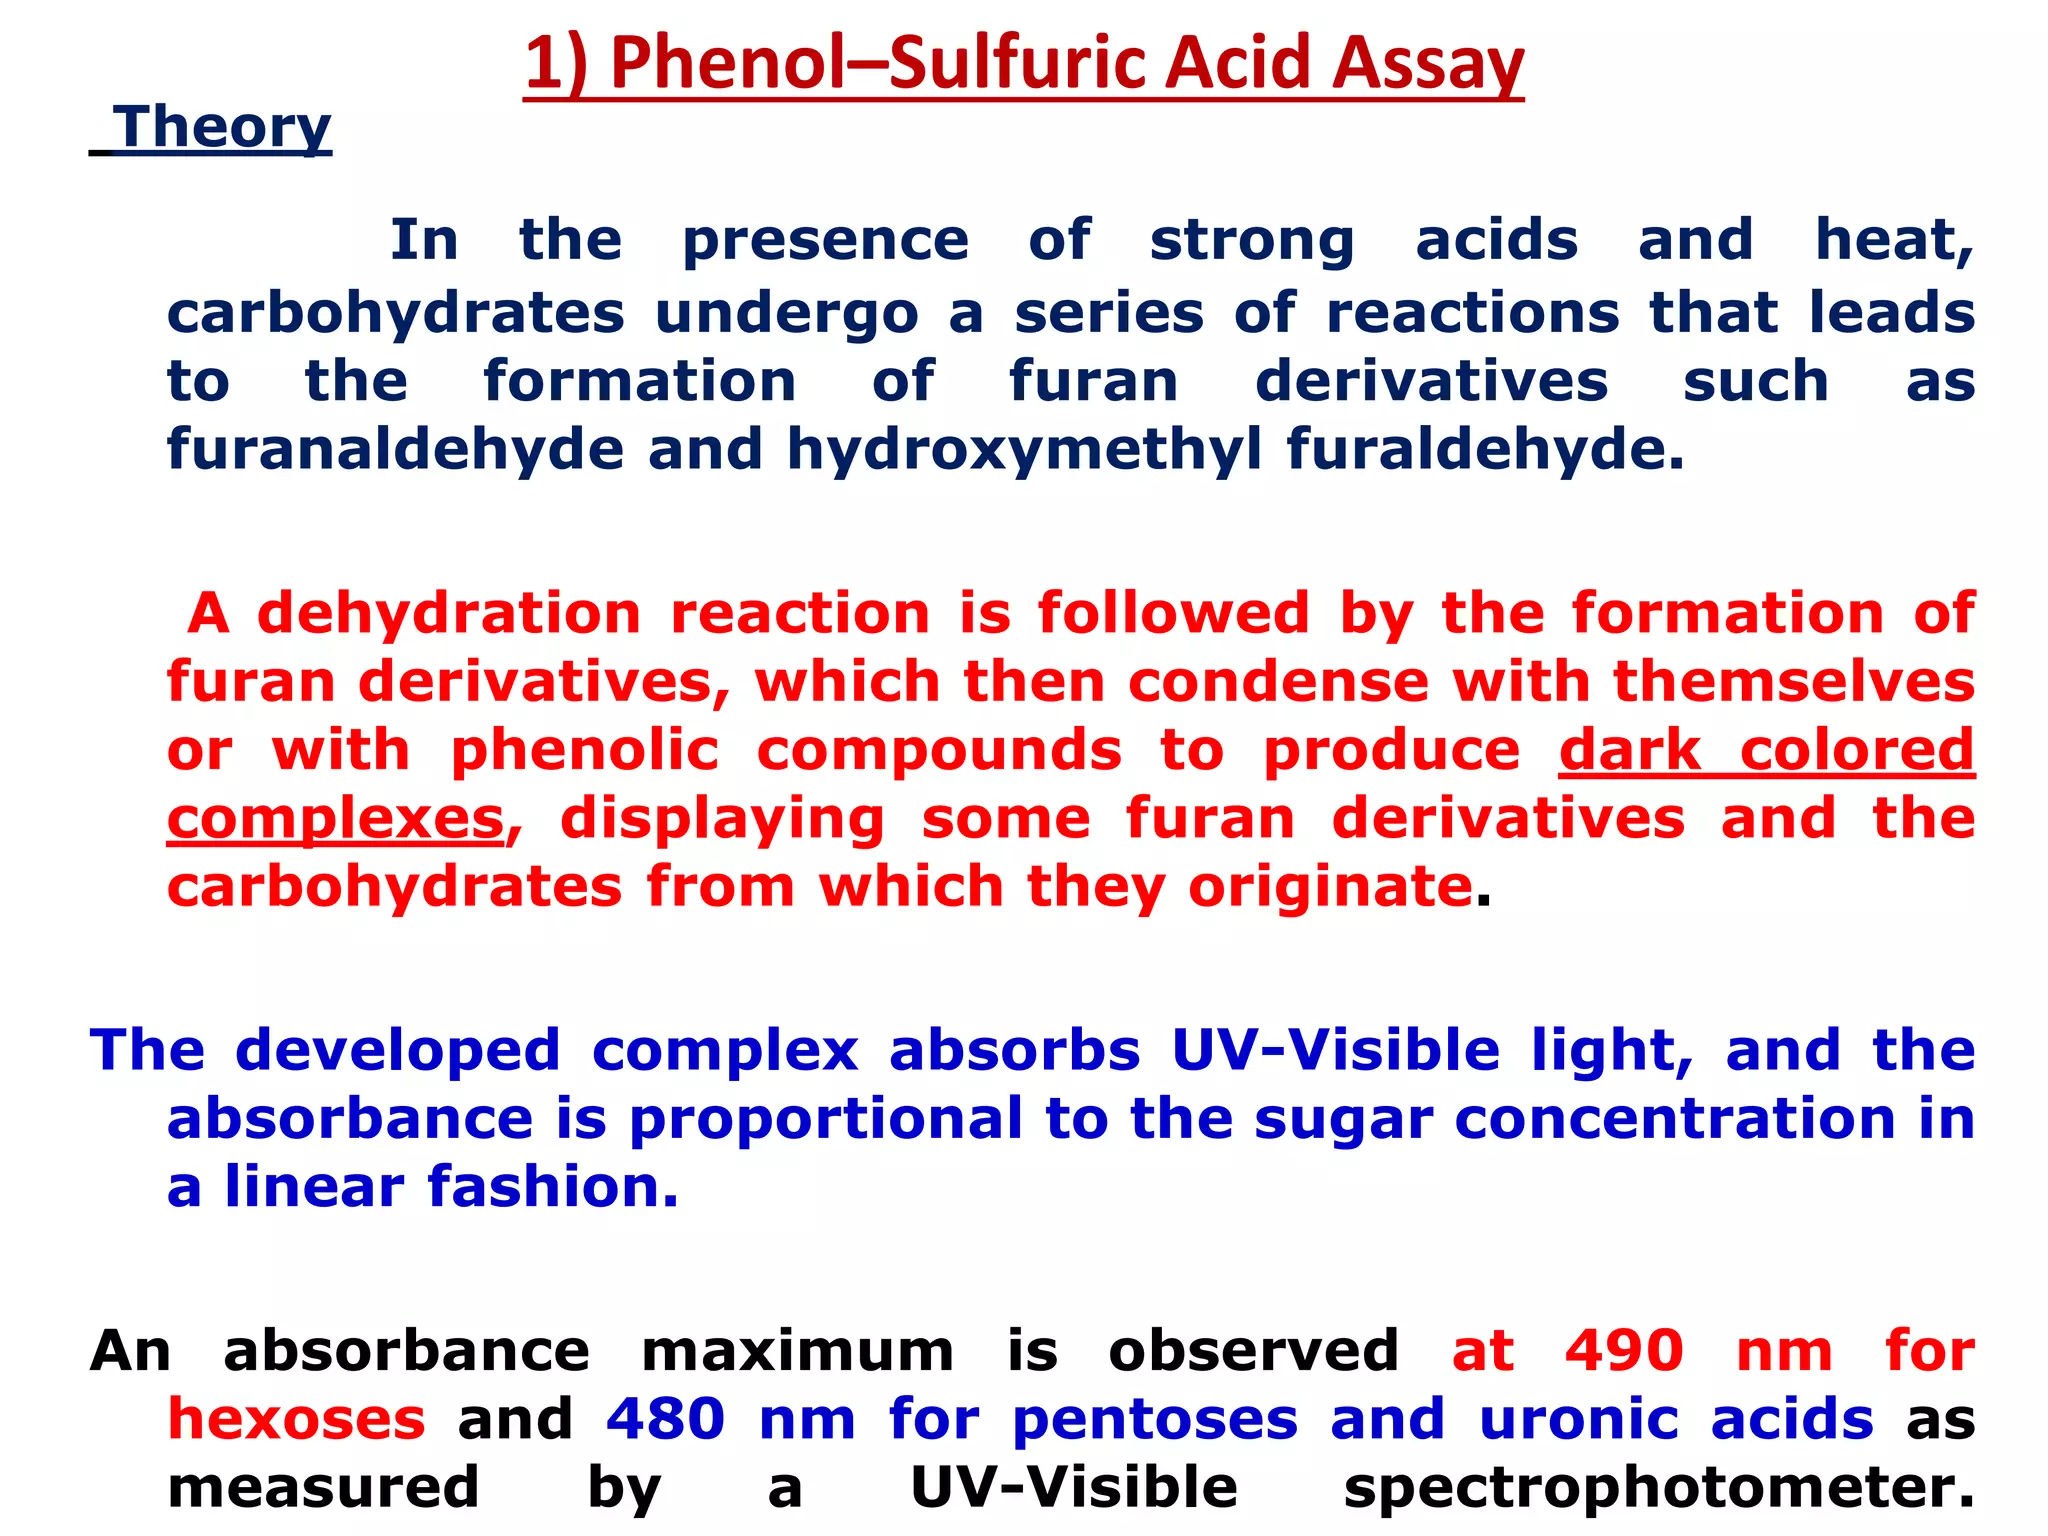
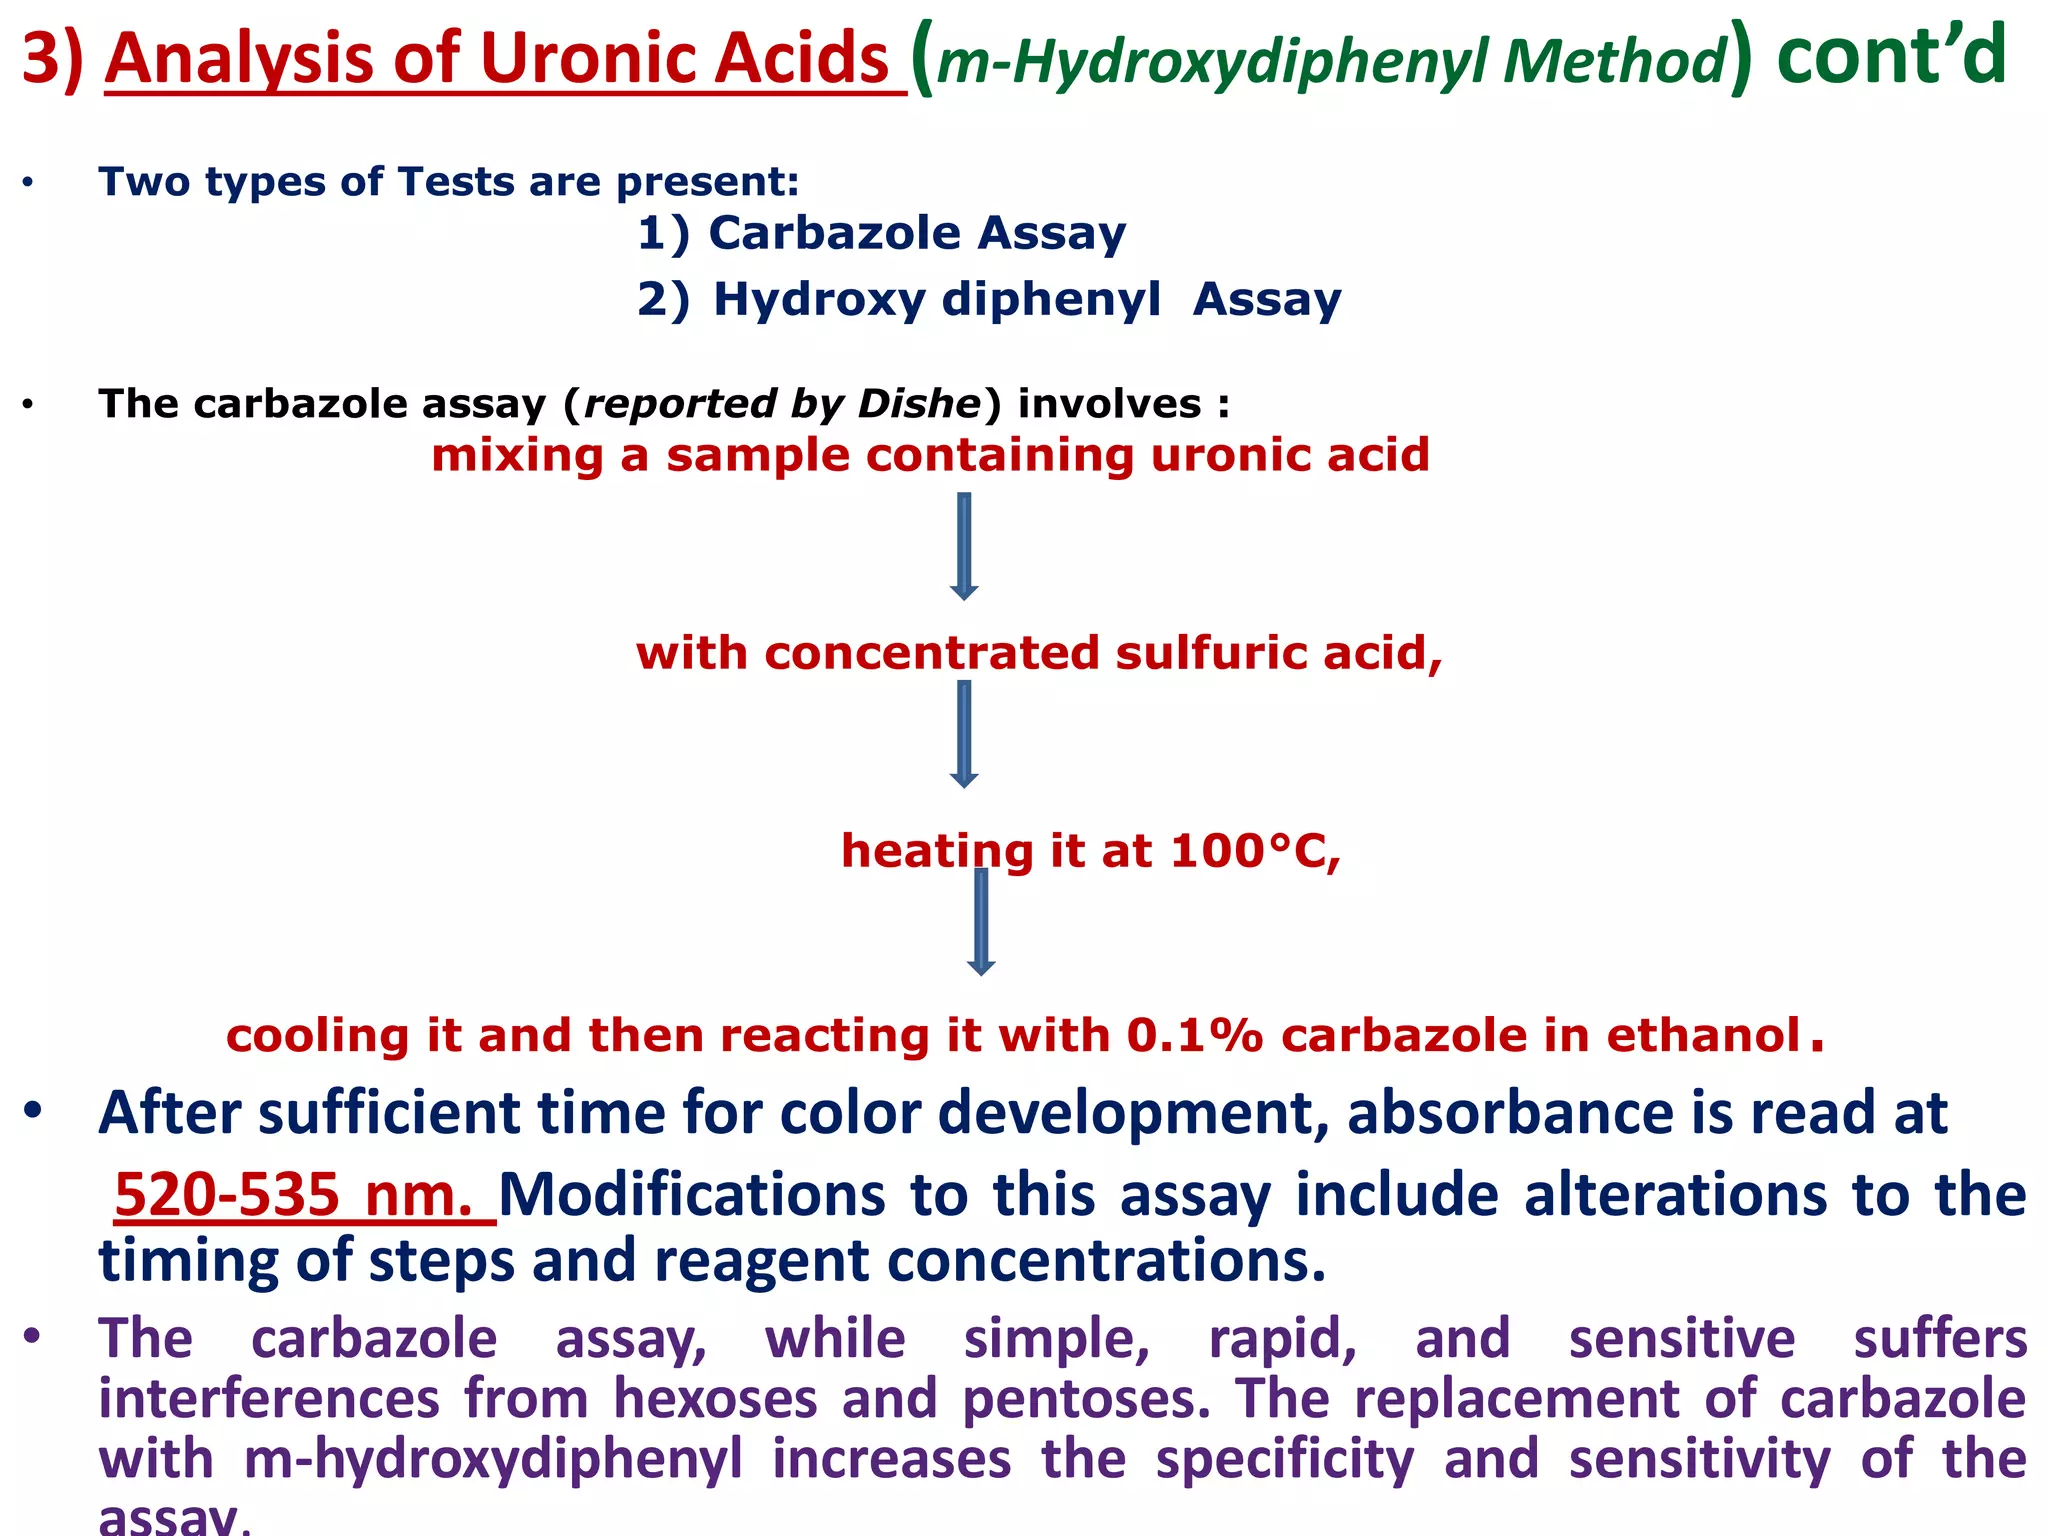
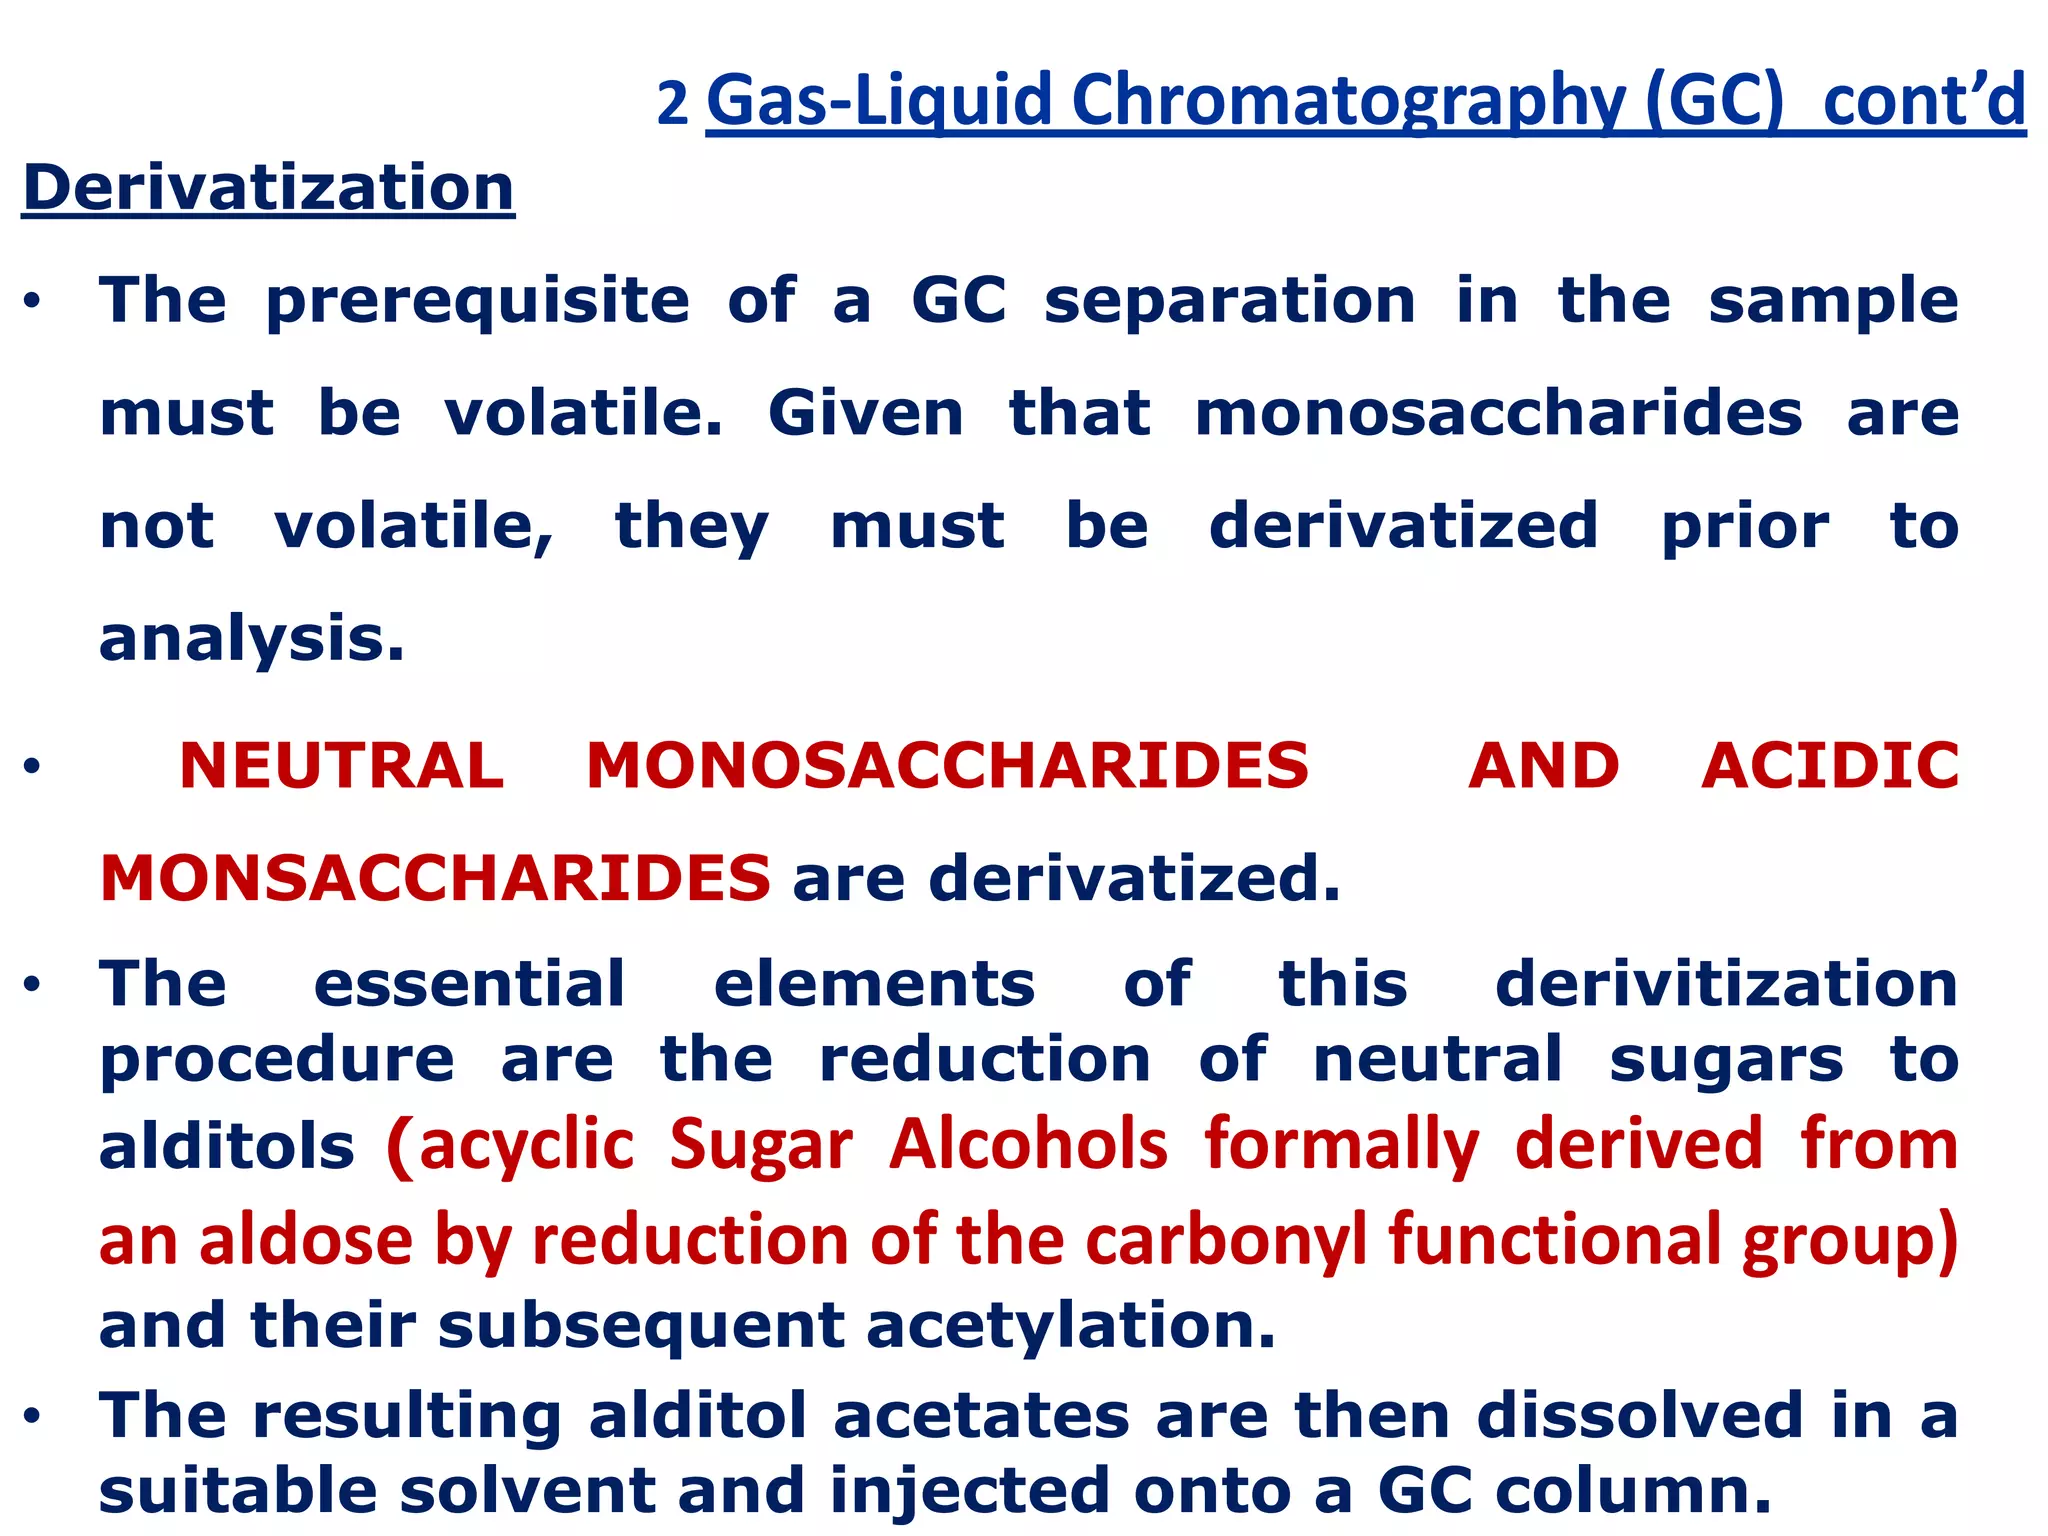
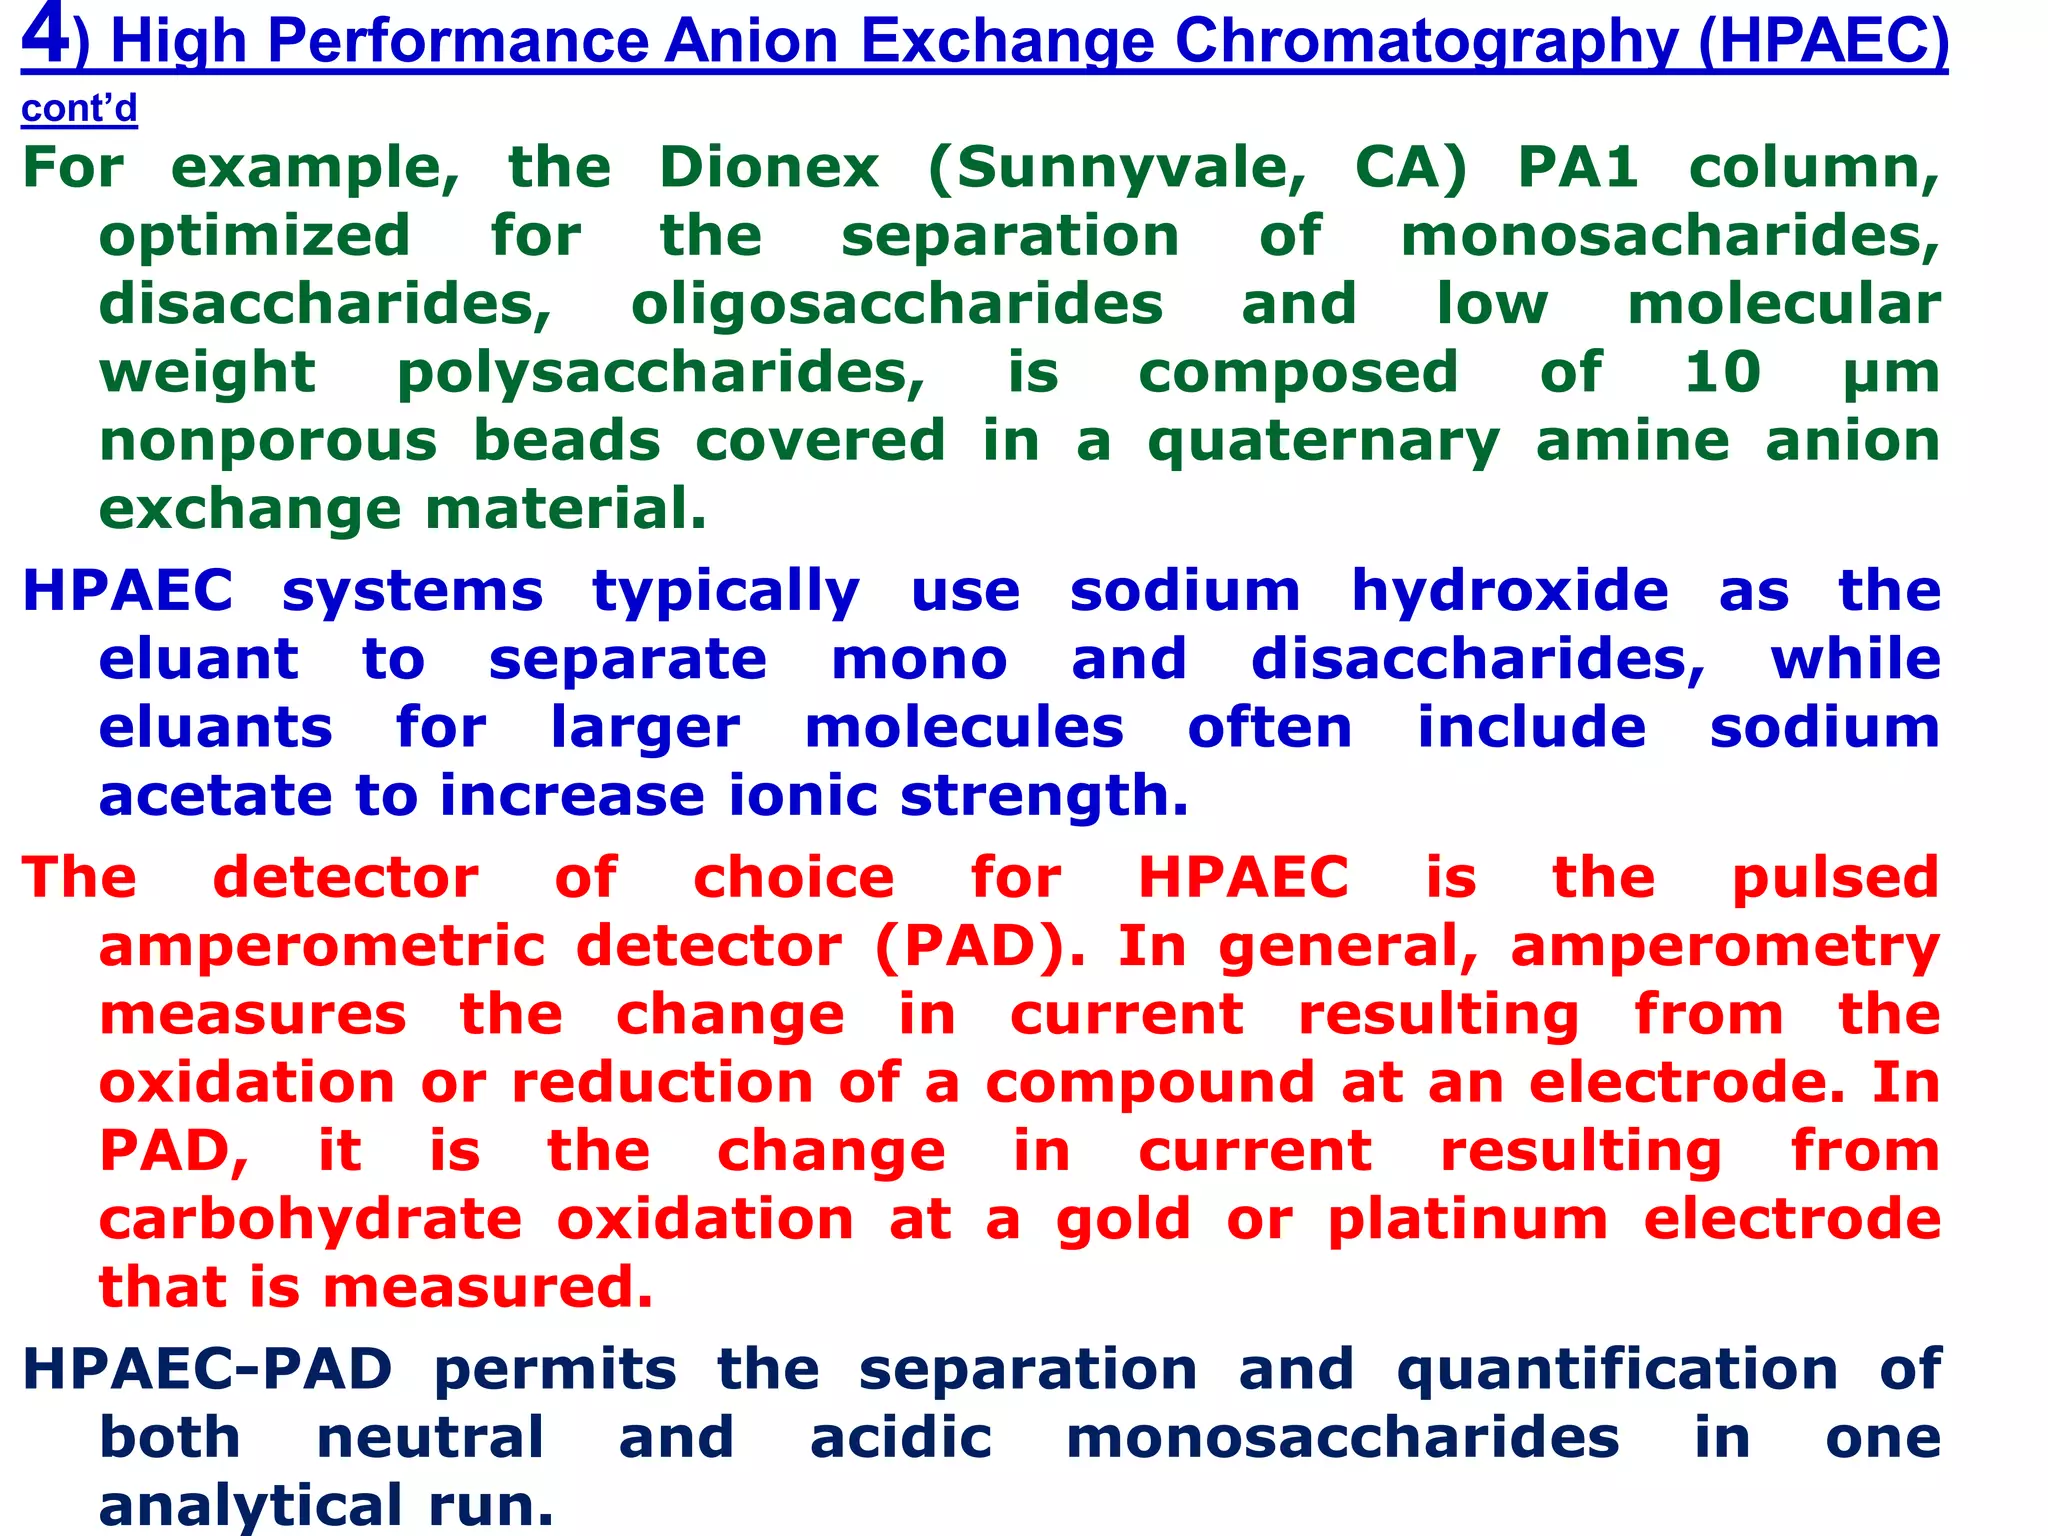
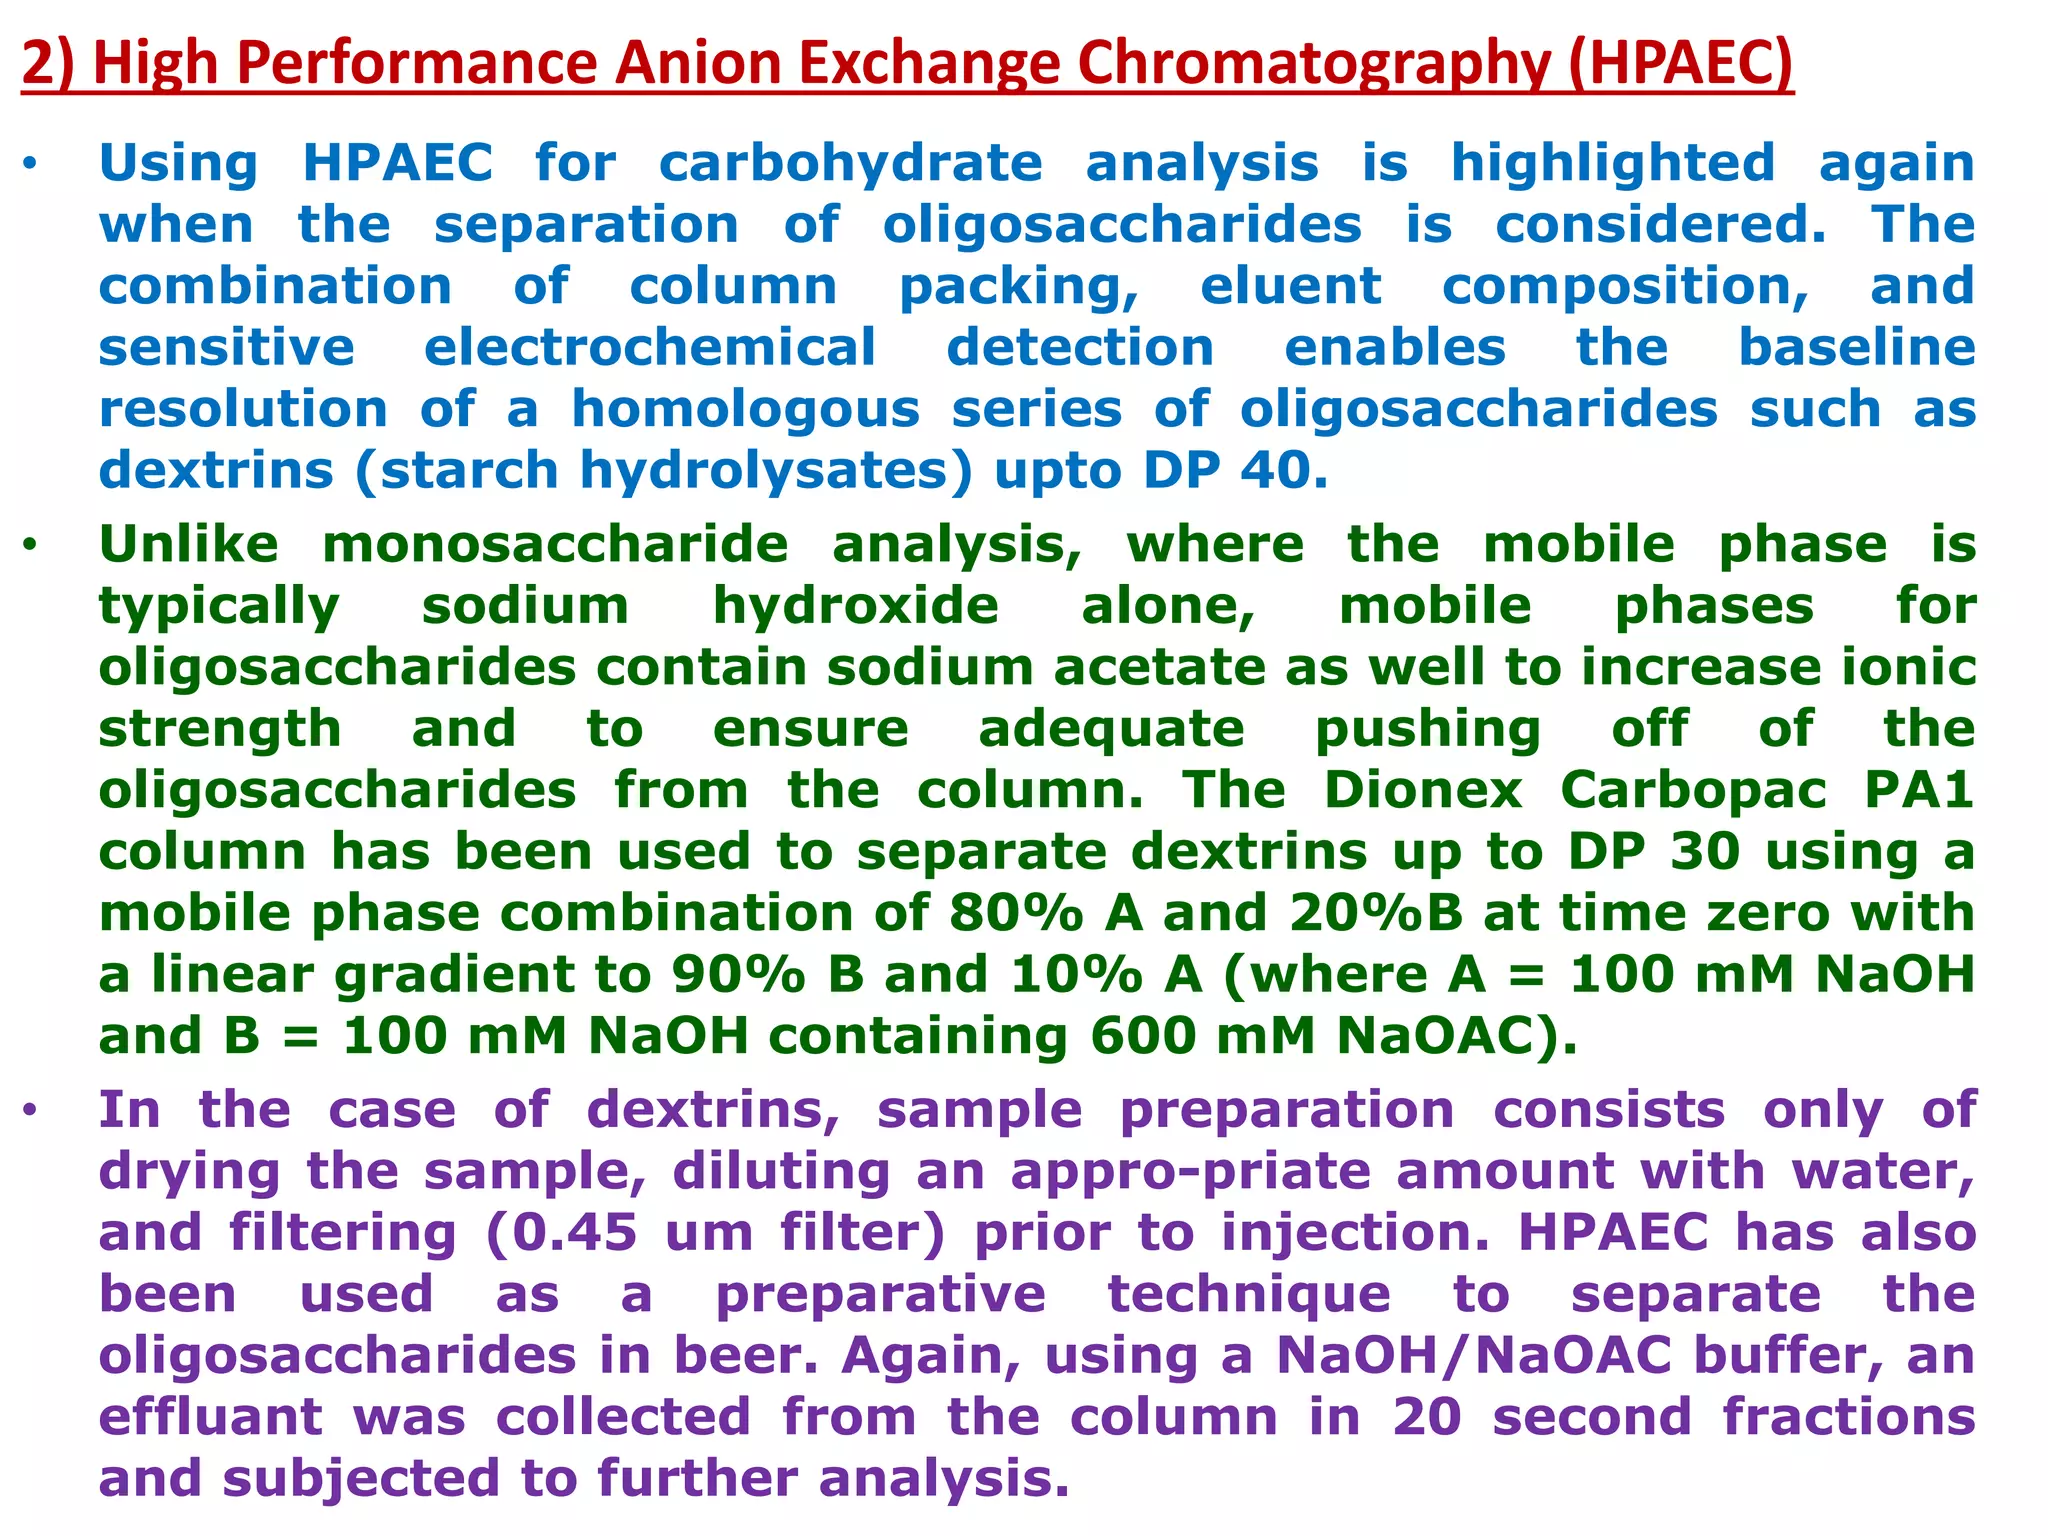
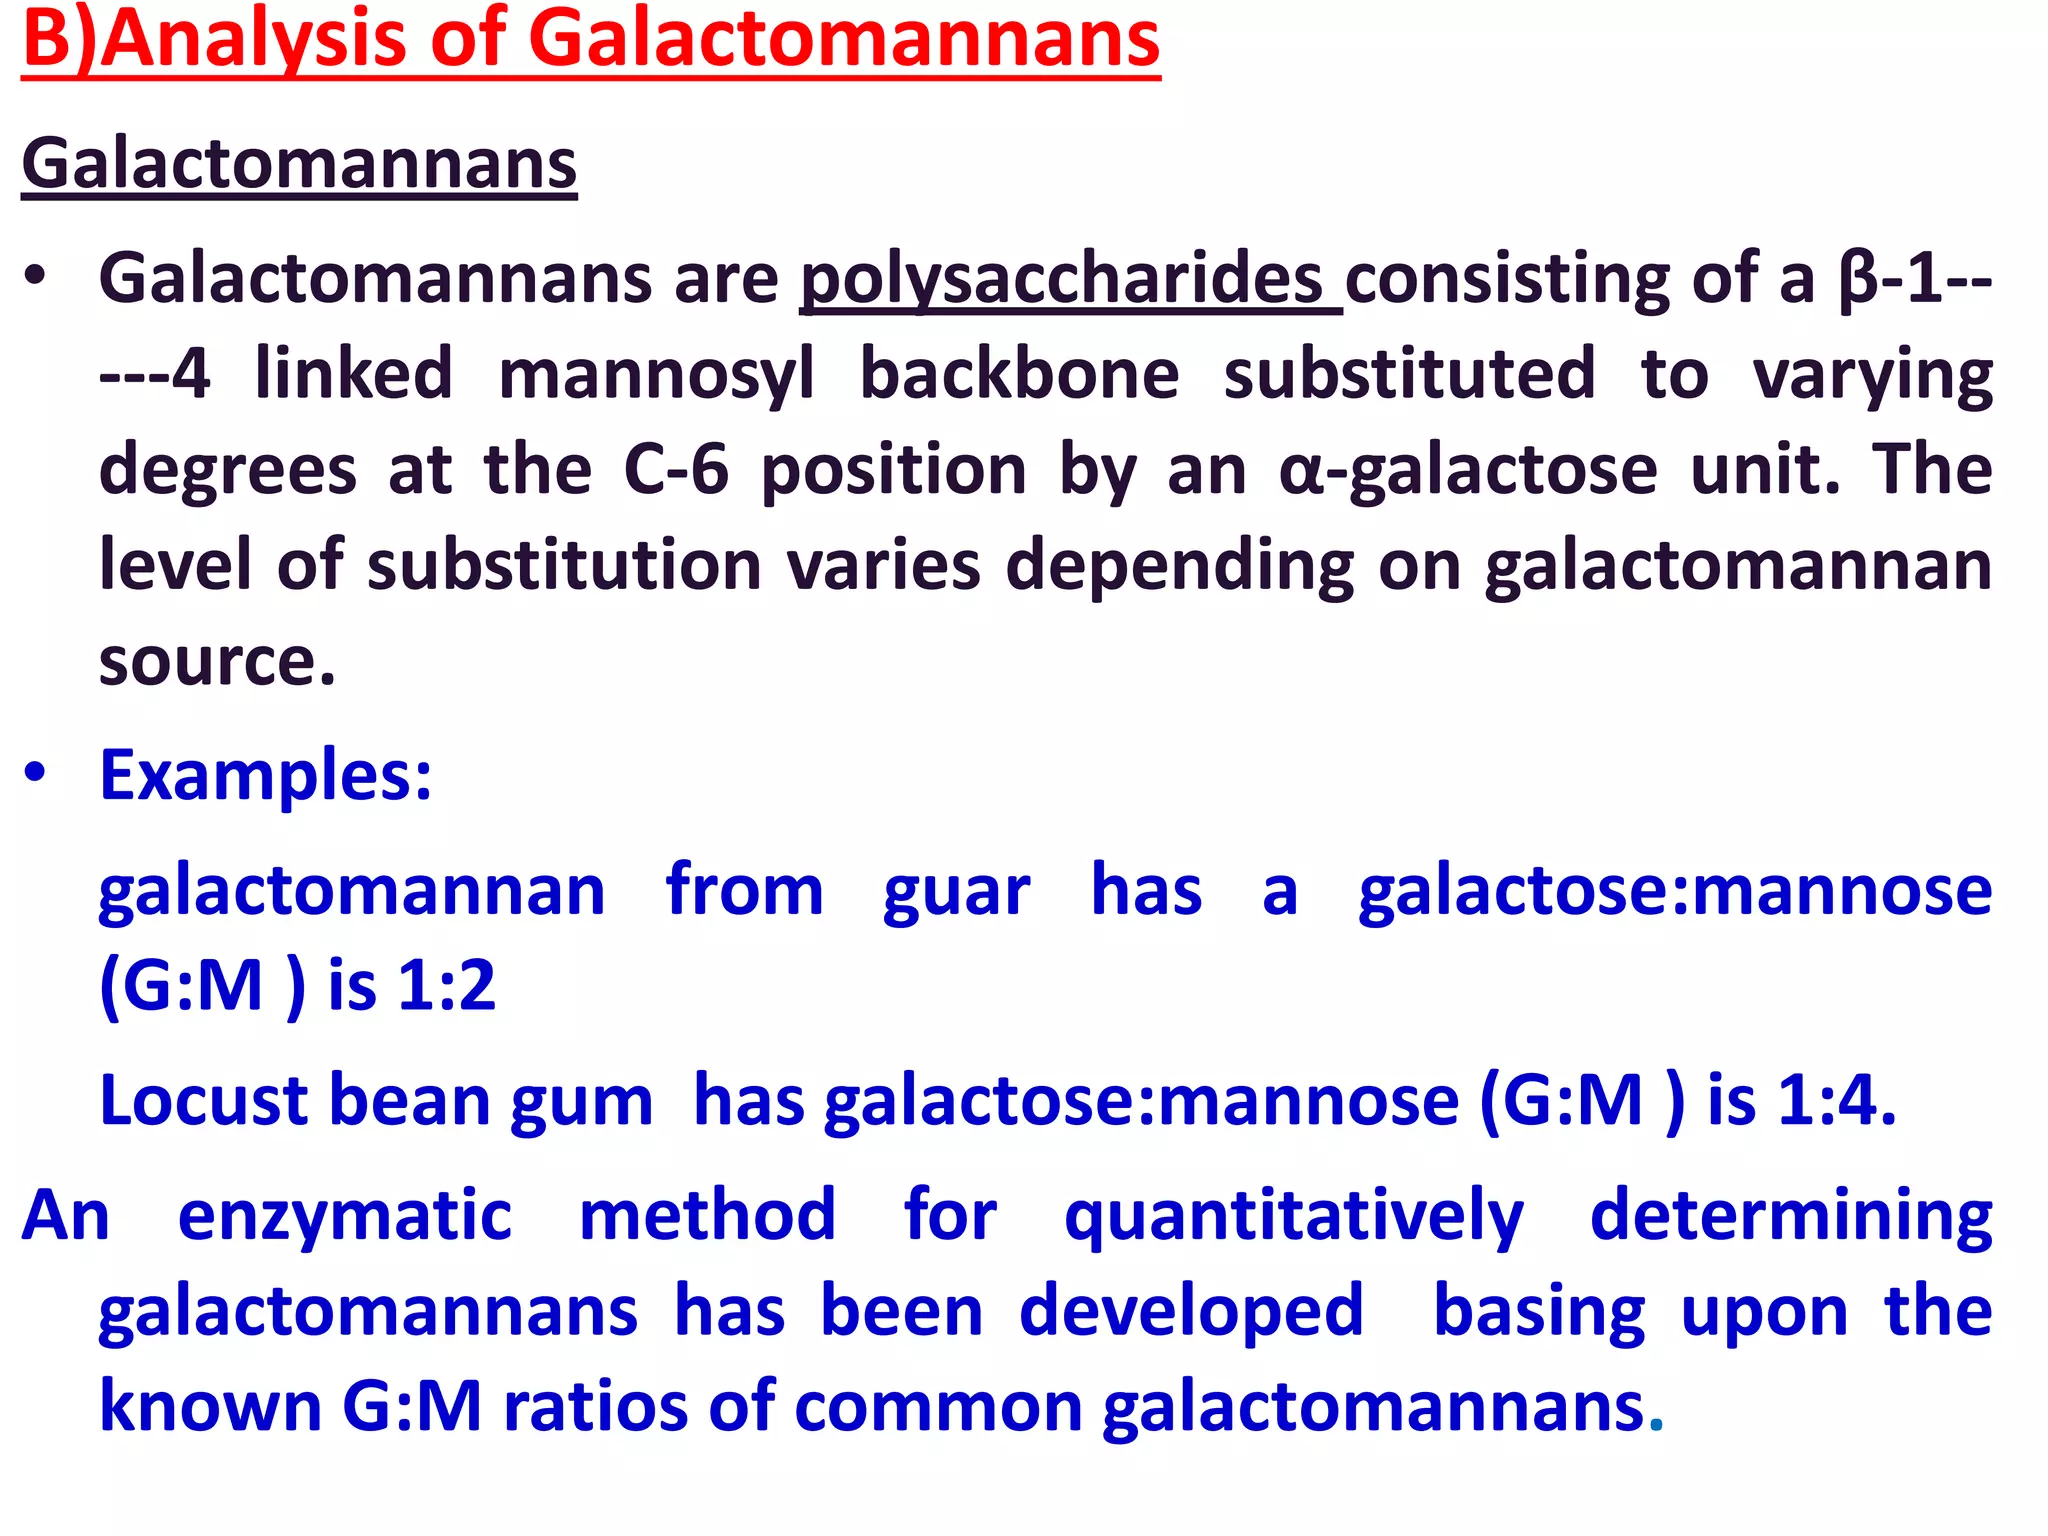
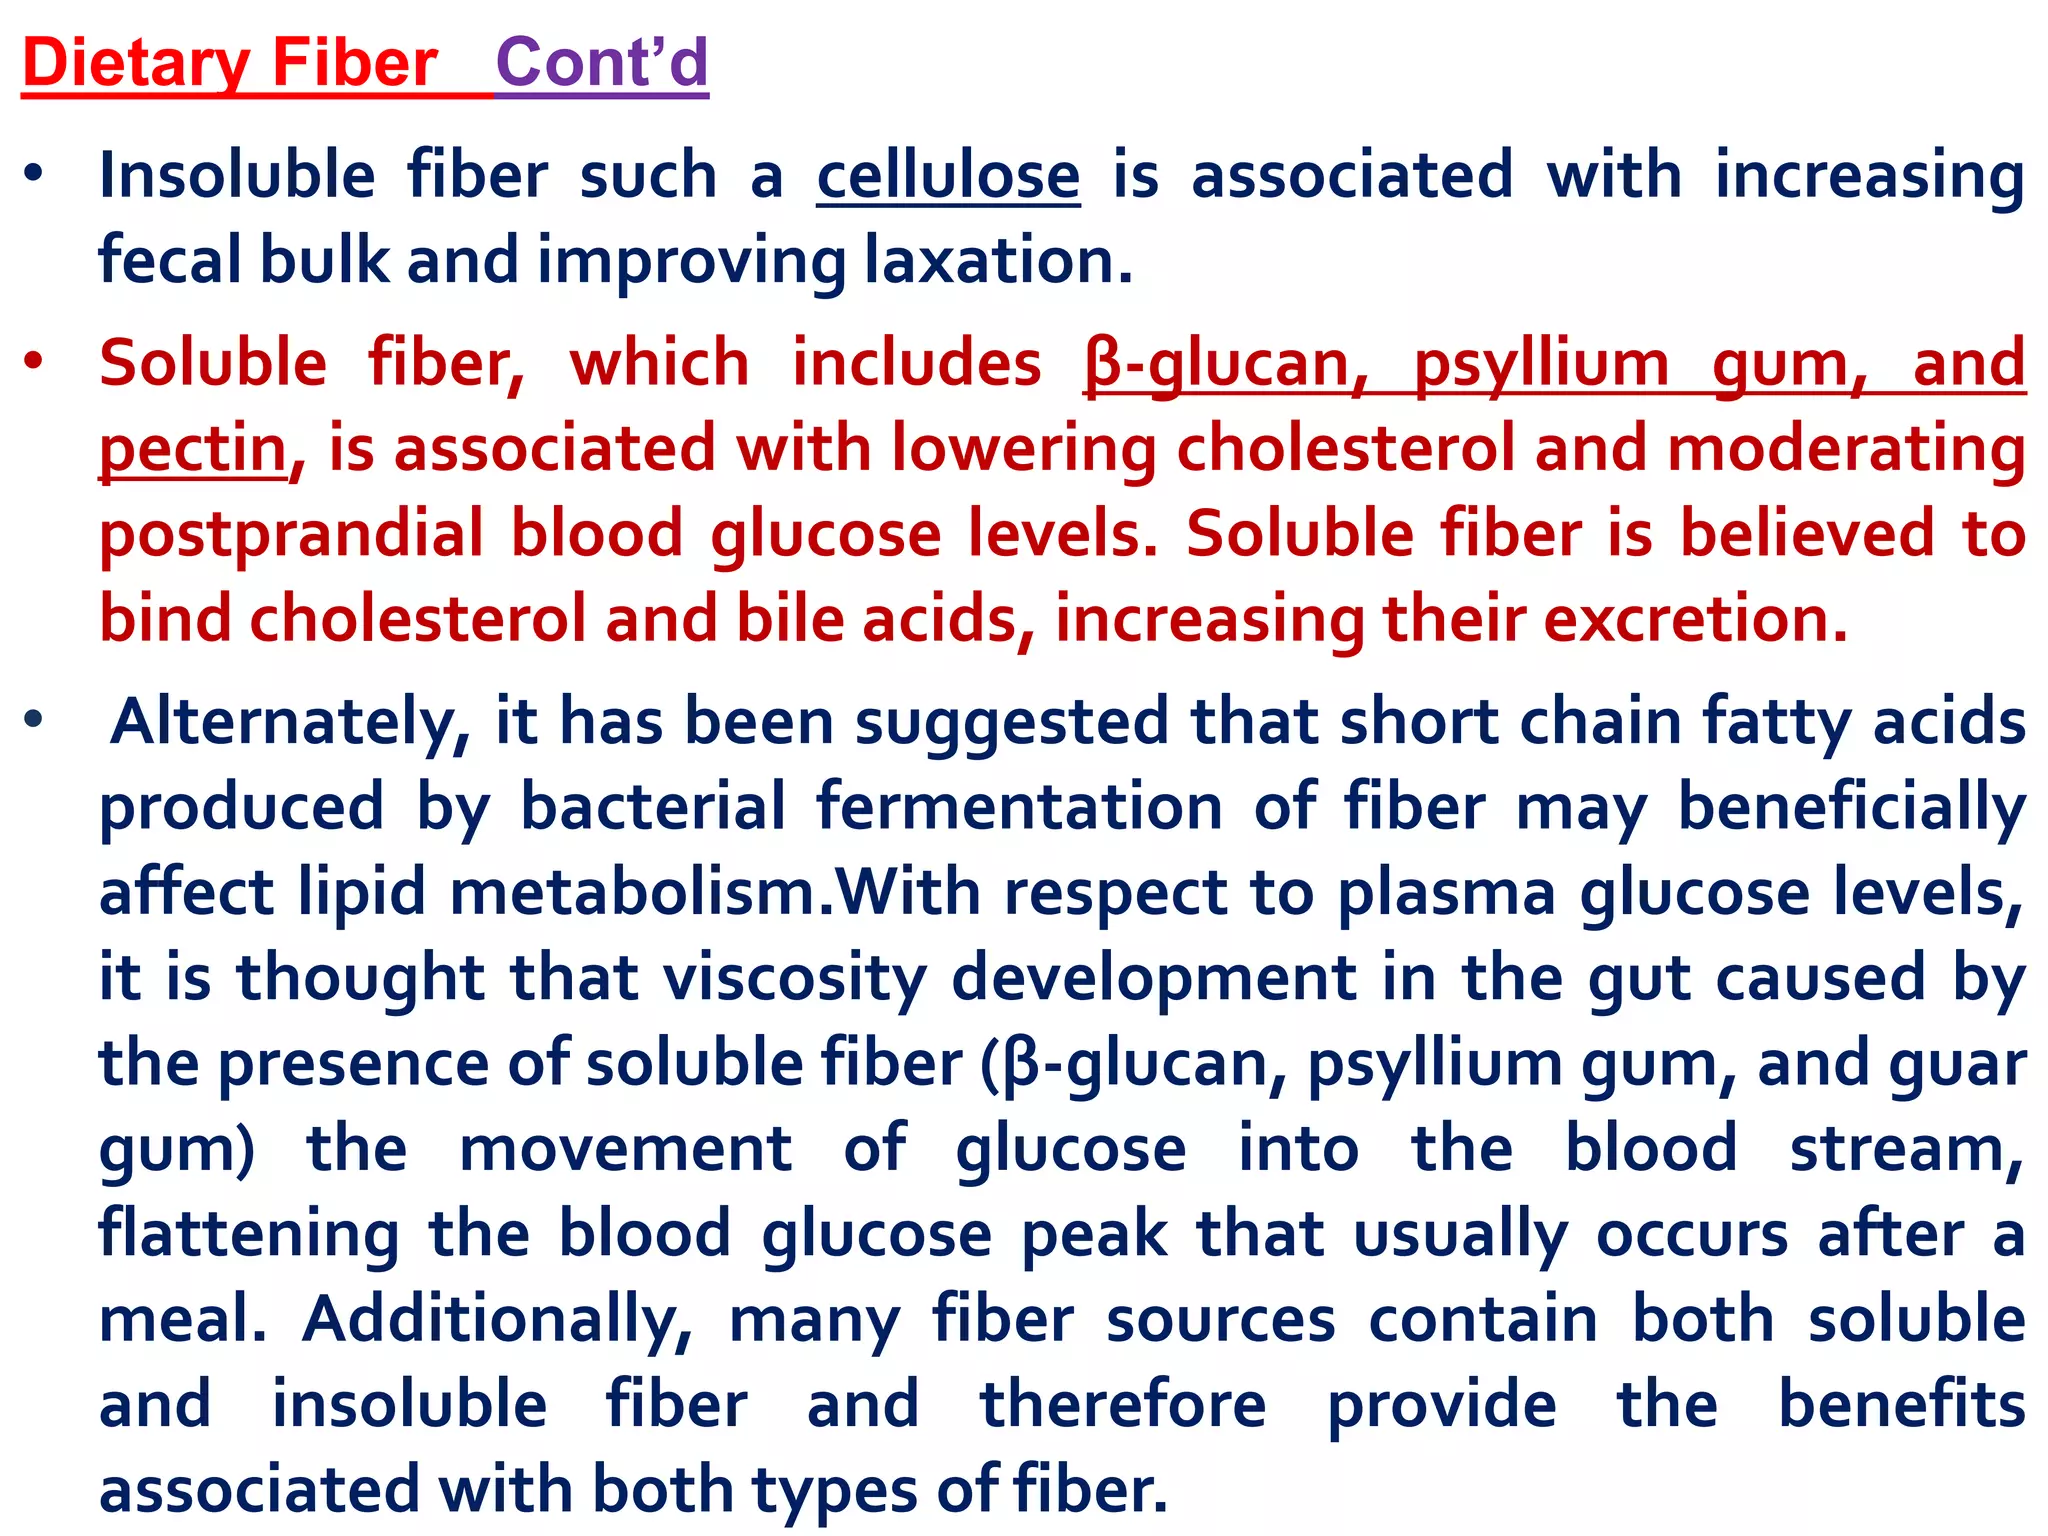
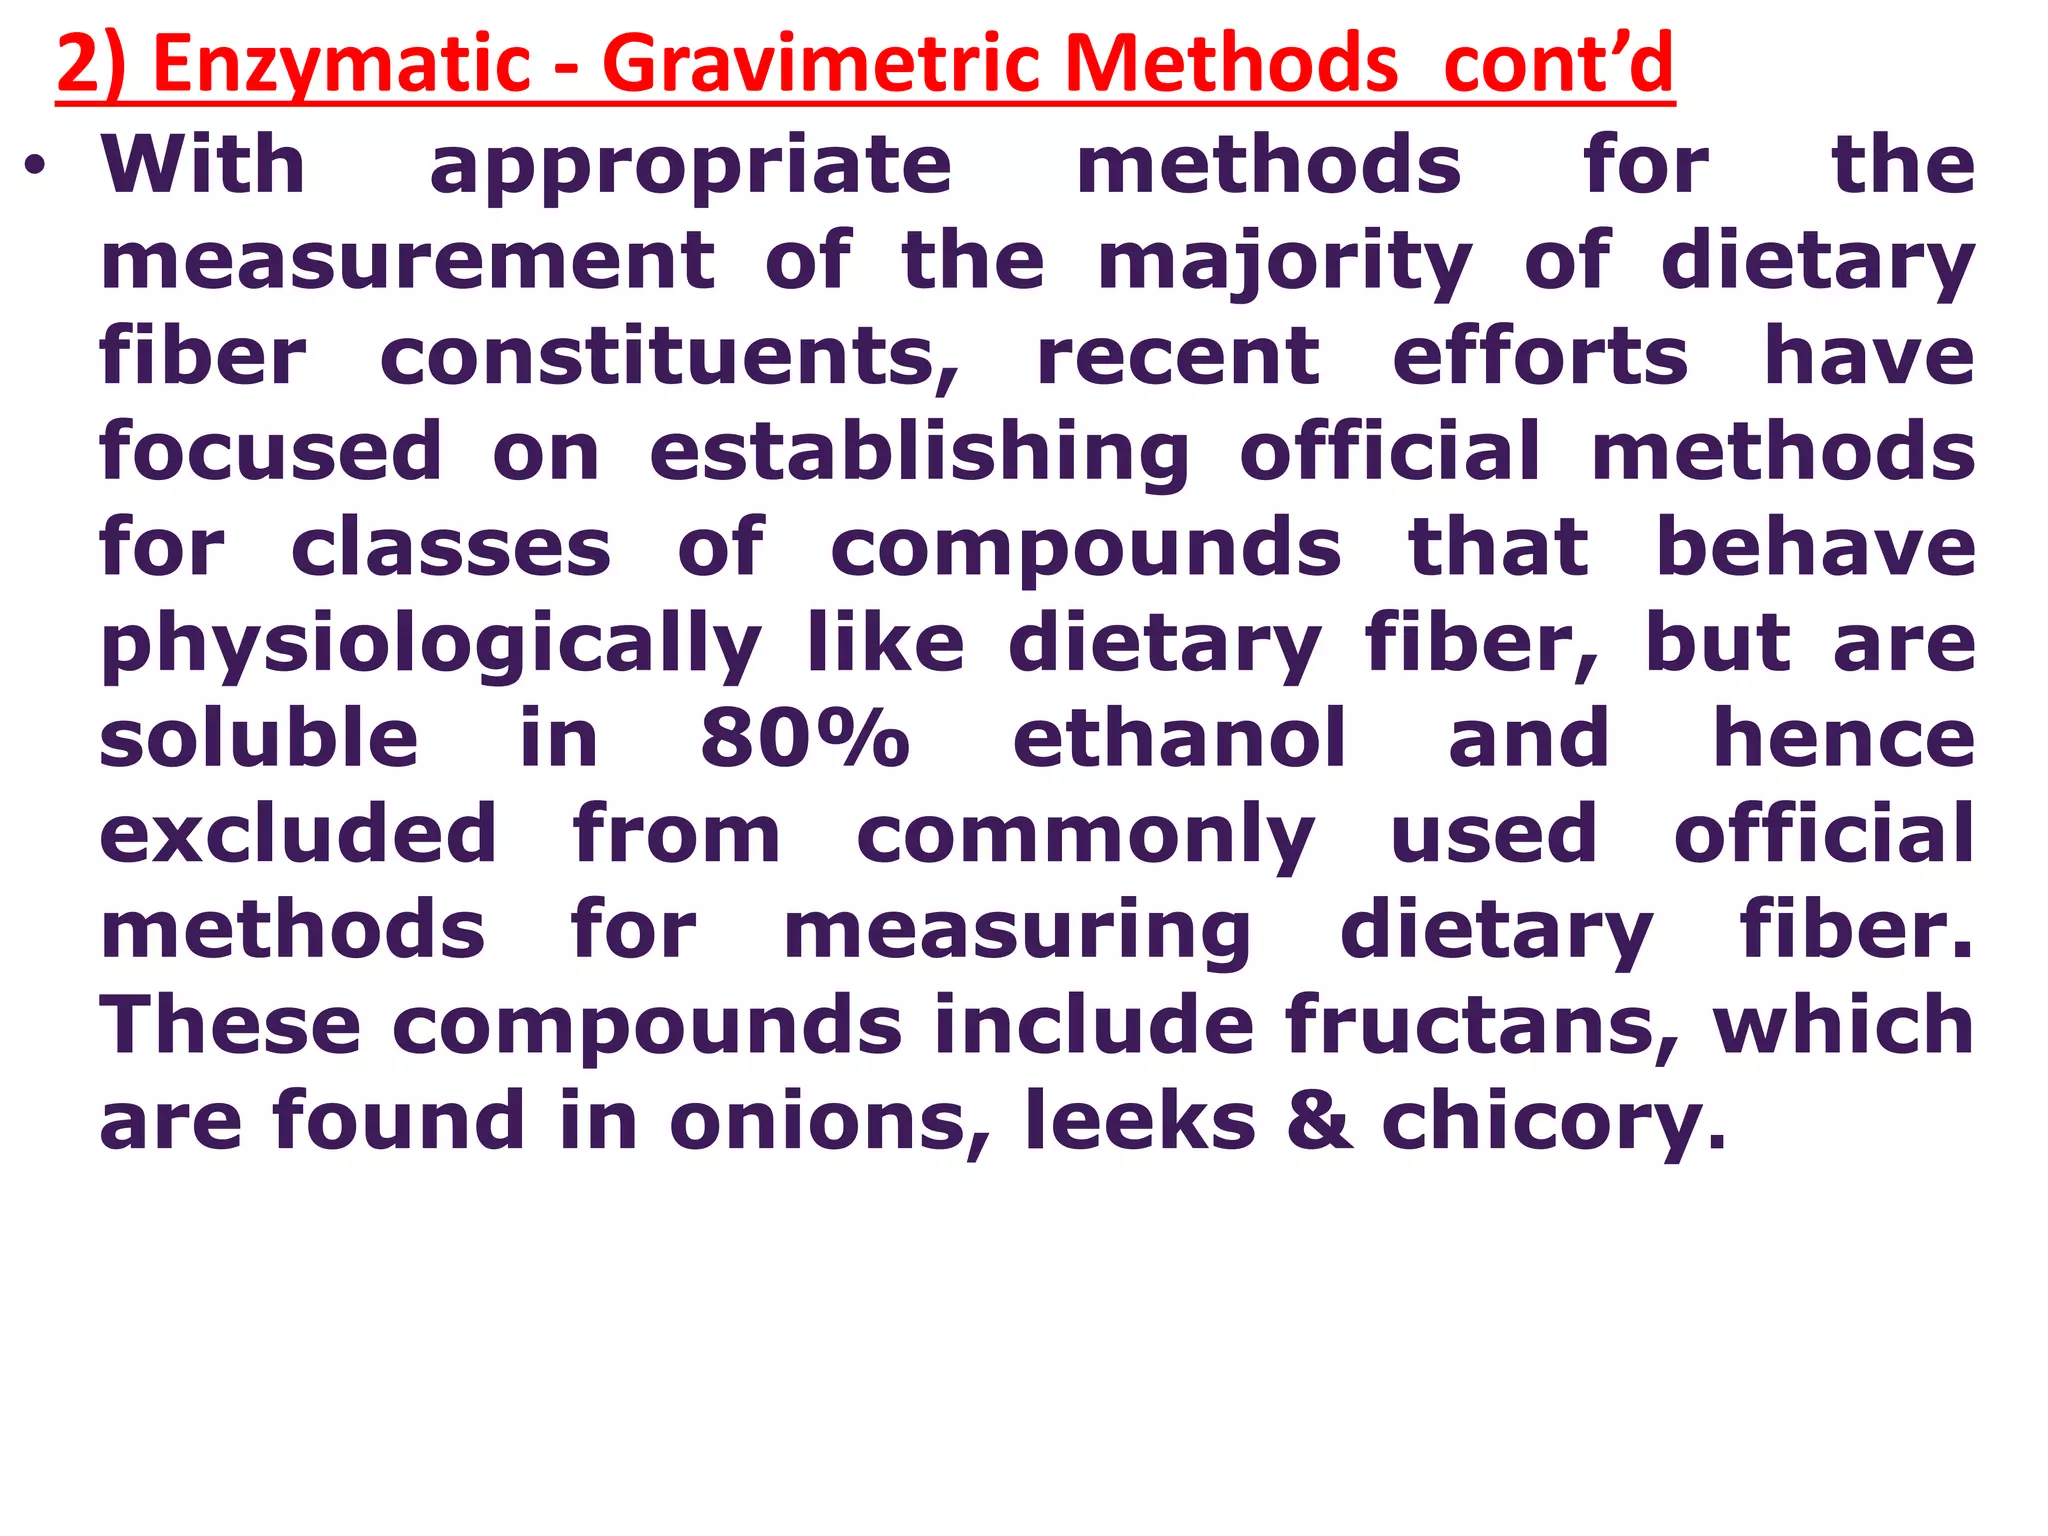
![Galactose reactions
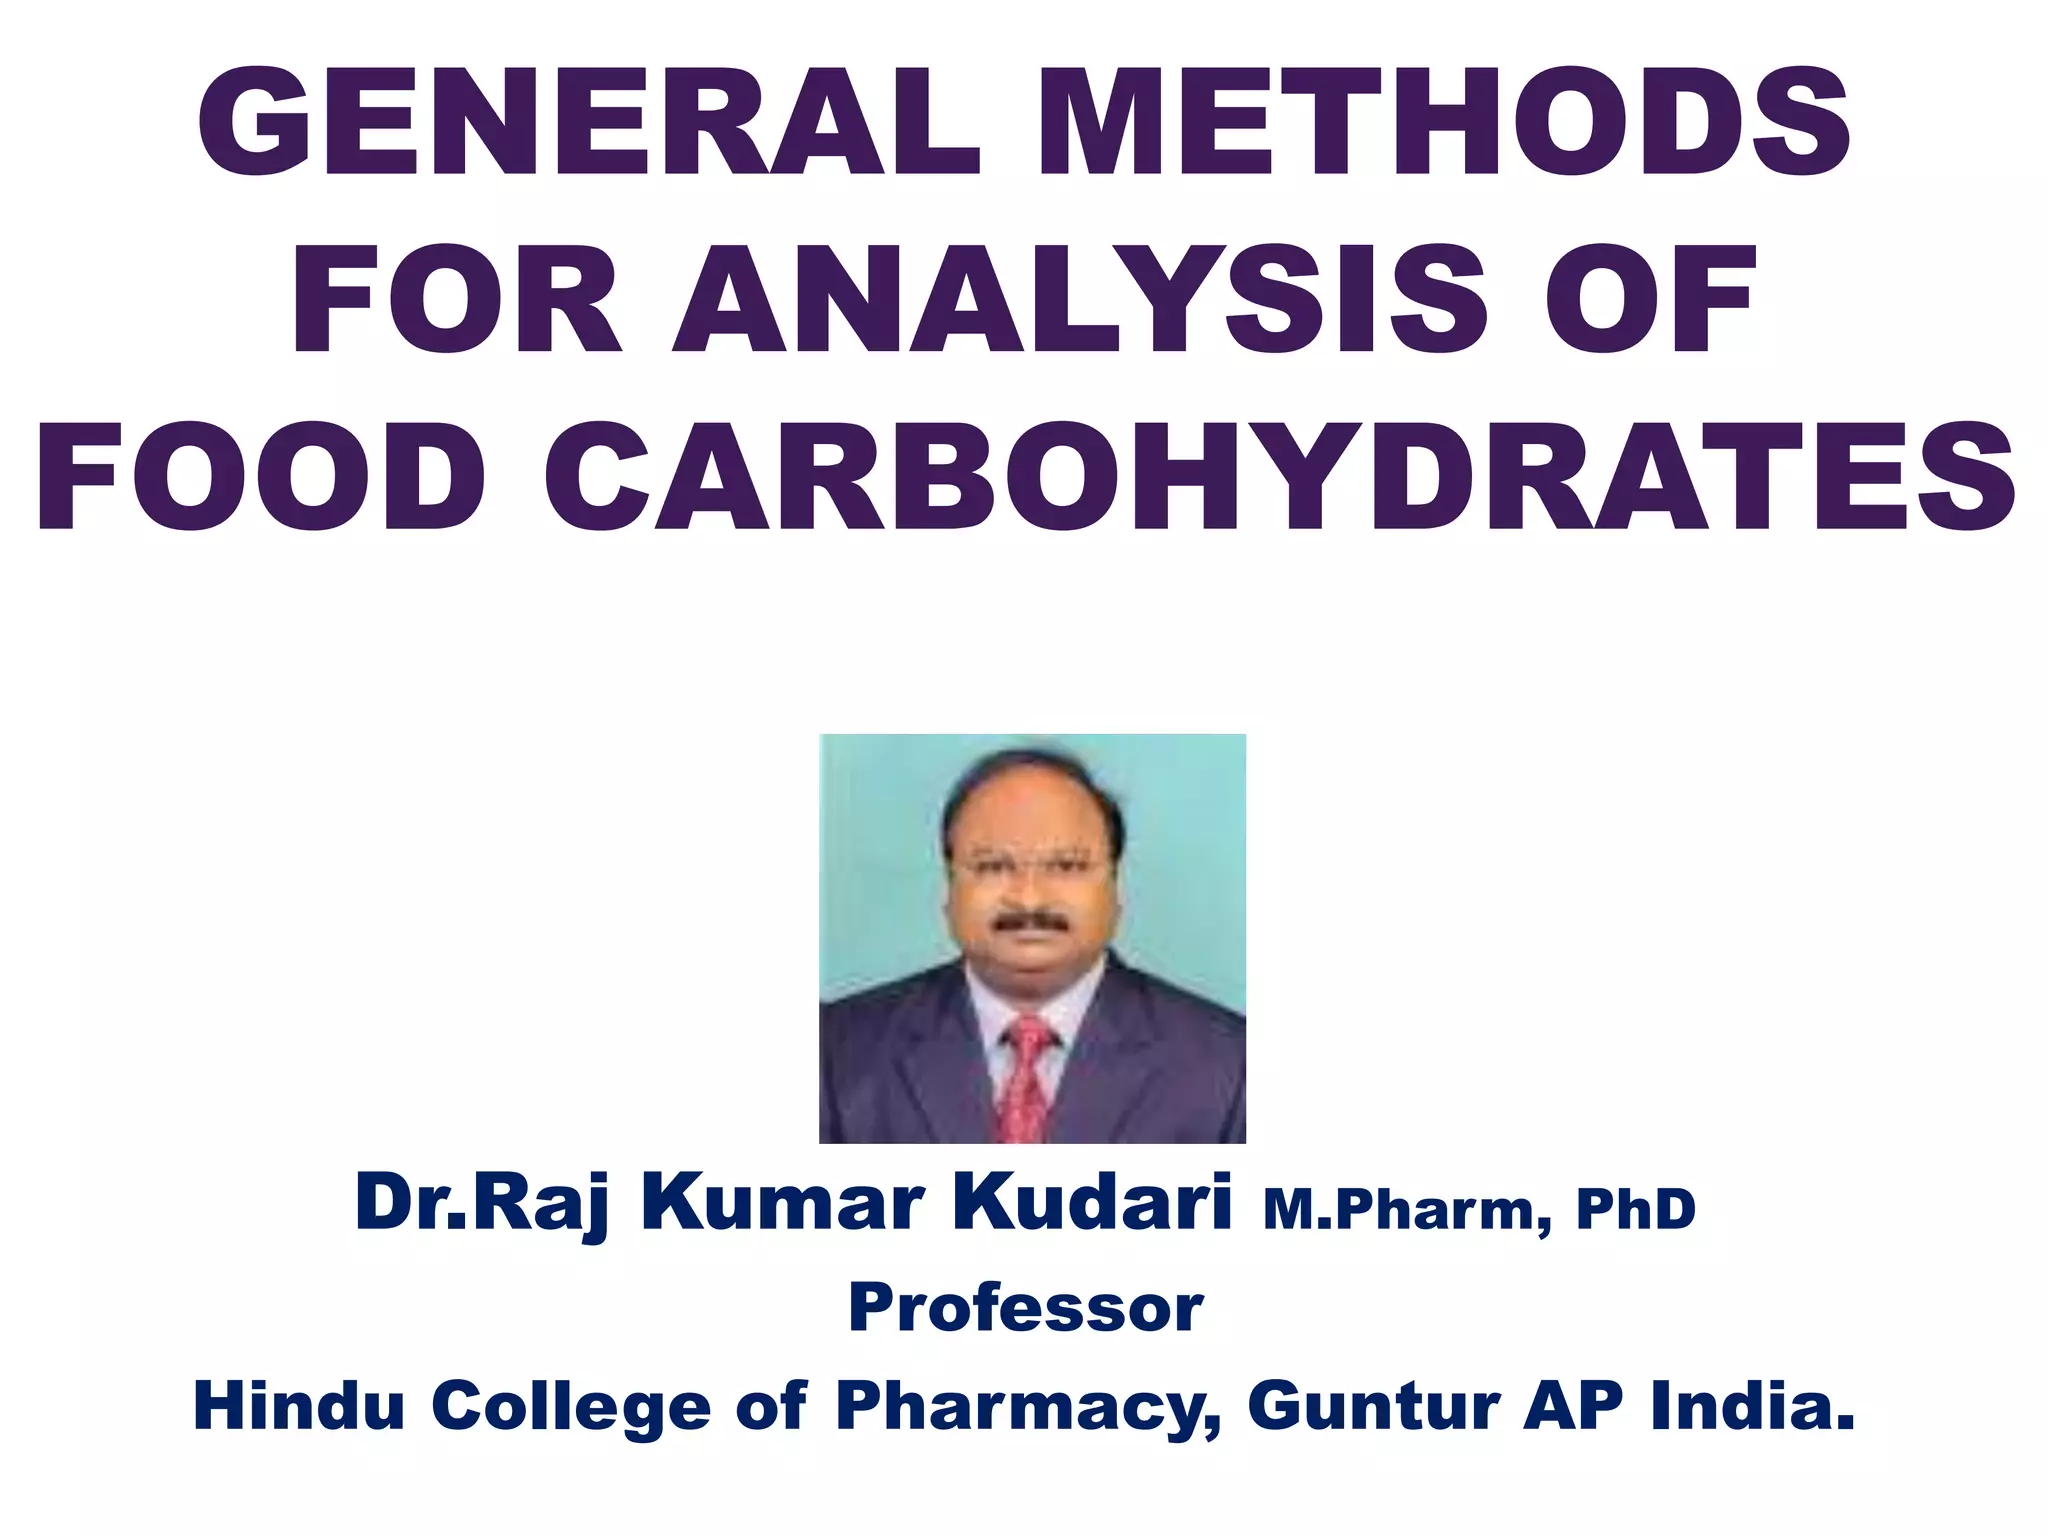
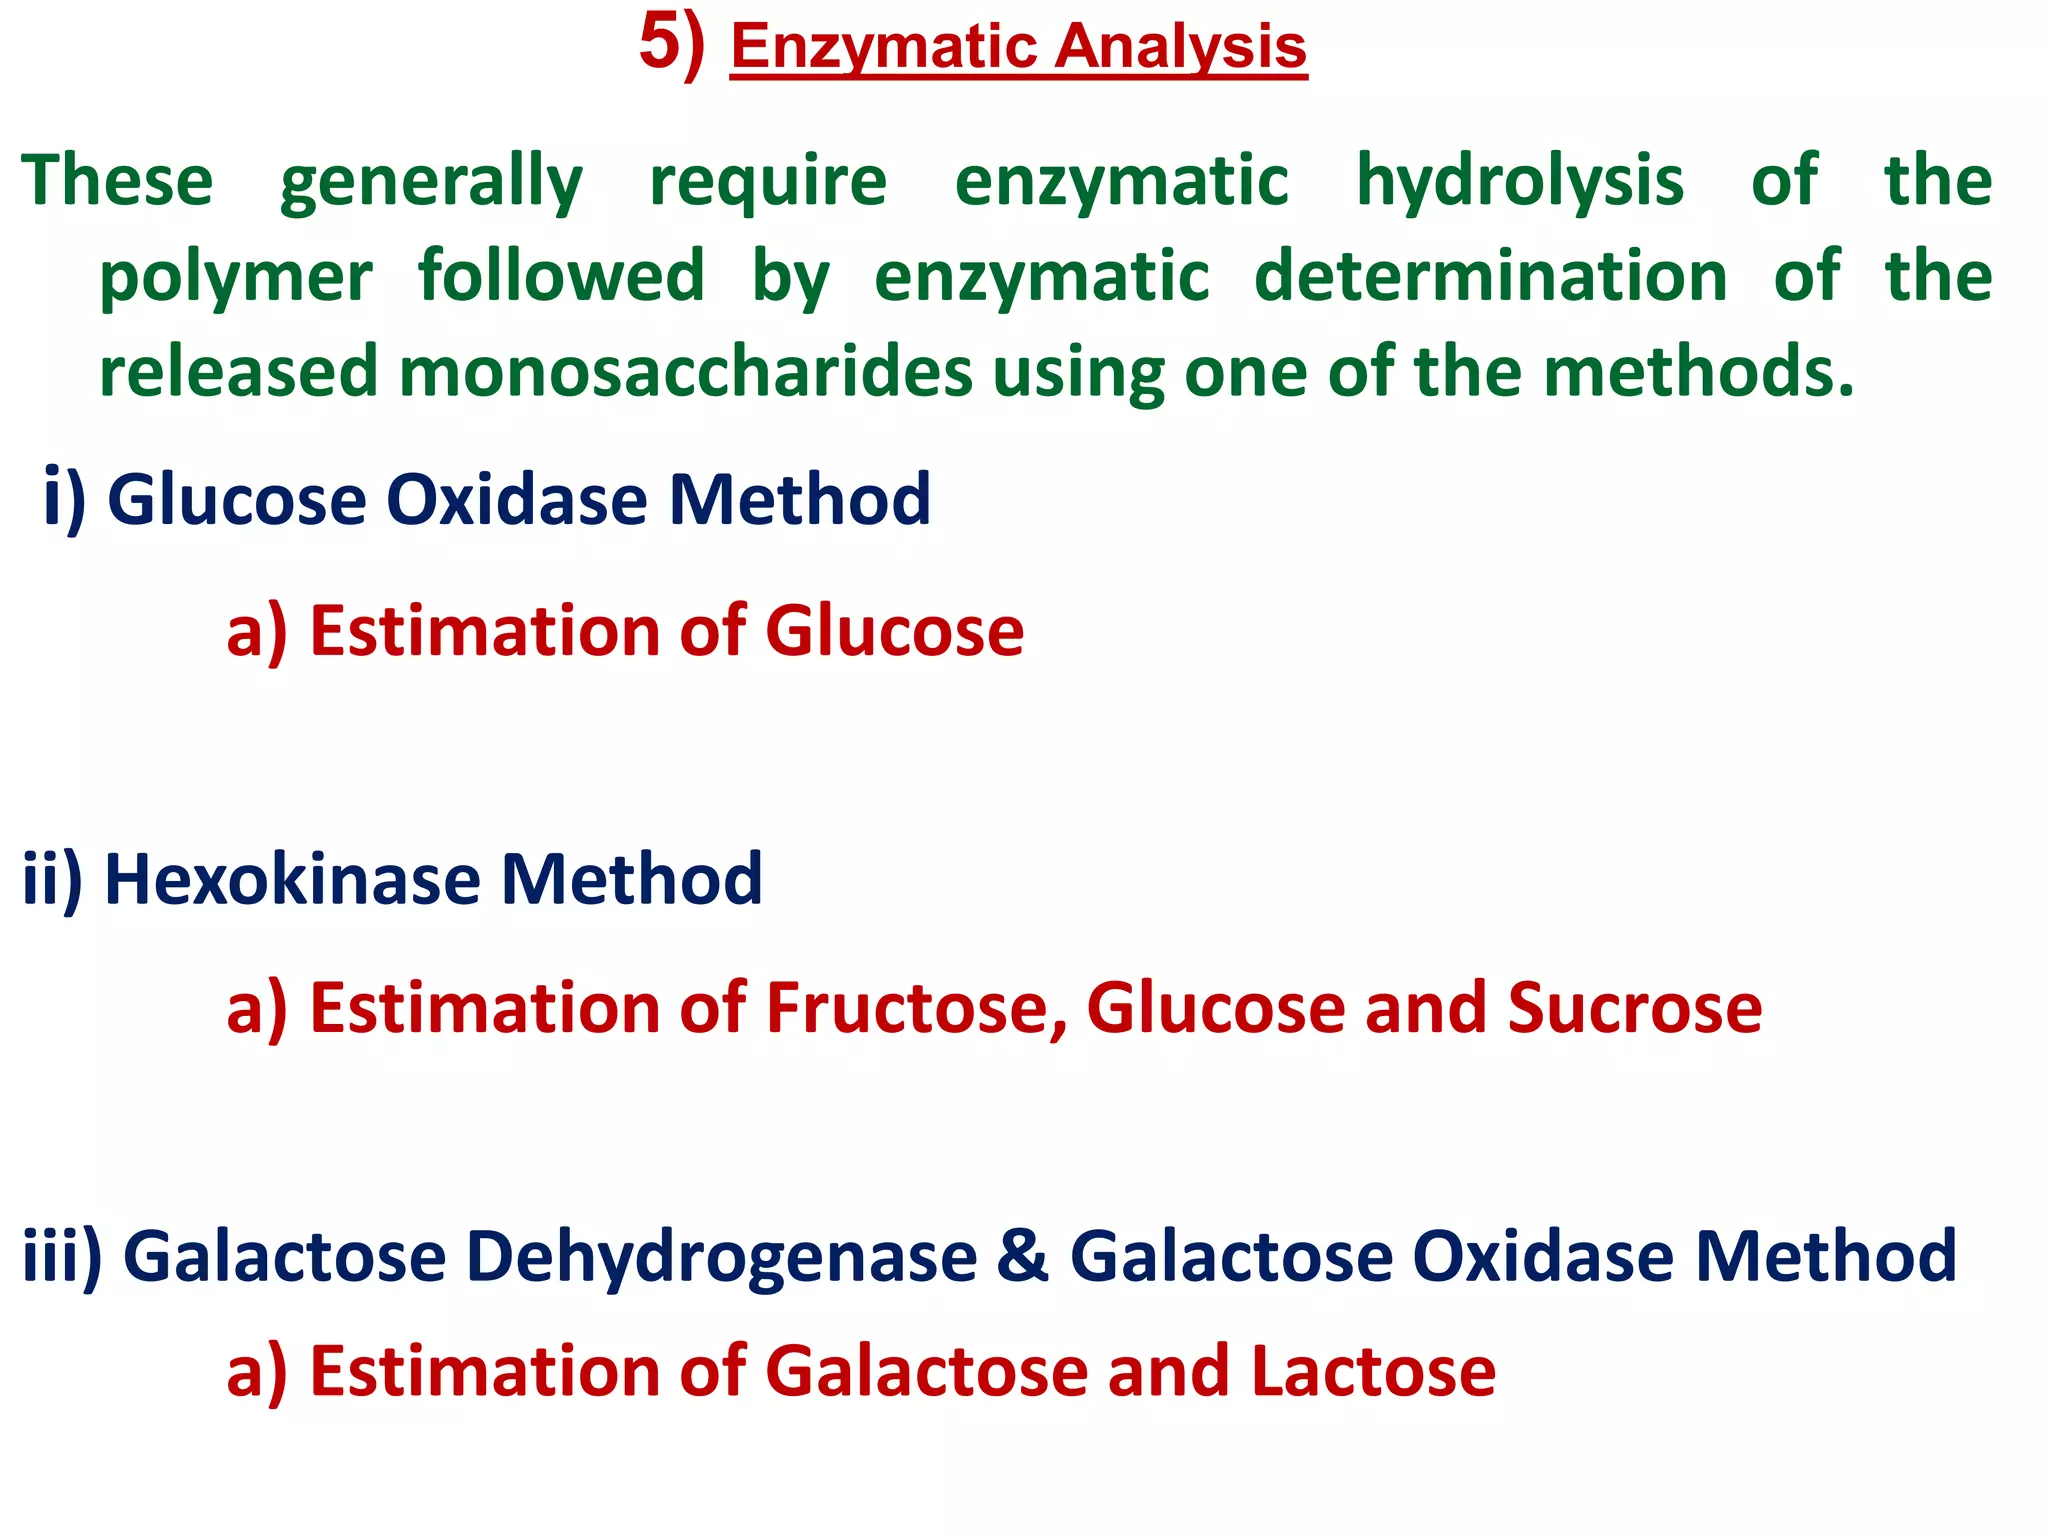
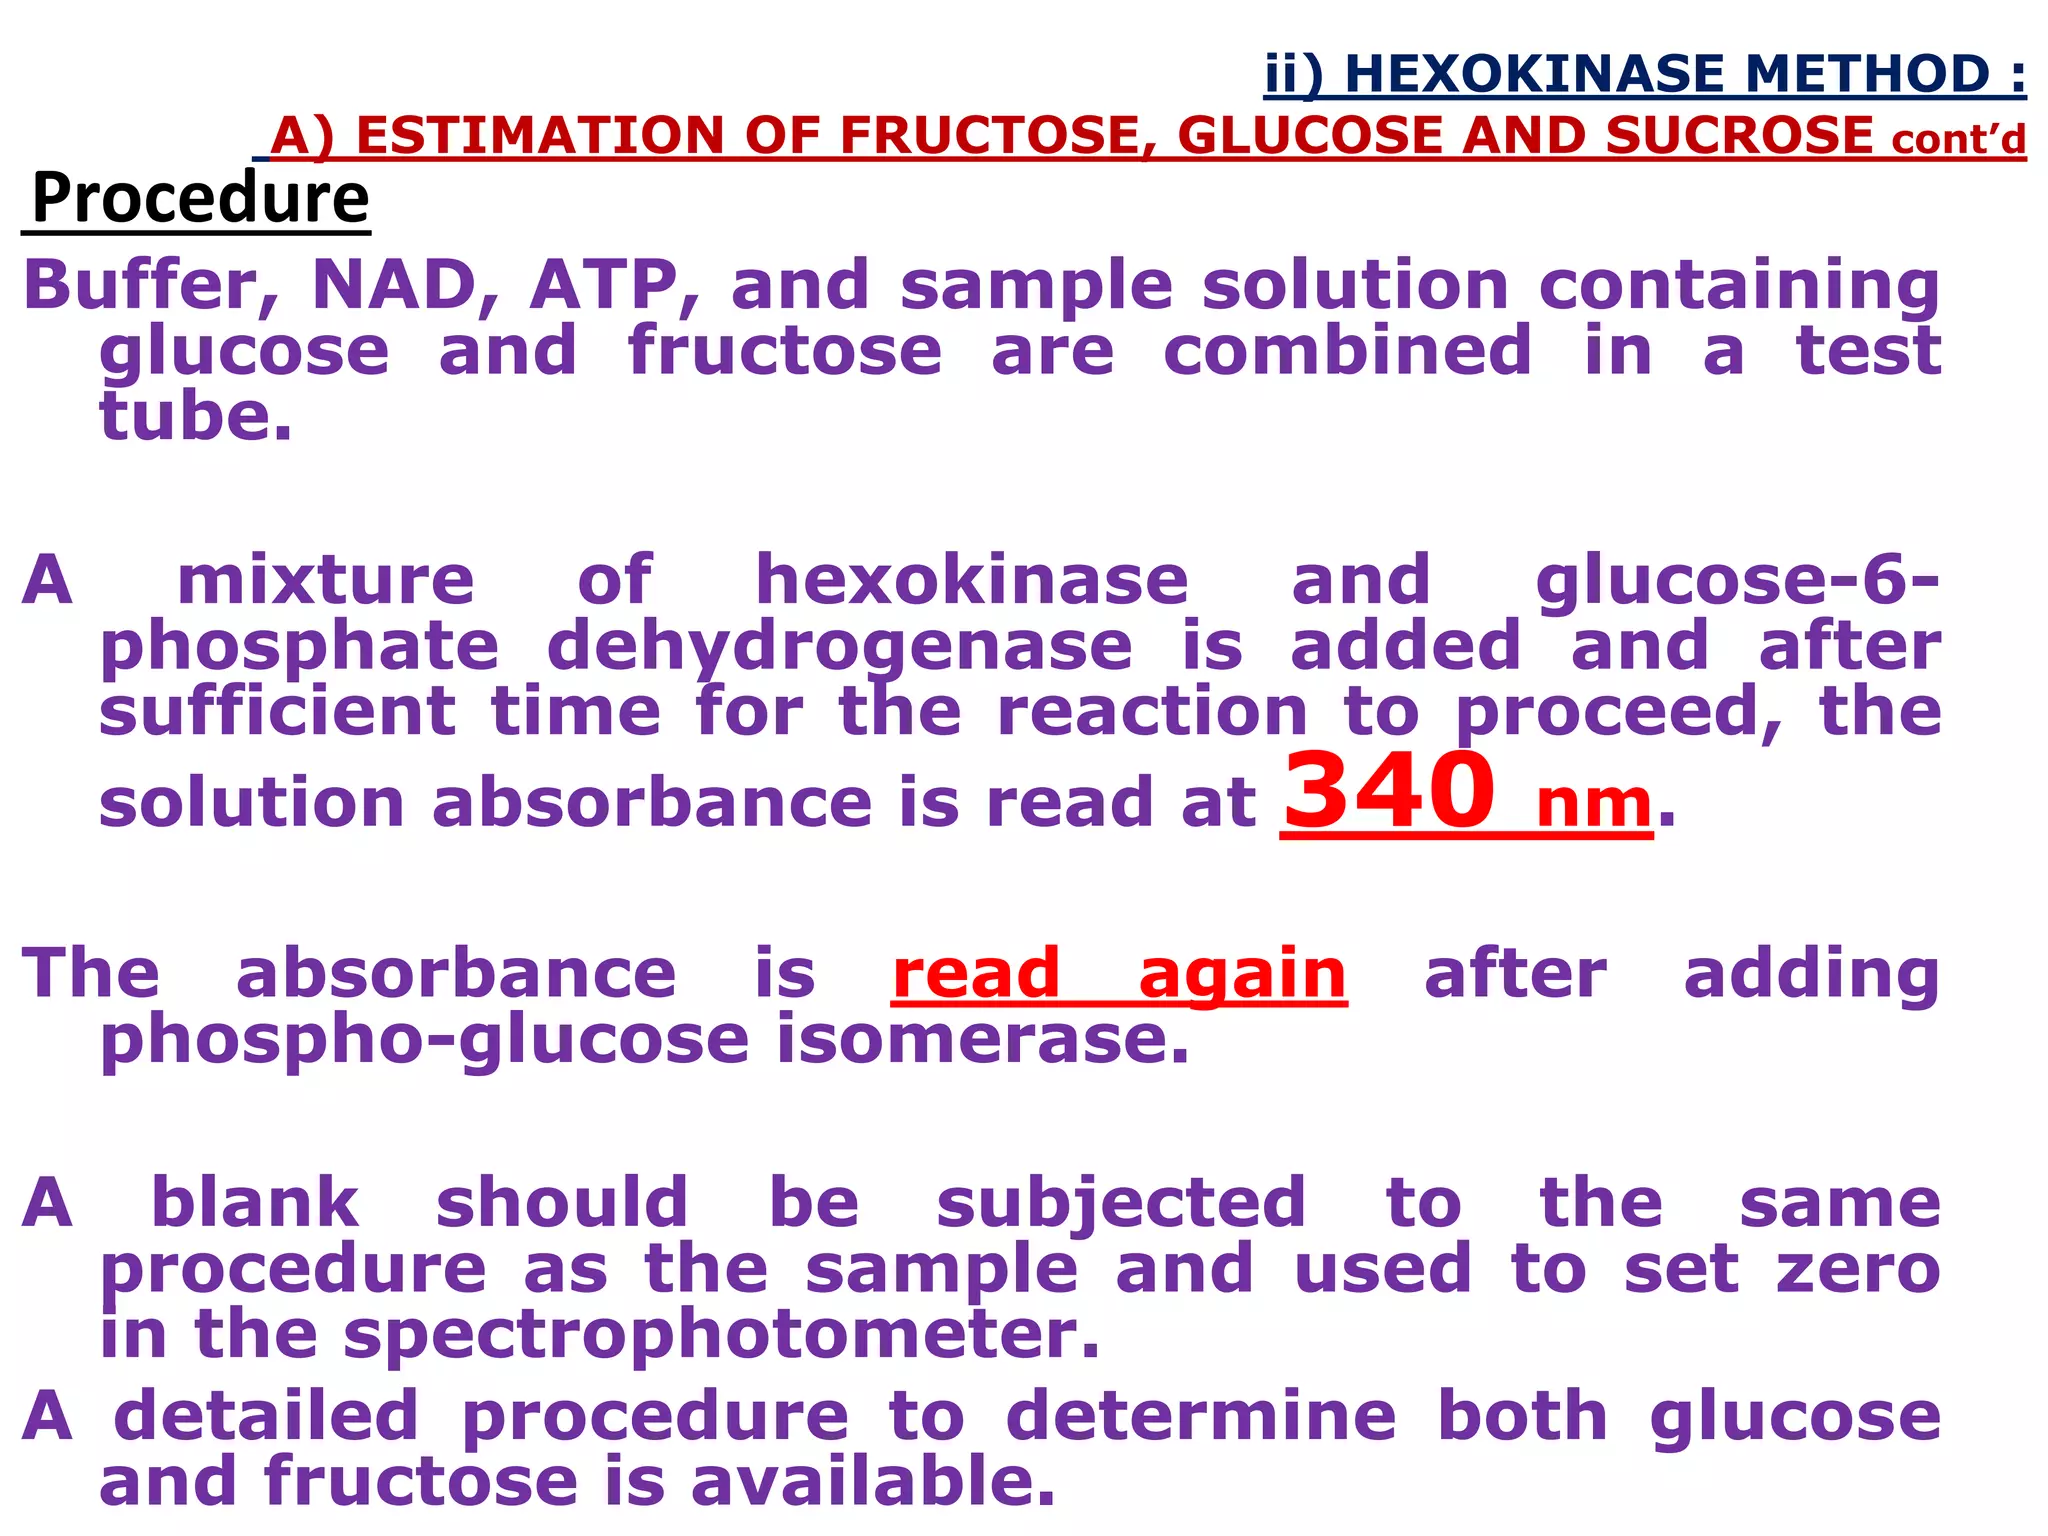
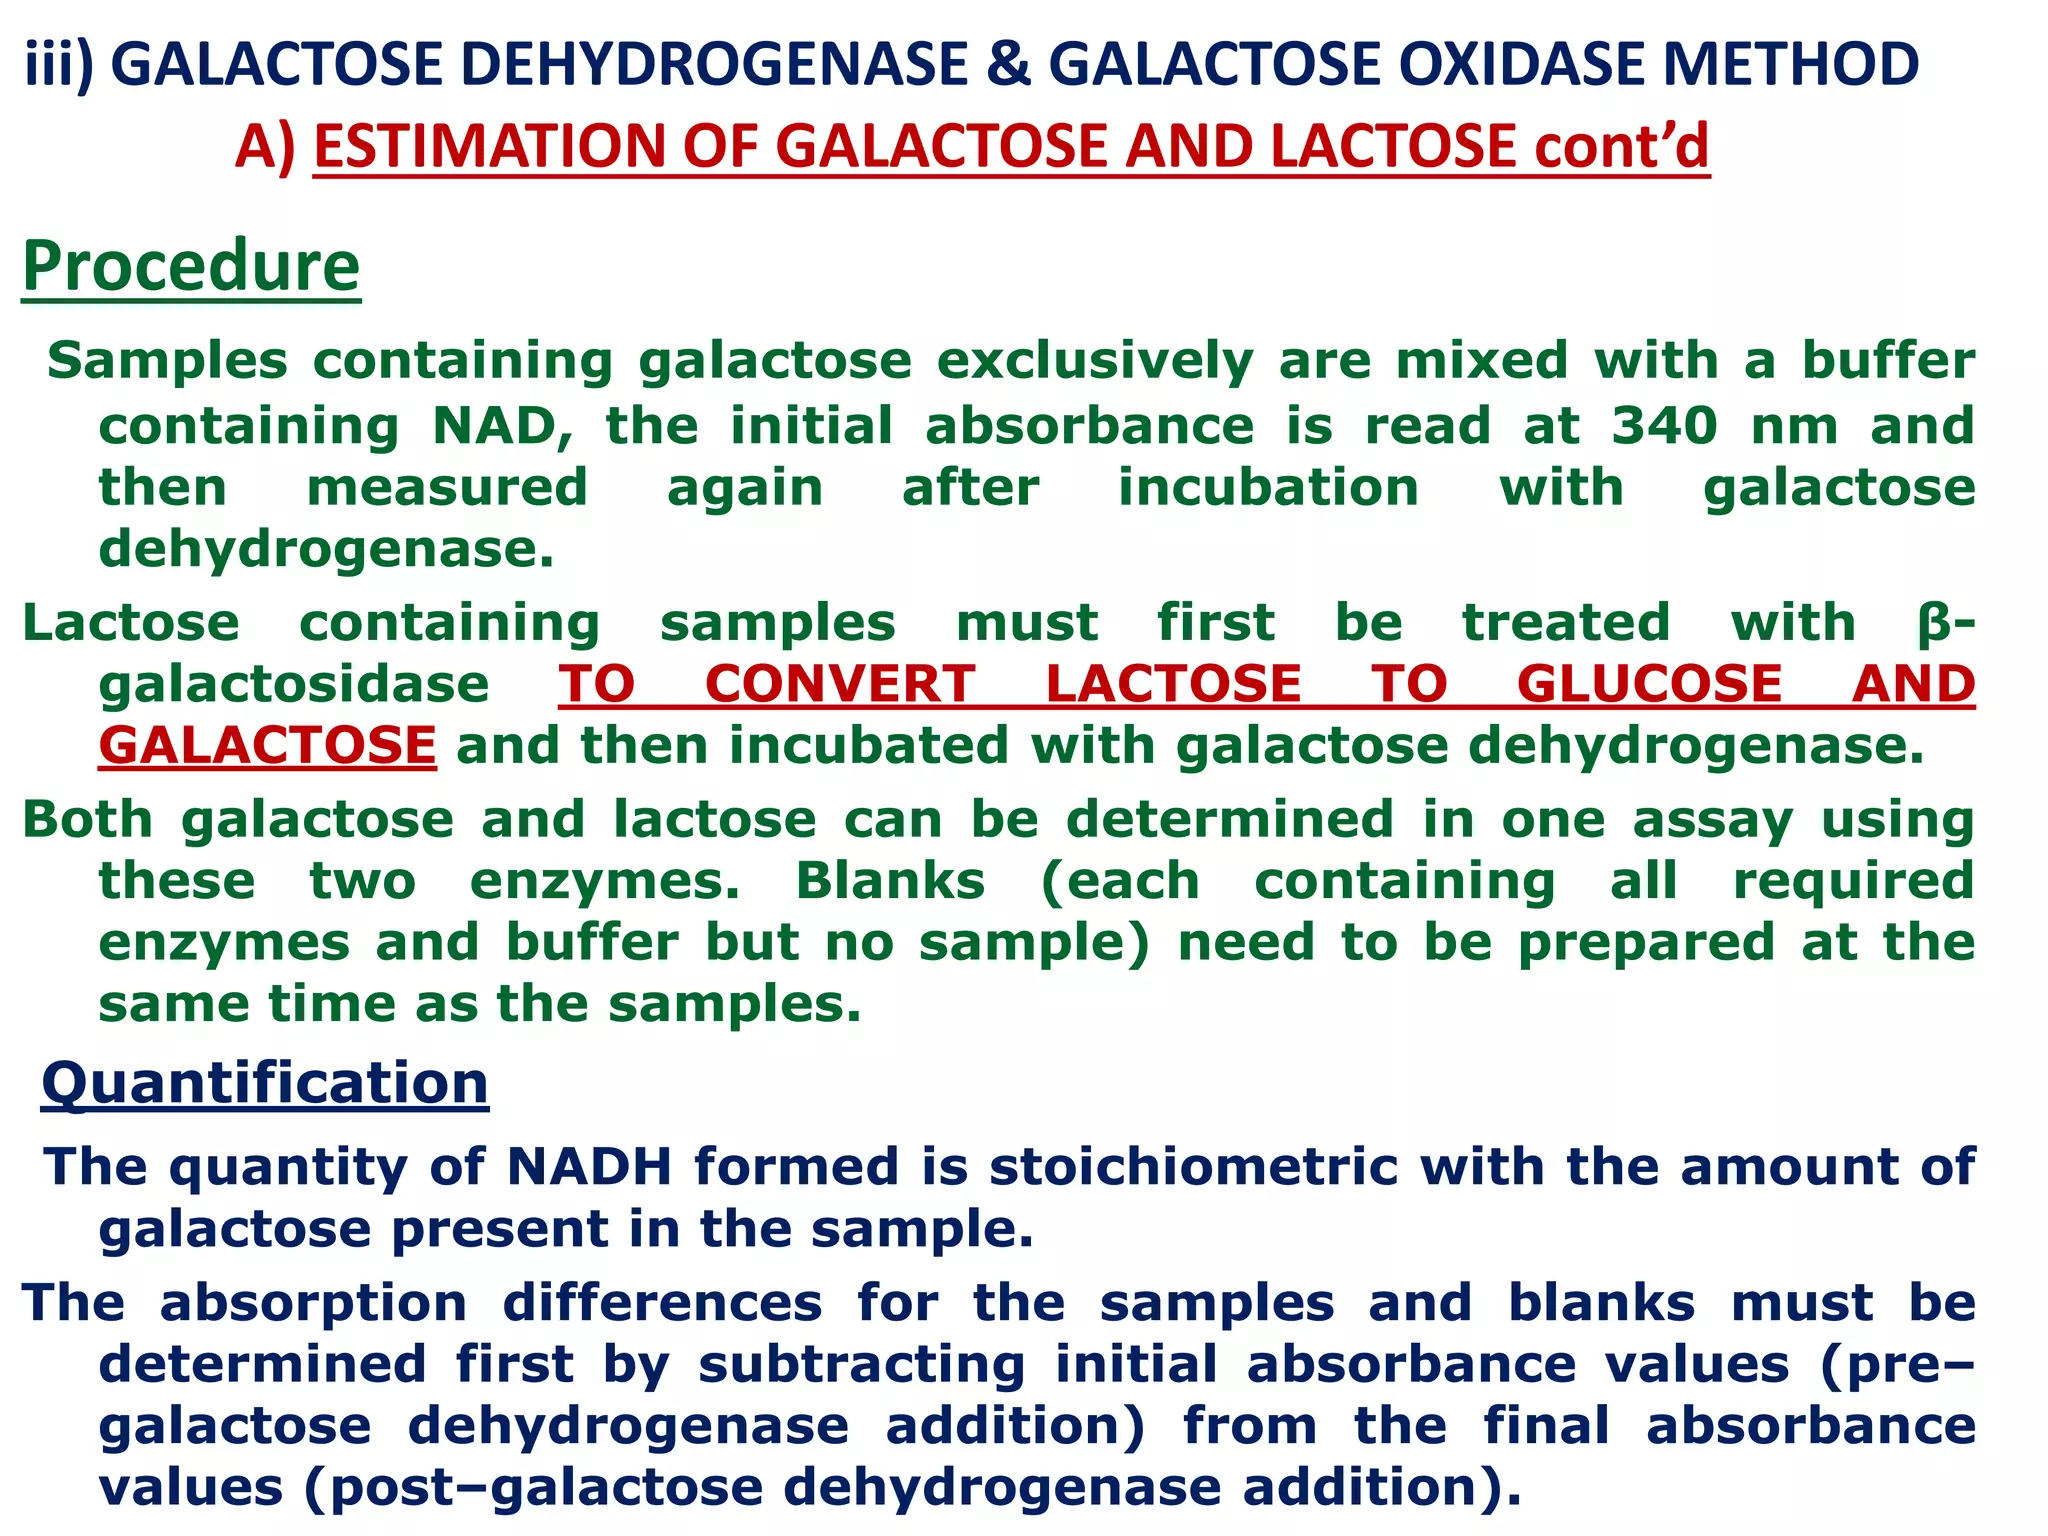
• β-D-Galactose -1- Phosphate β-D-Galactose
(catalyzed by Alkaline Phosphatase)
• β-D-Galactose + NAD+ + H2O D-Galactono [1,4] lactone + NADH+ +H+
(catalyzed by Galactose dehydrogenase)
MEASURED UV INTENSITY AT 340 NM
• NADH+ + Color reagent (bright yellow) Color Reagent (blue/violet) + NAD
(catalyzed by Diaphorase)
MEASURED COLOR INTENSITY AT 550 NM](https://image.slidesharecdn.com/generalmethodsforanalysisoffoodcarbohydrates-200224104841/75/General-methods-for-analysis-of-food-carbohydrates-72-2048.jpg)
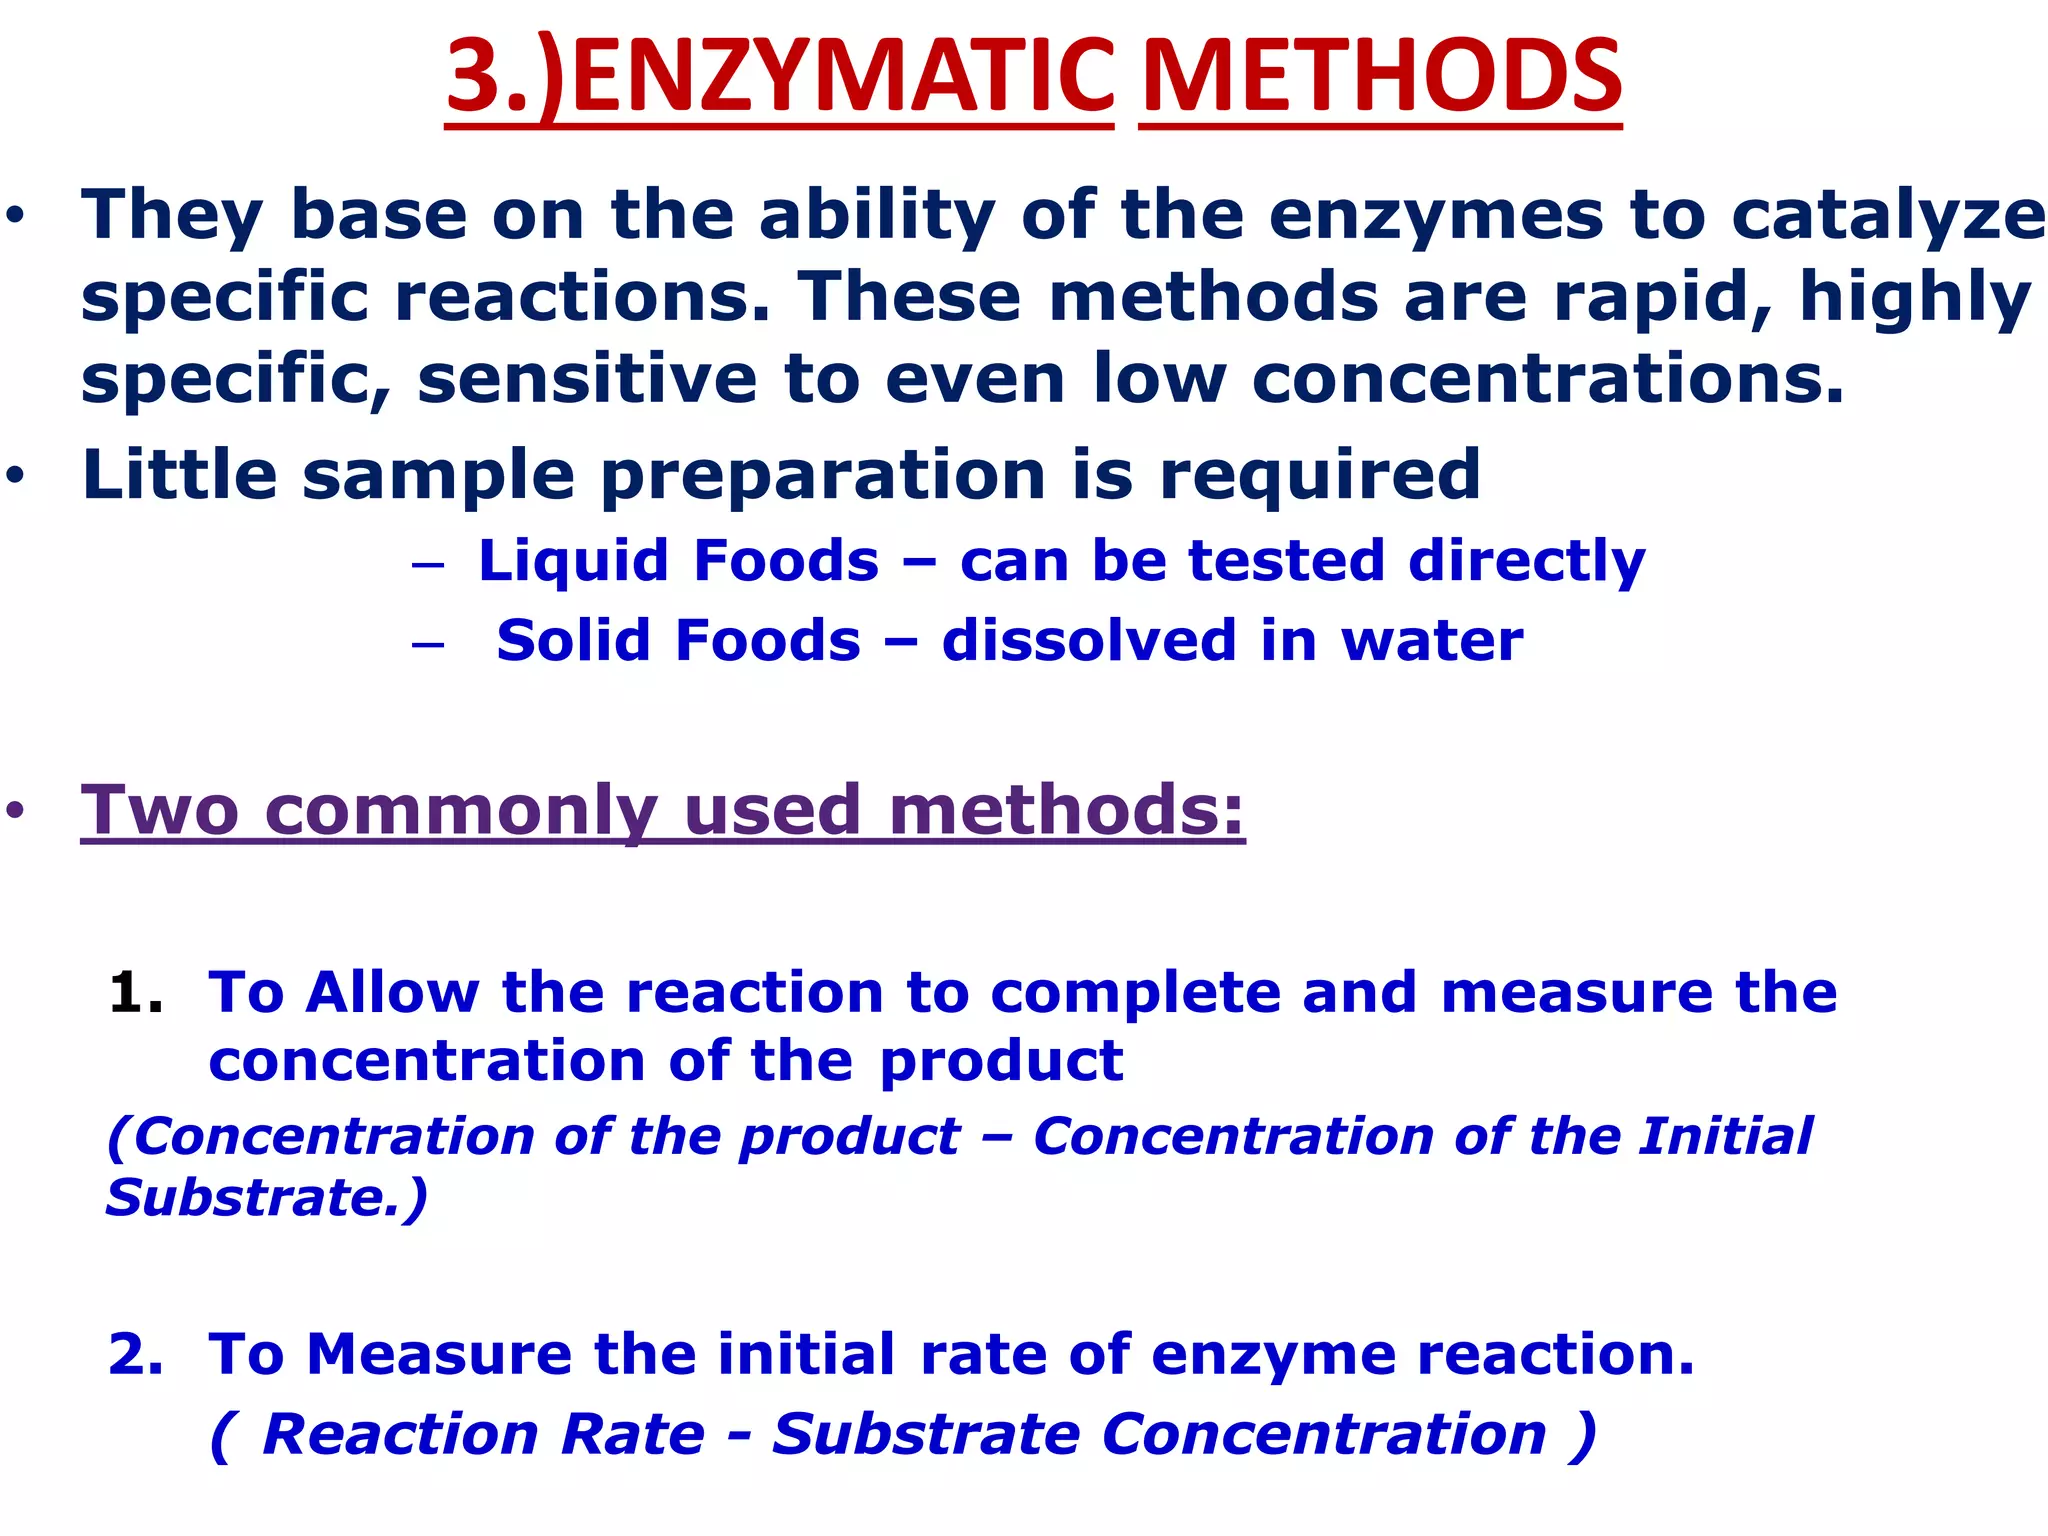
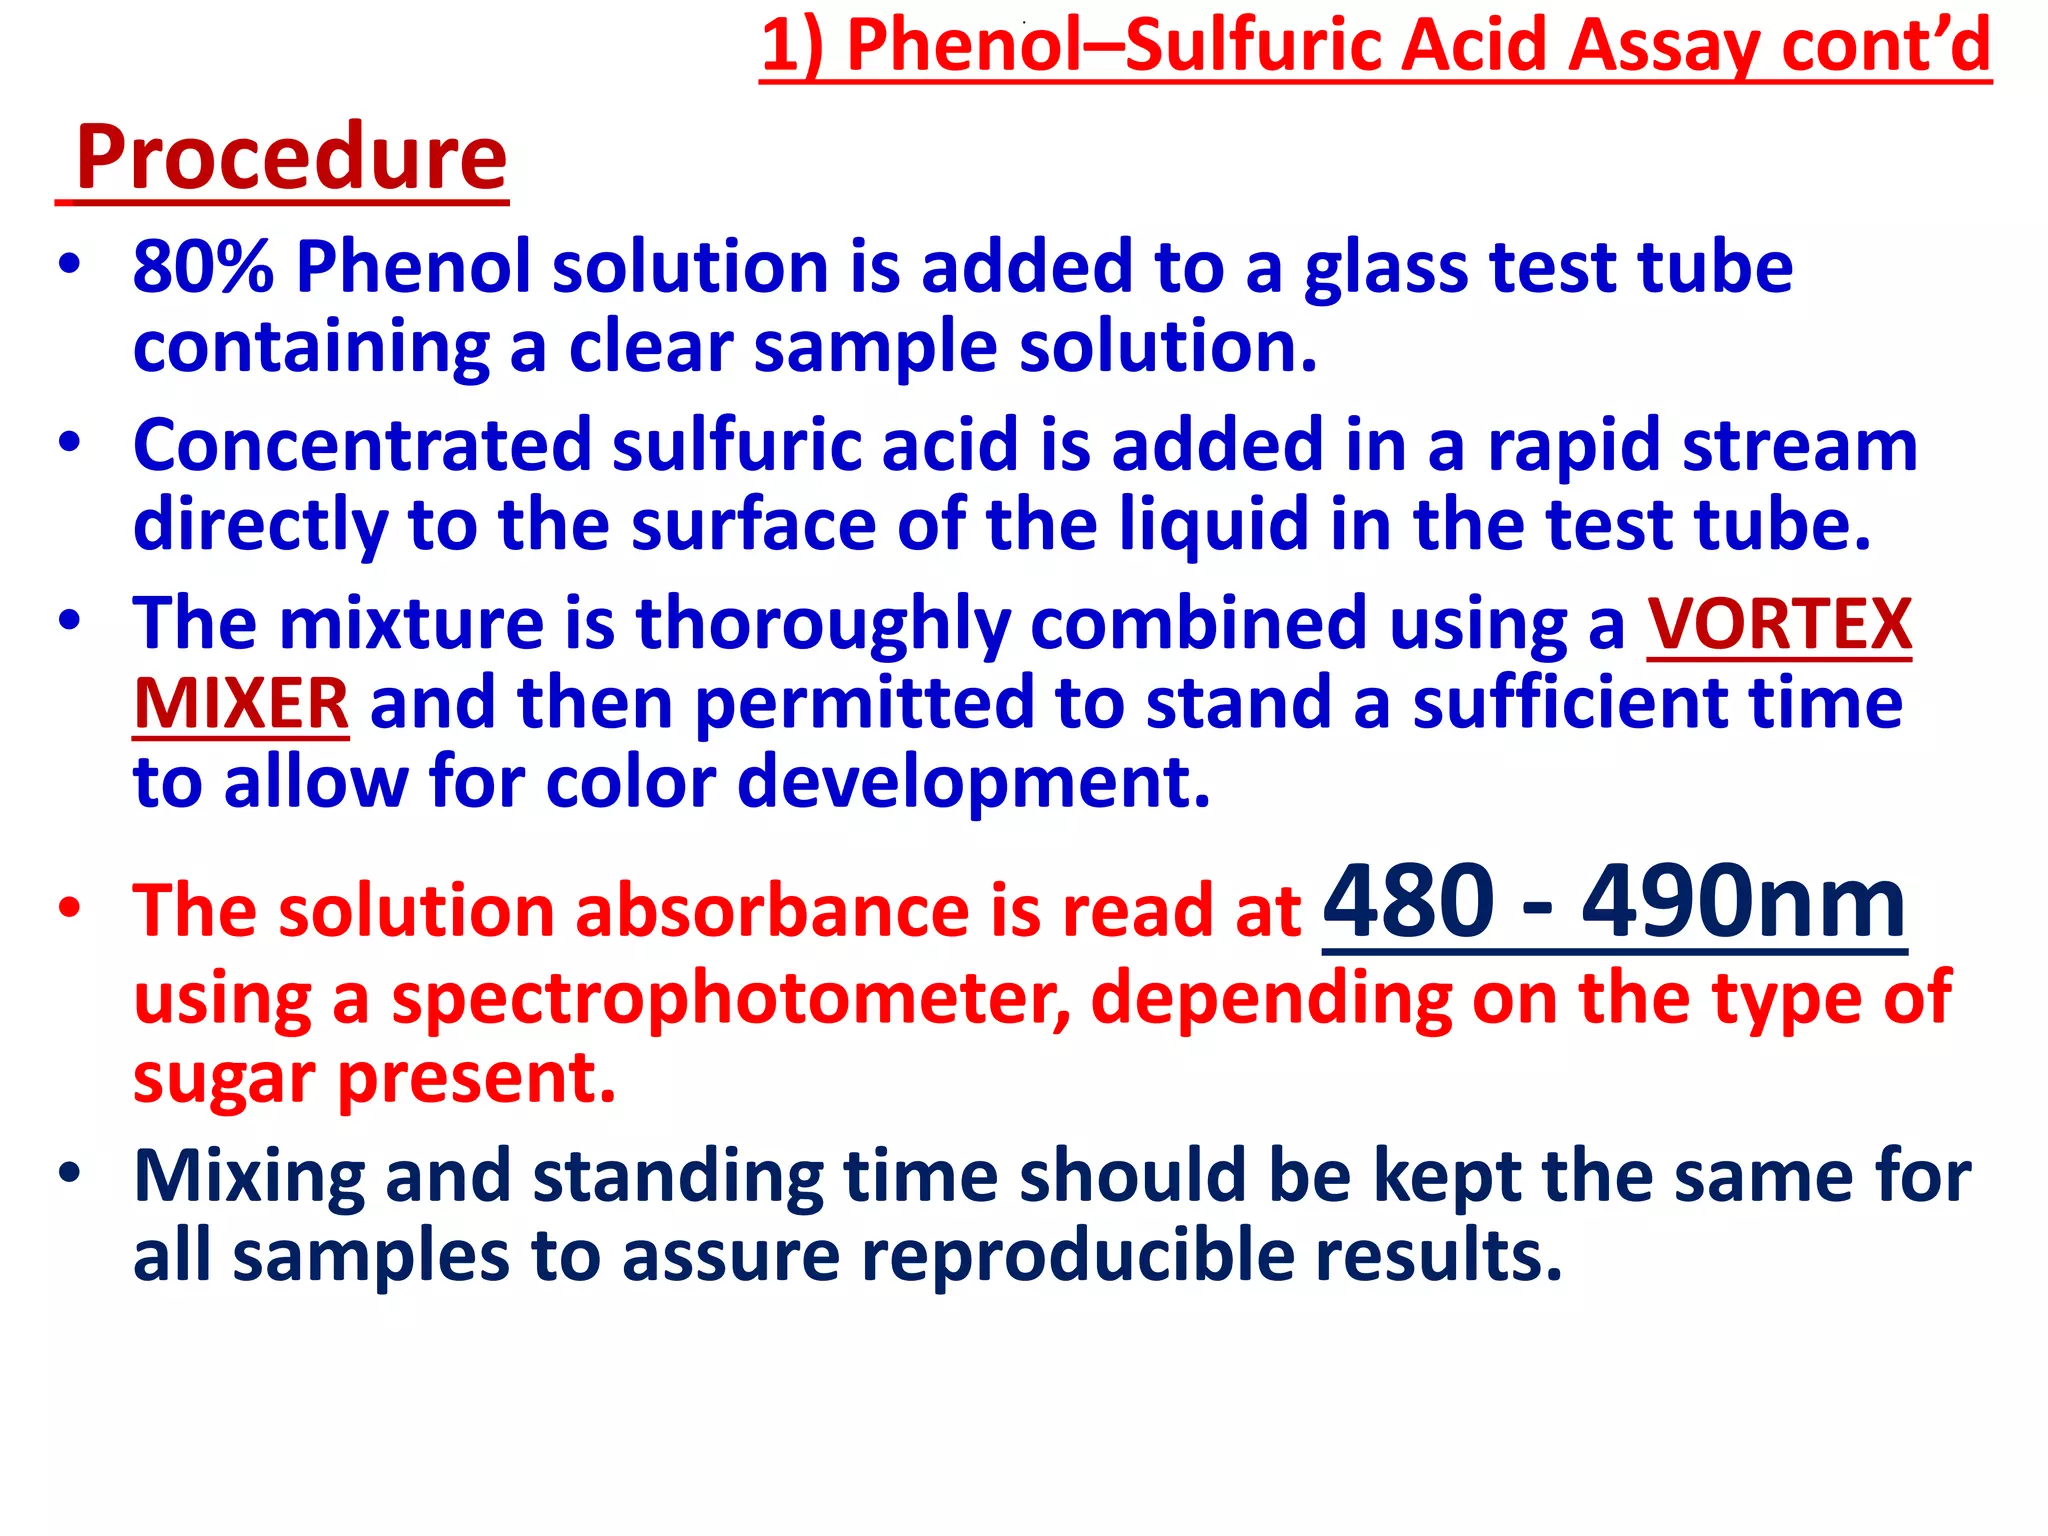
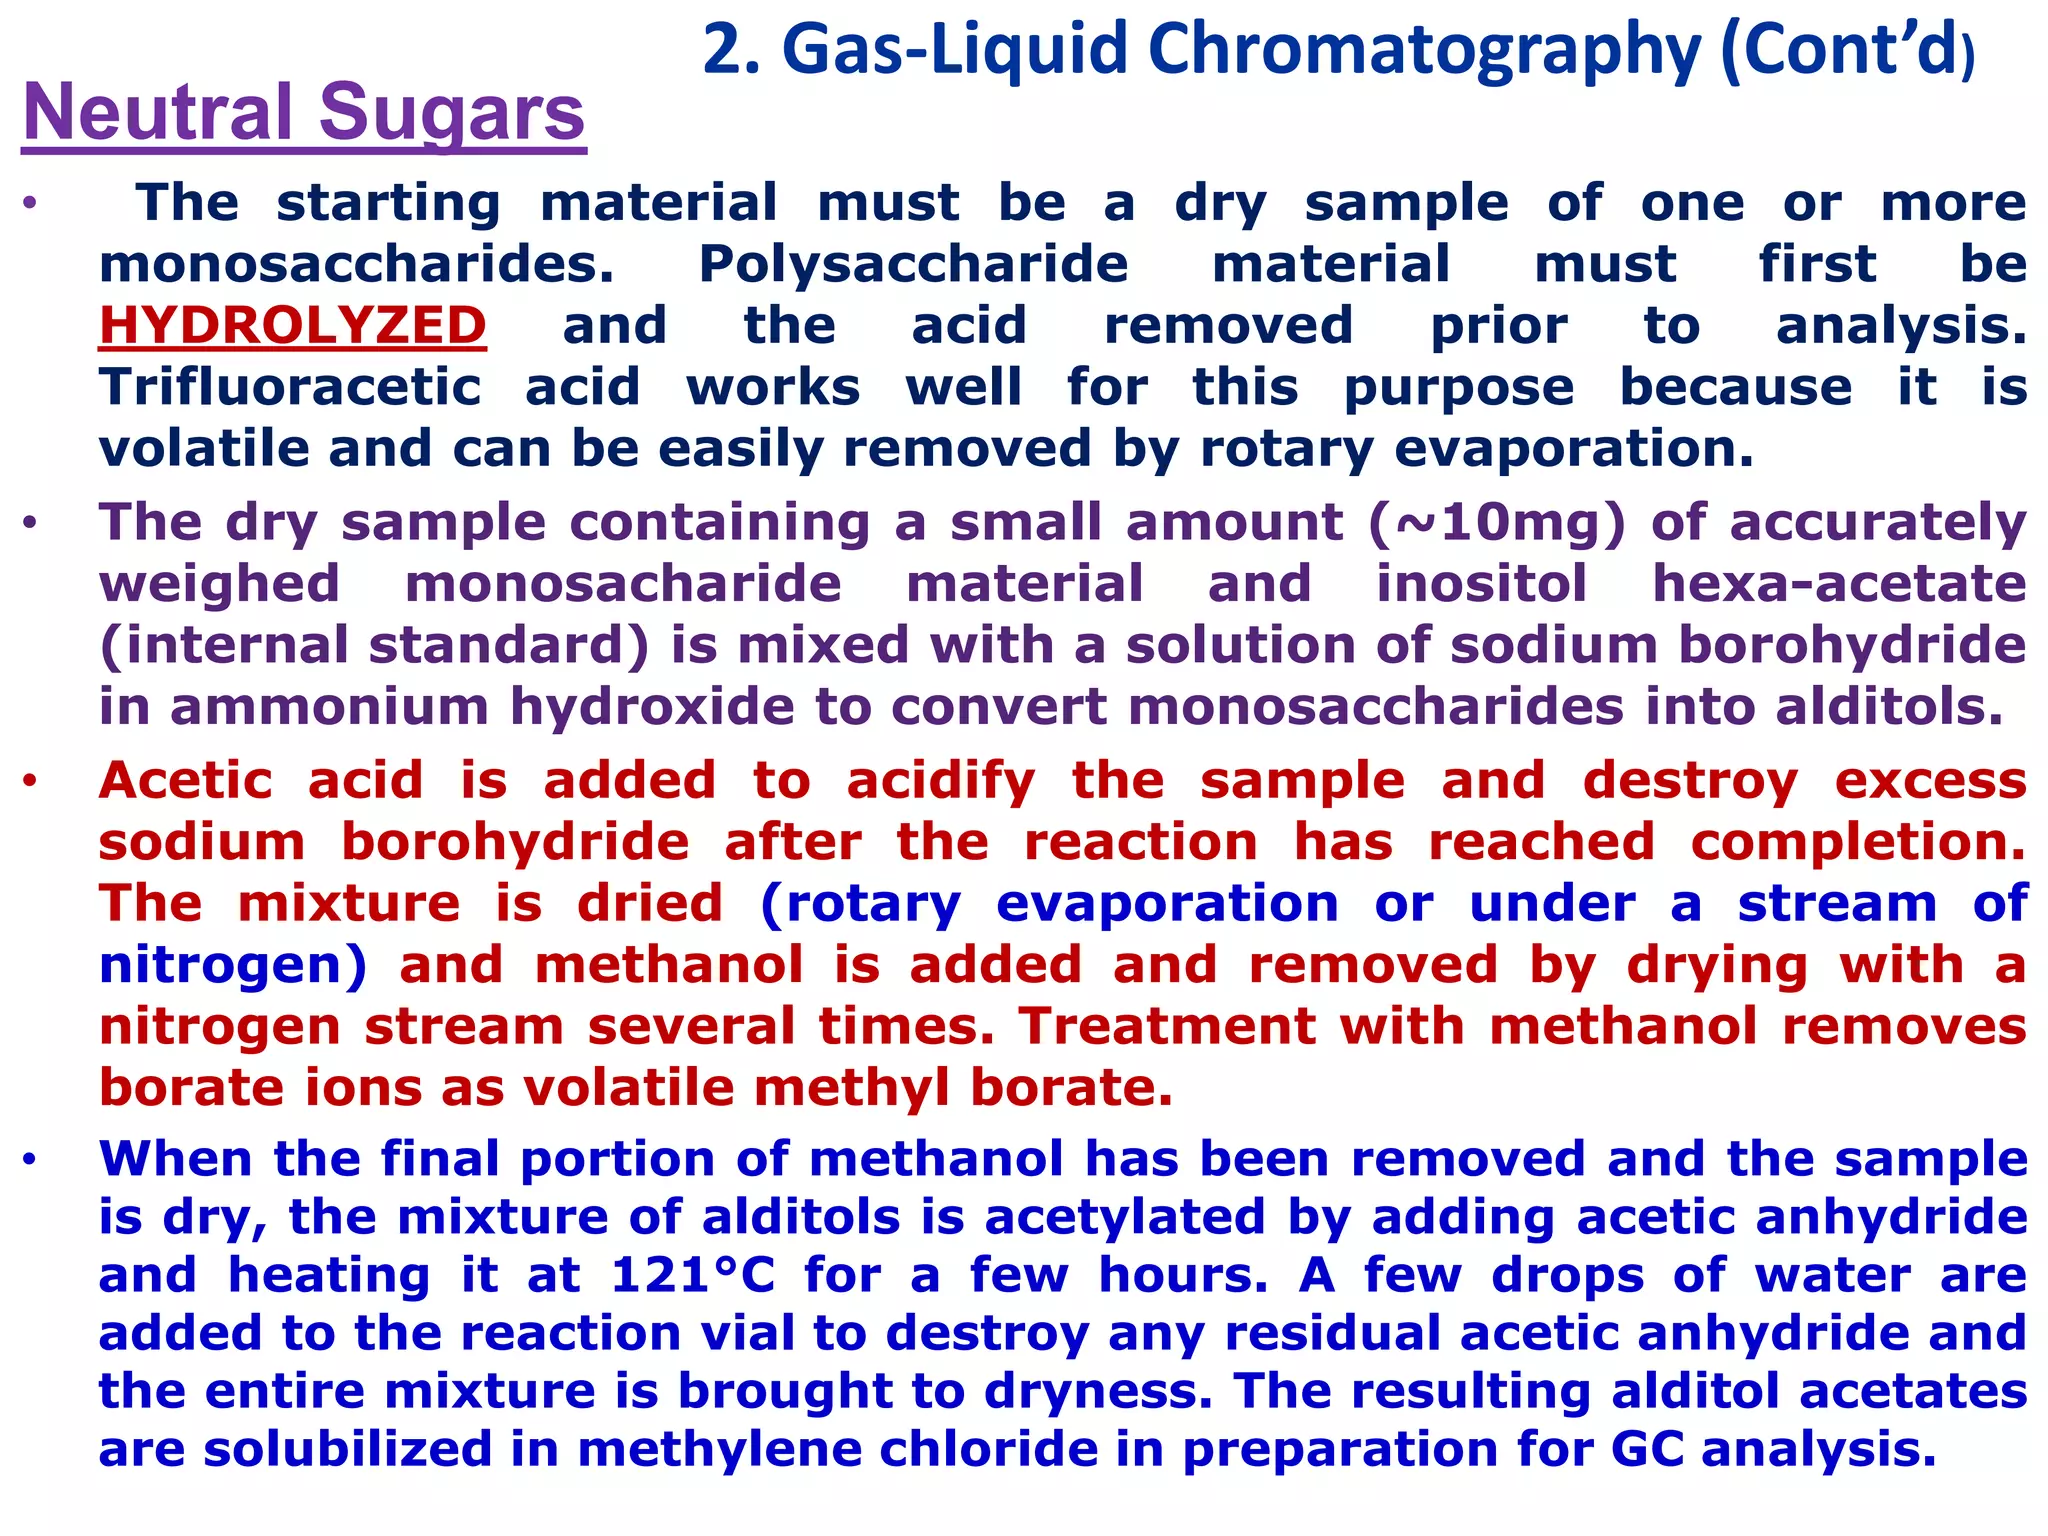
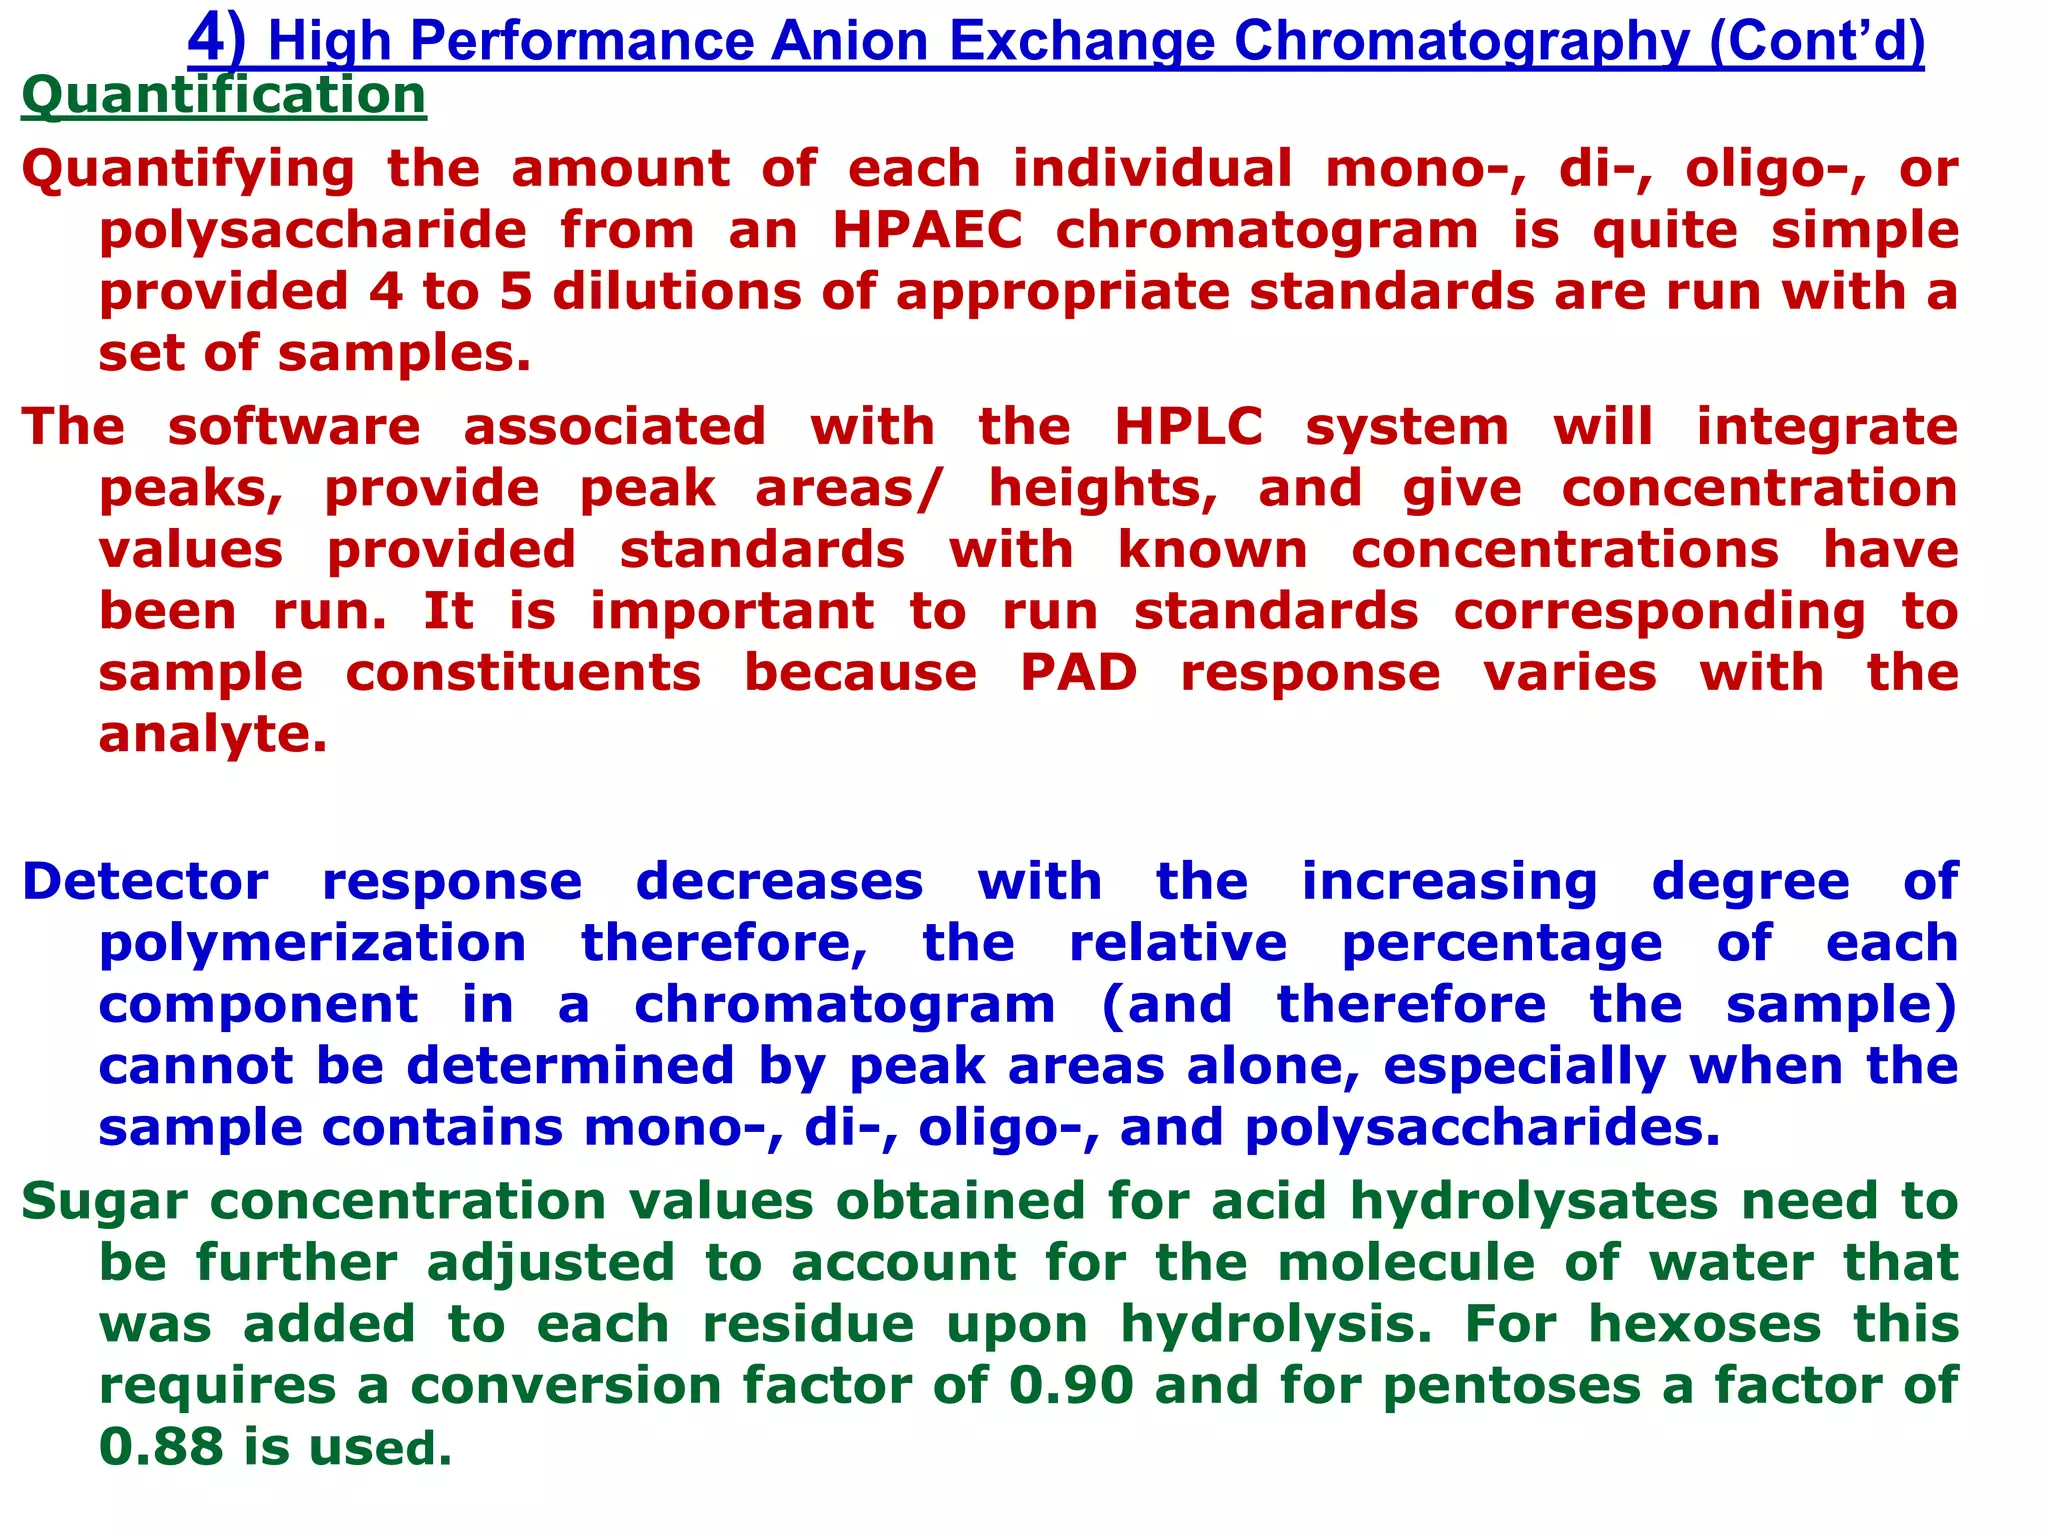
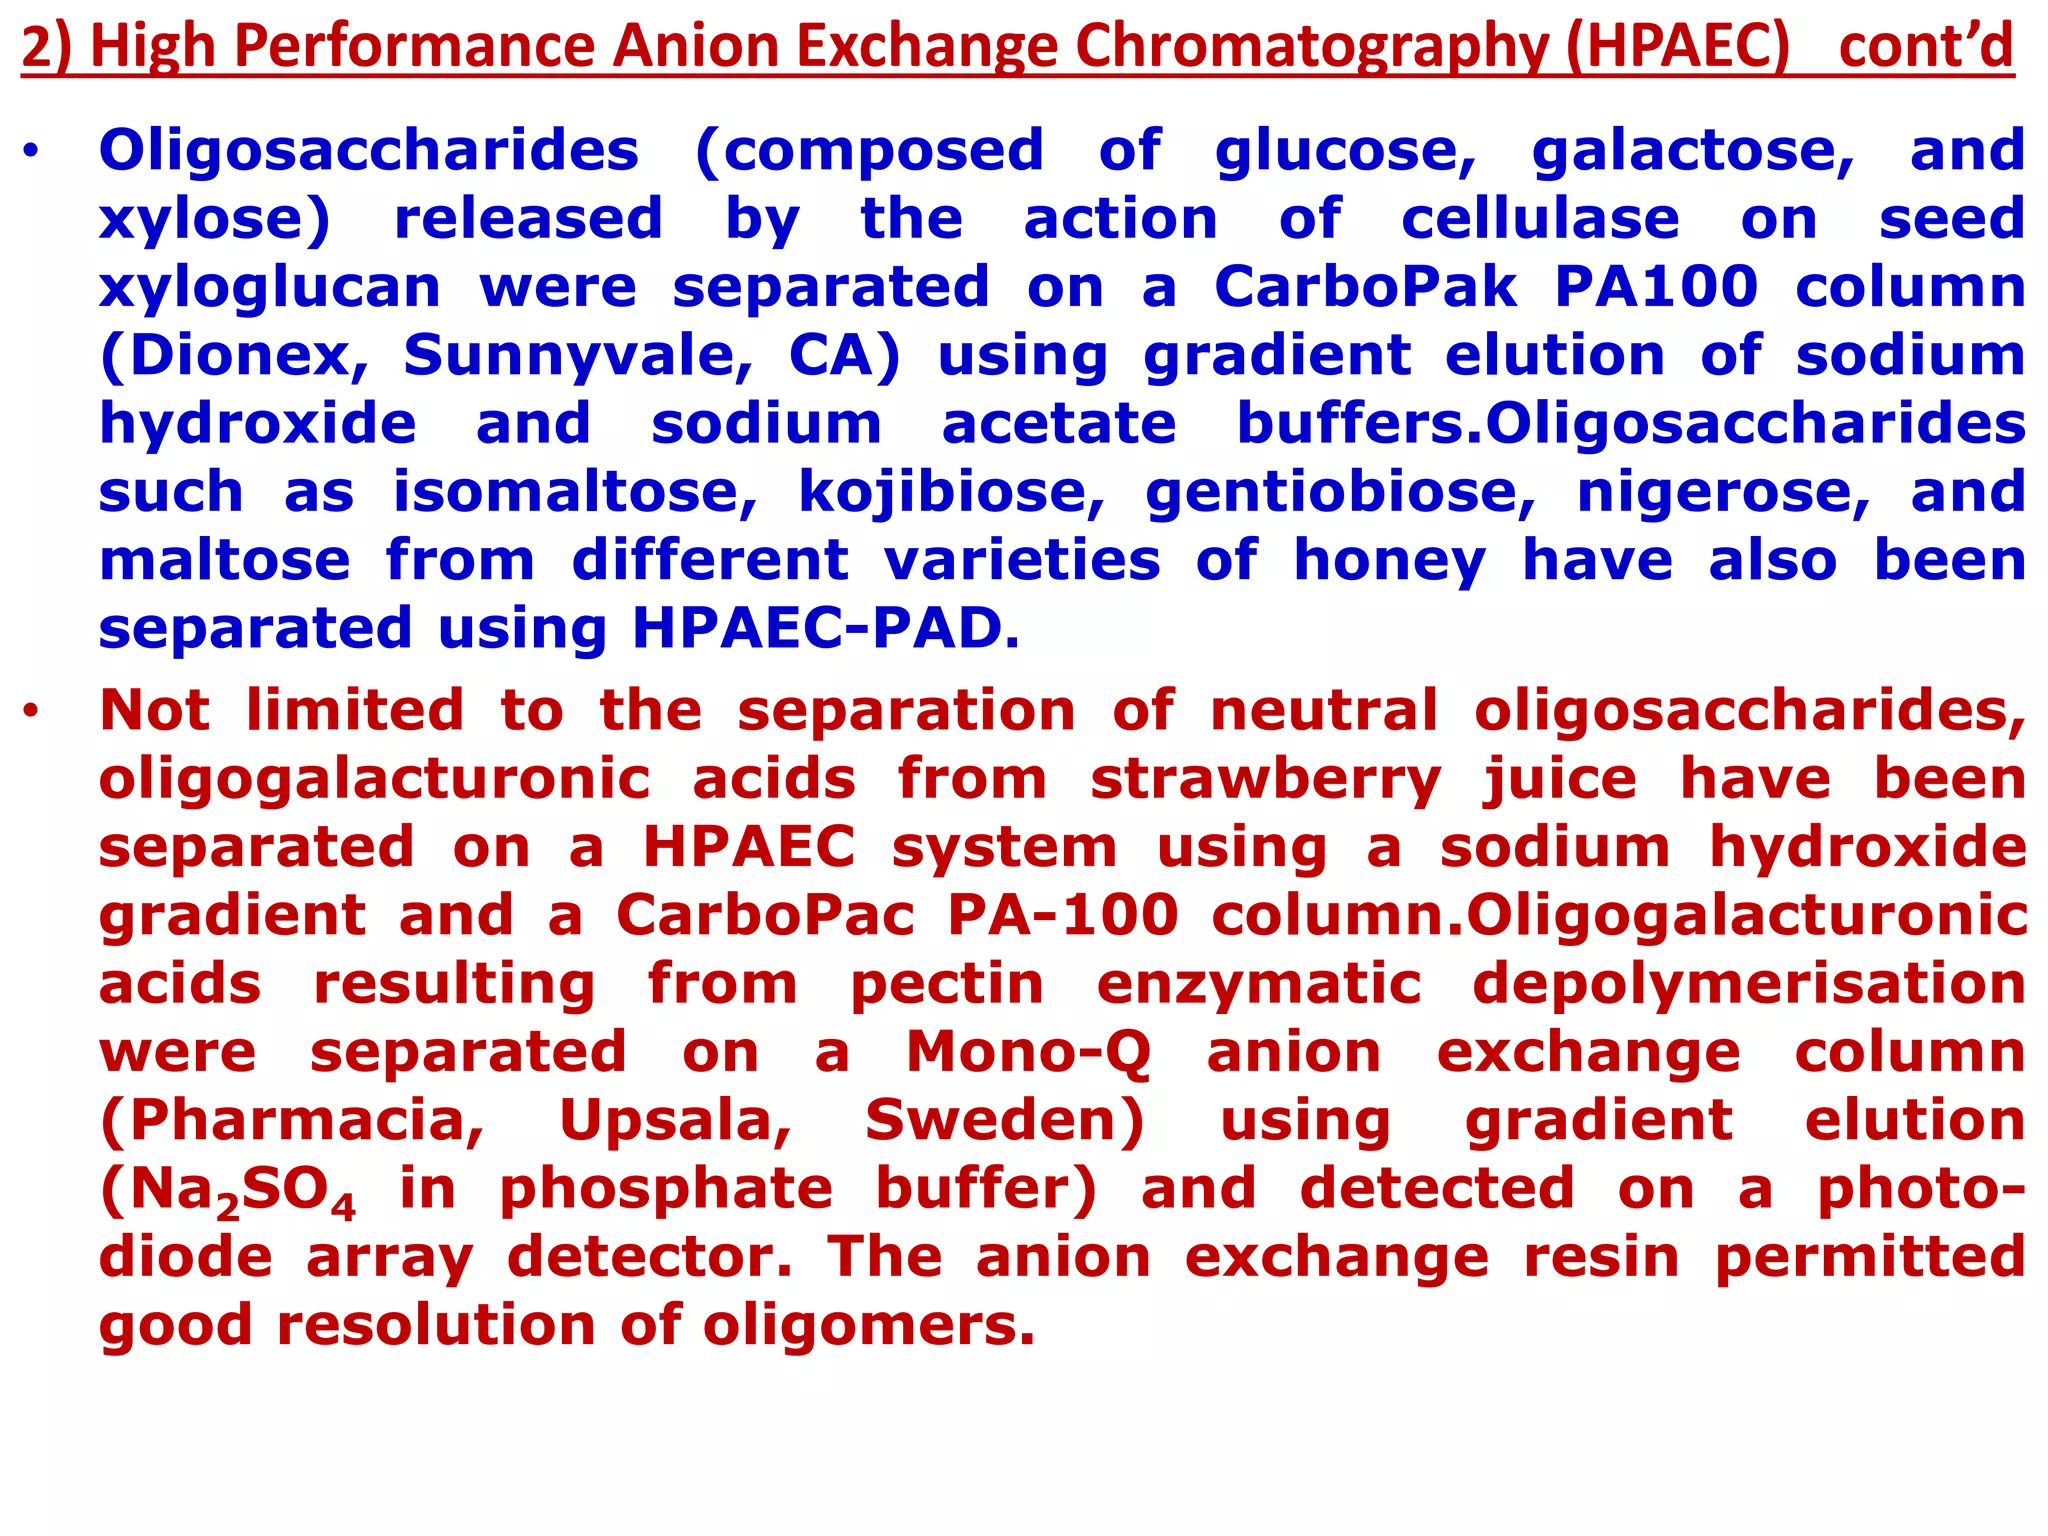
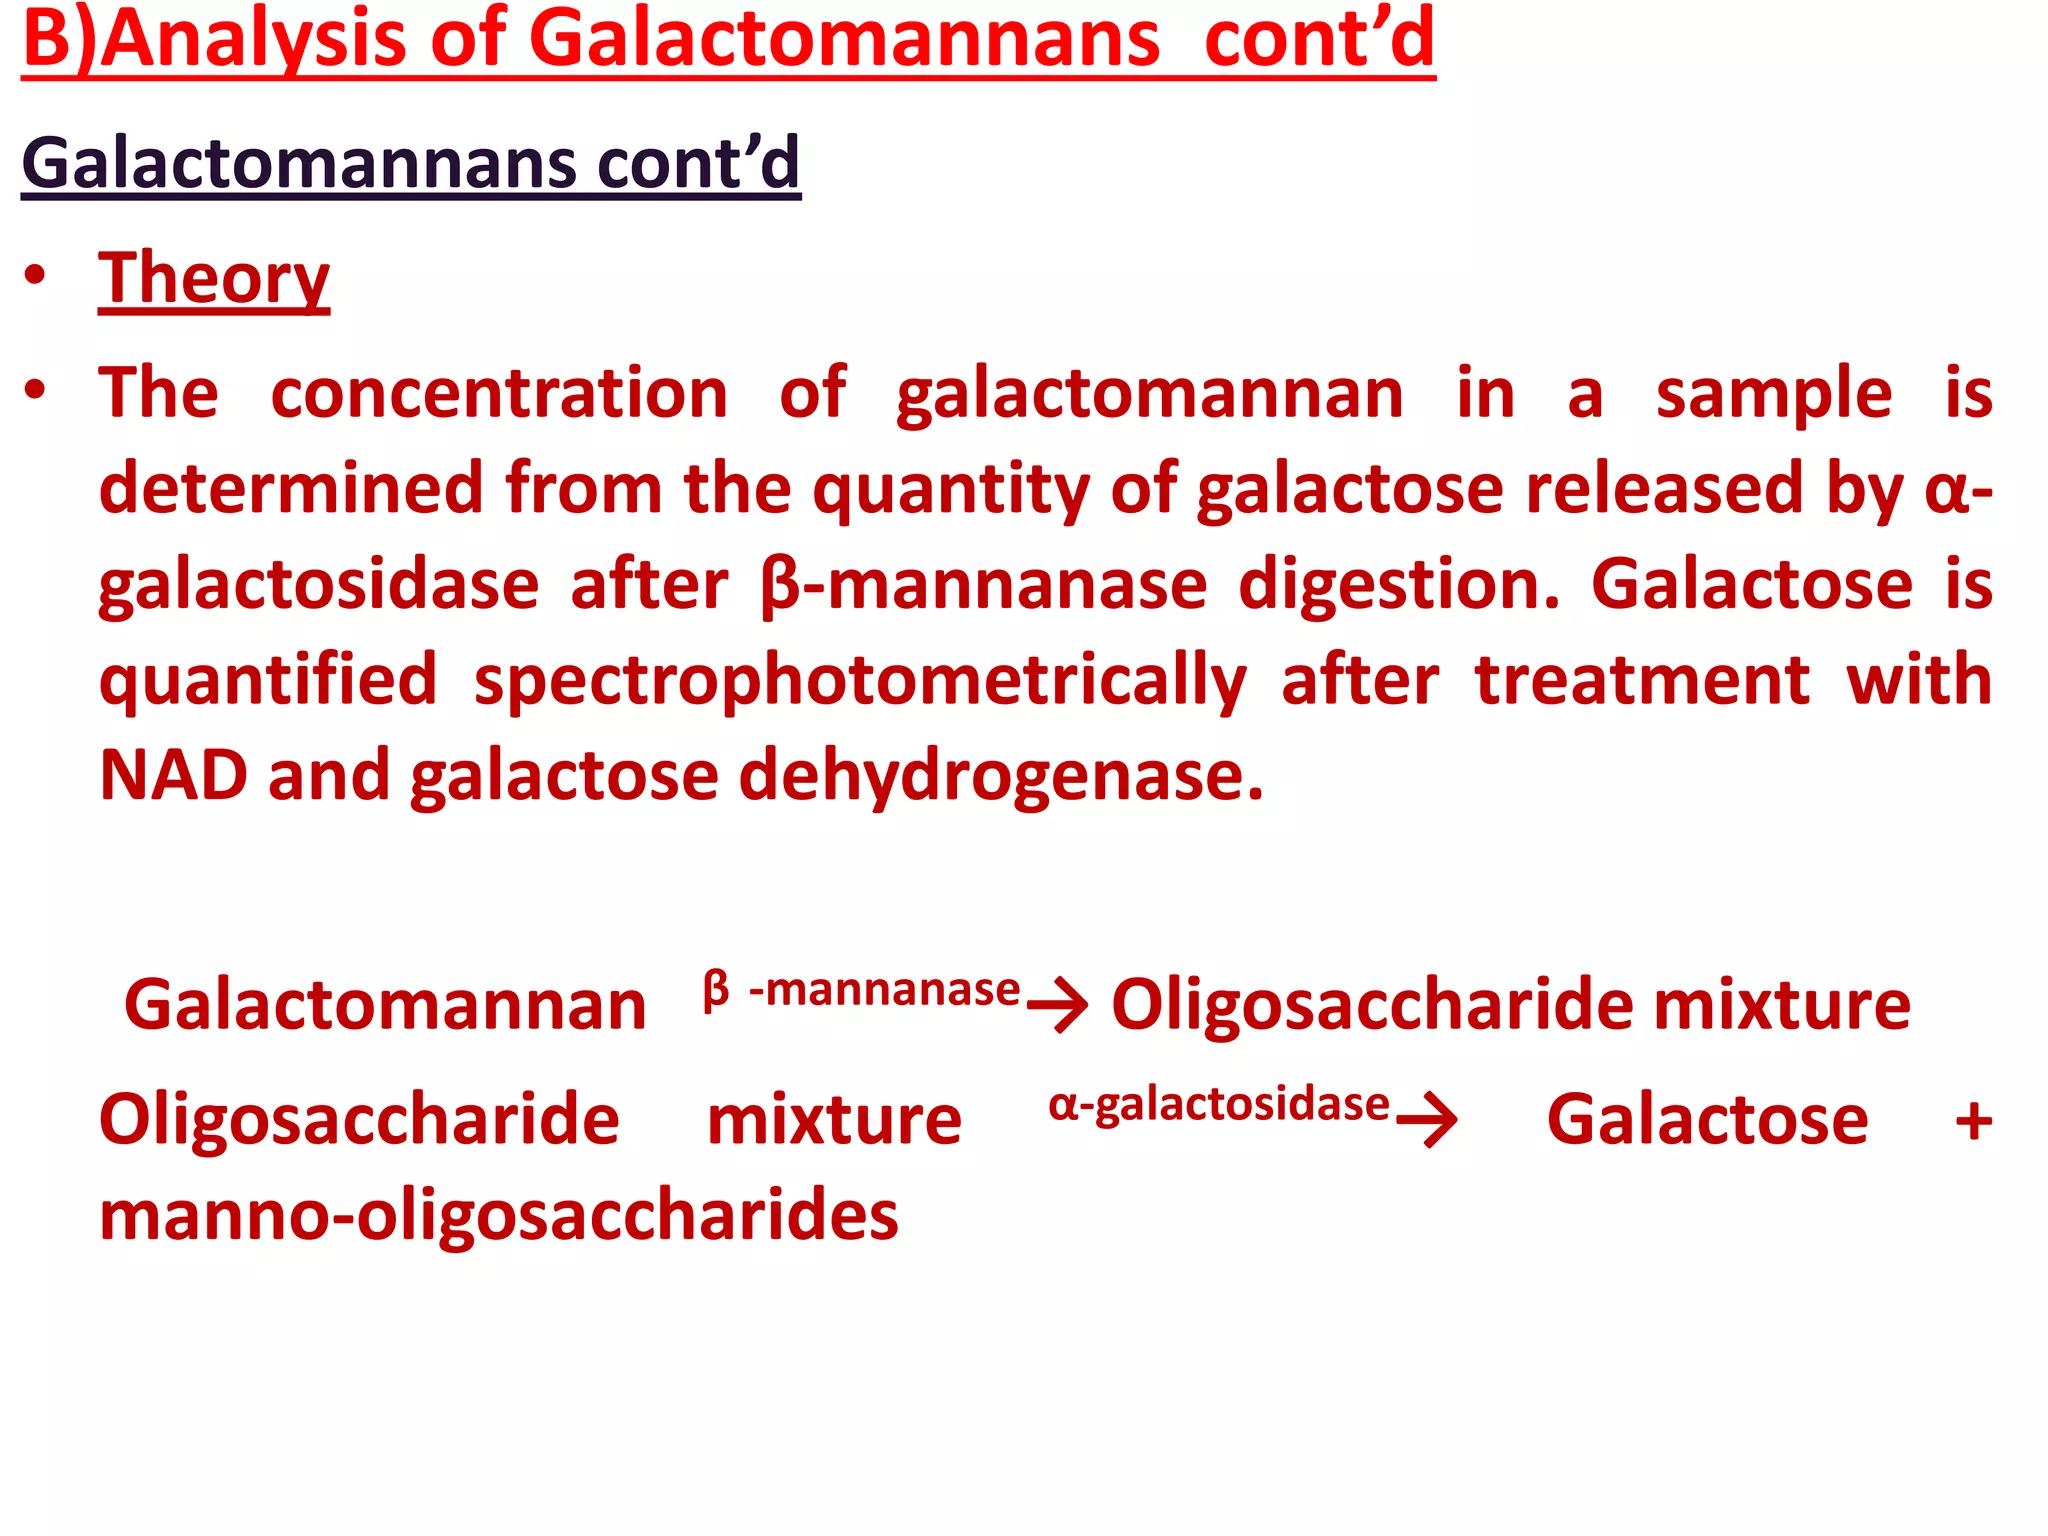
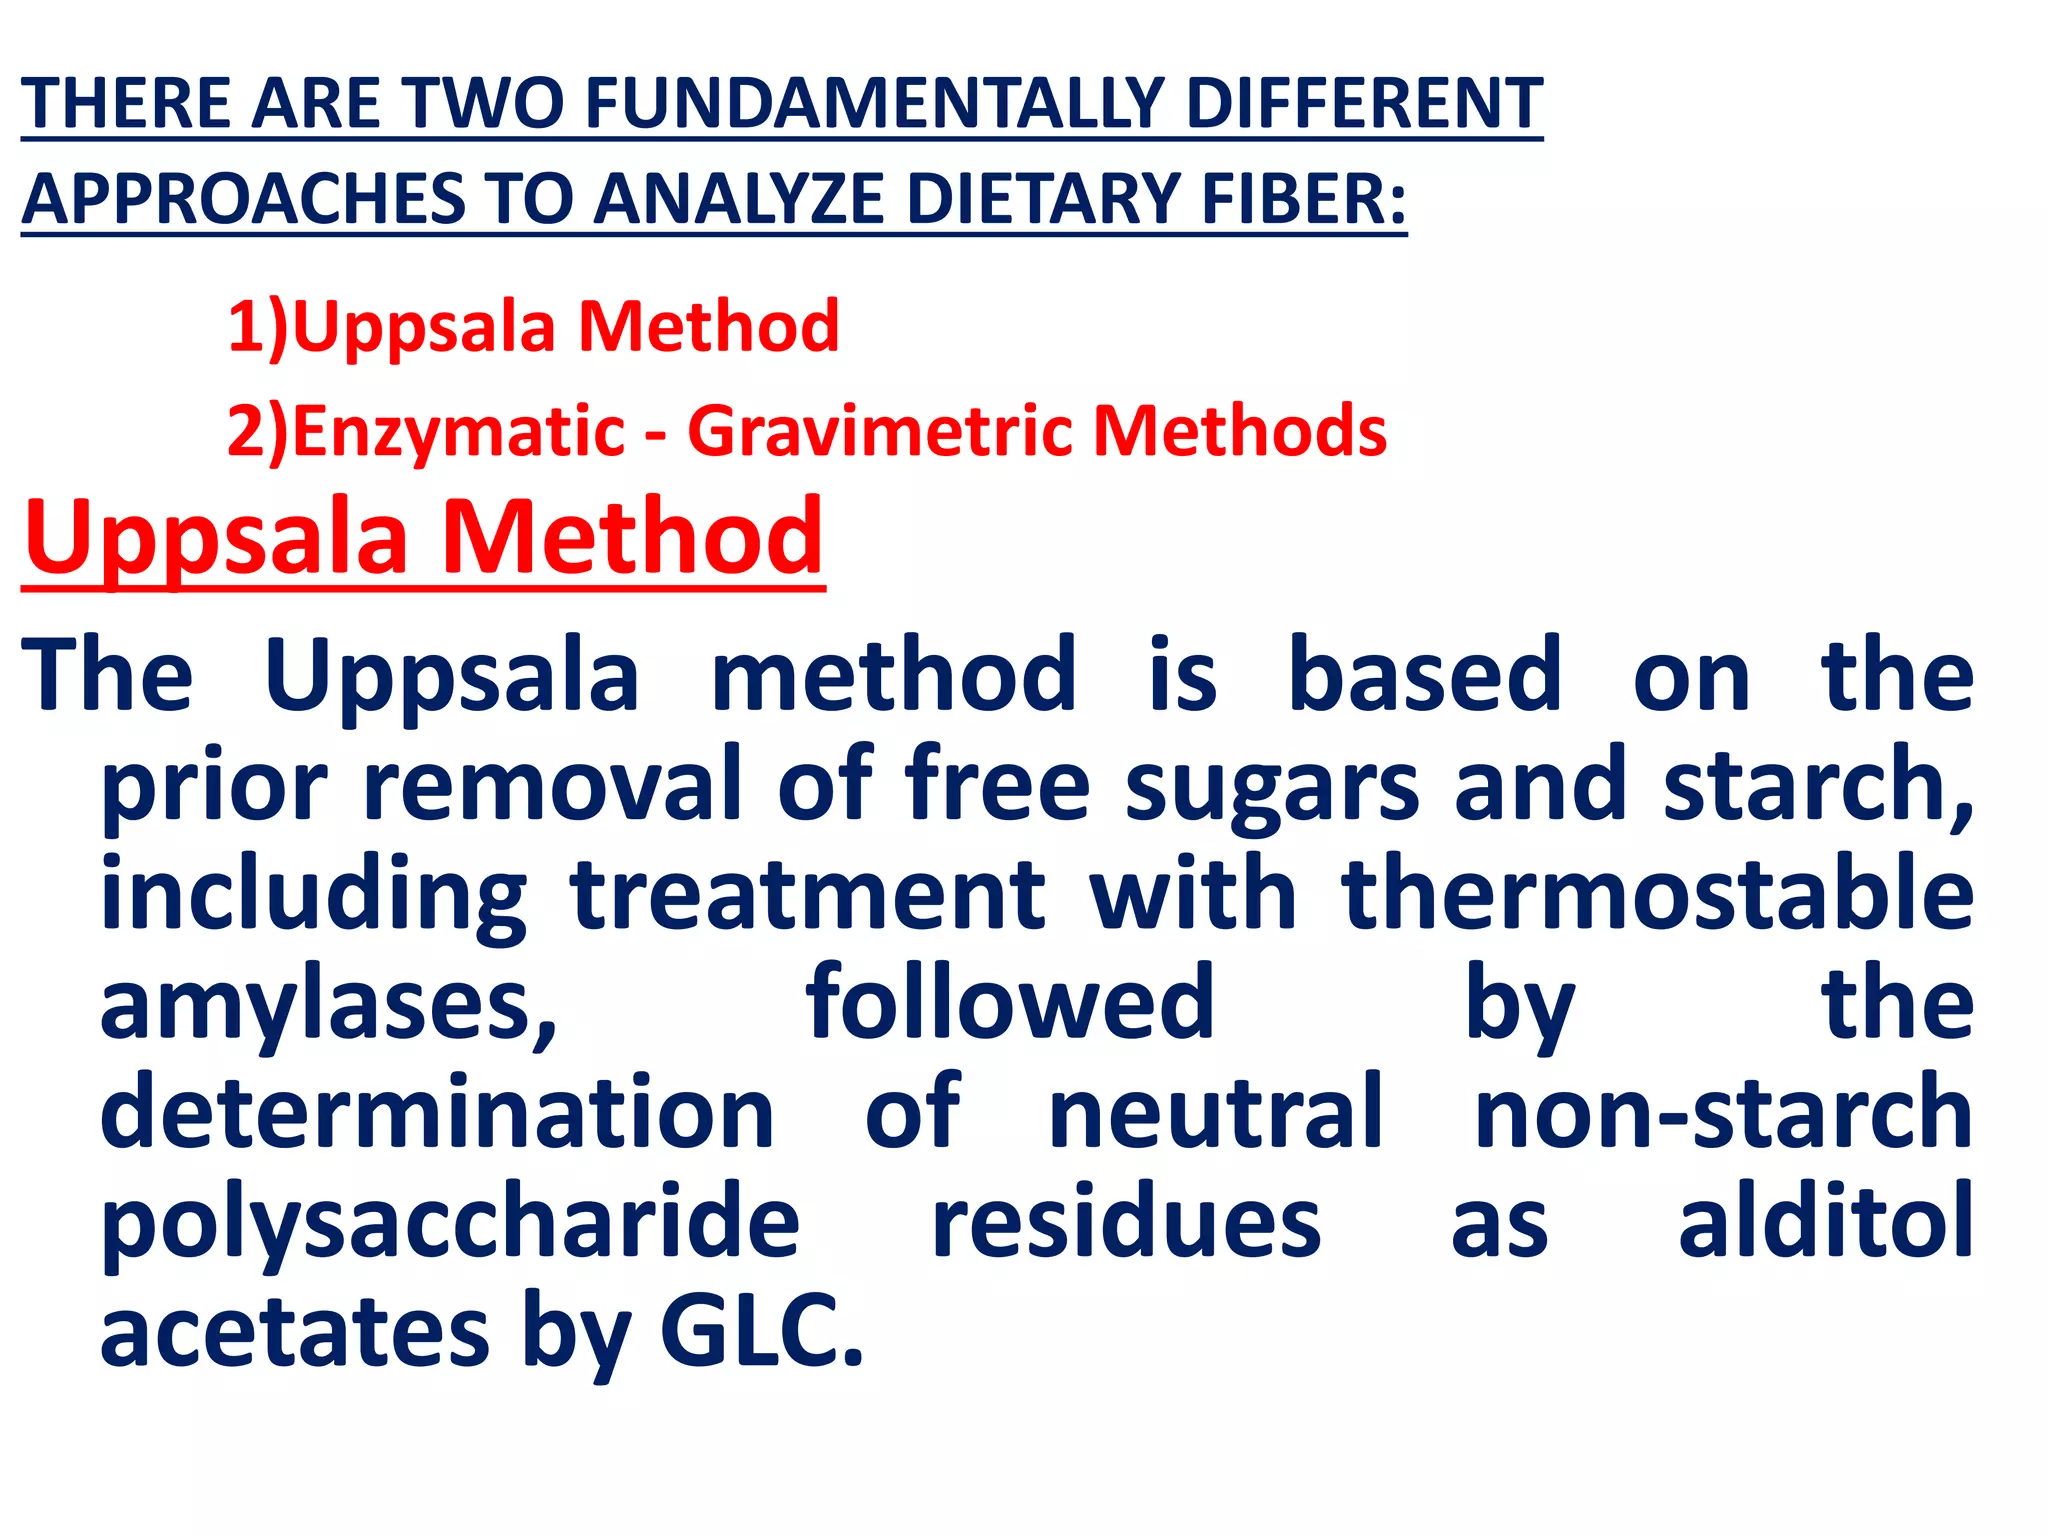
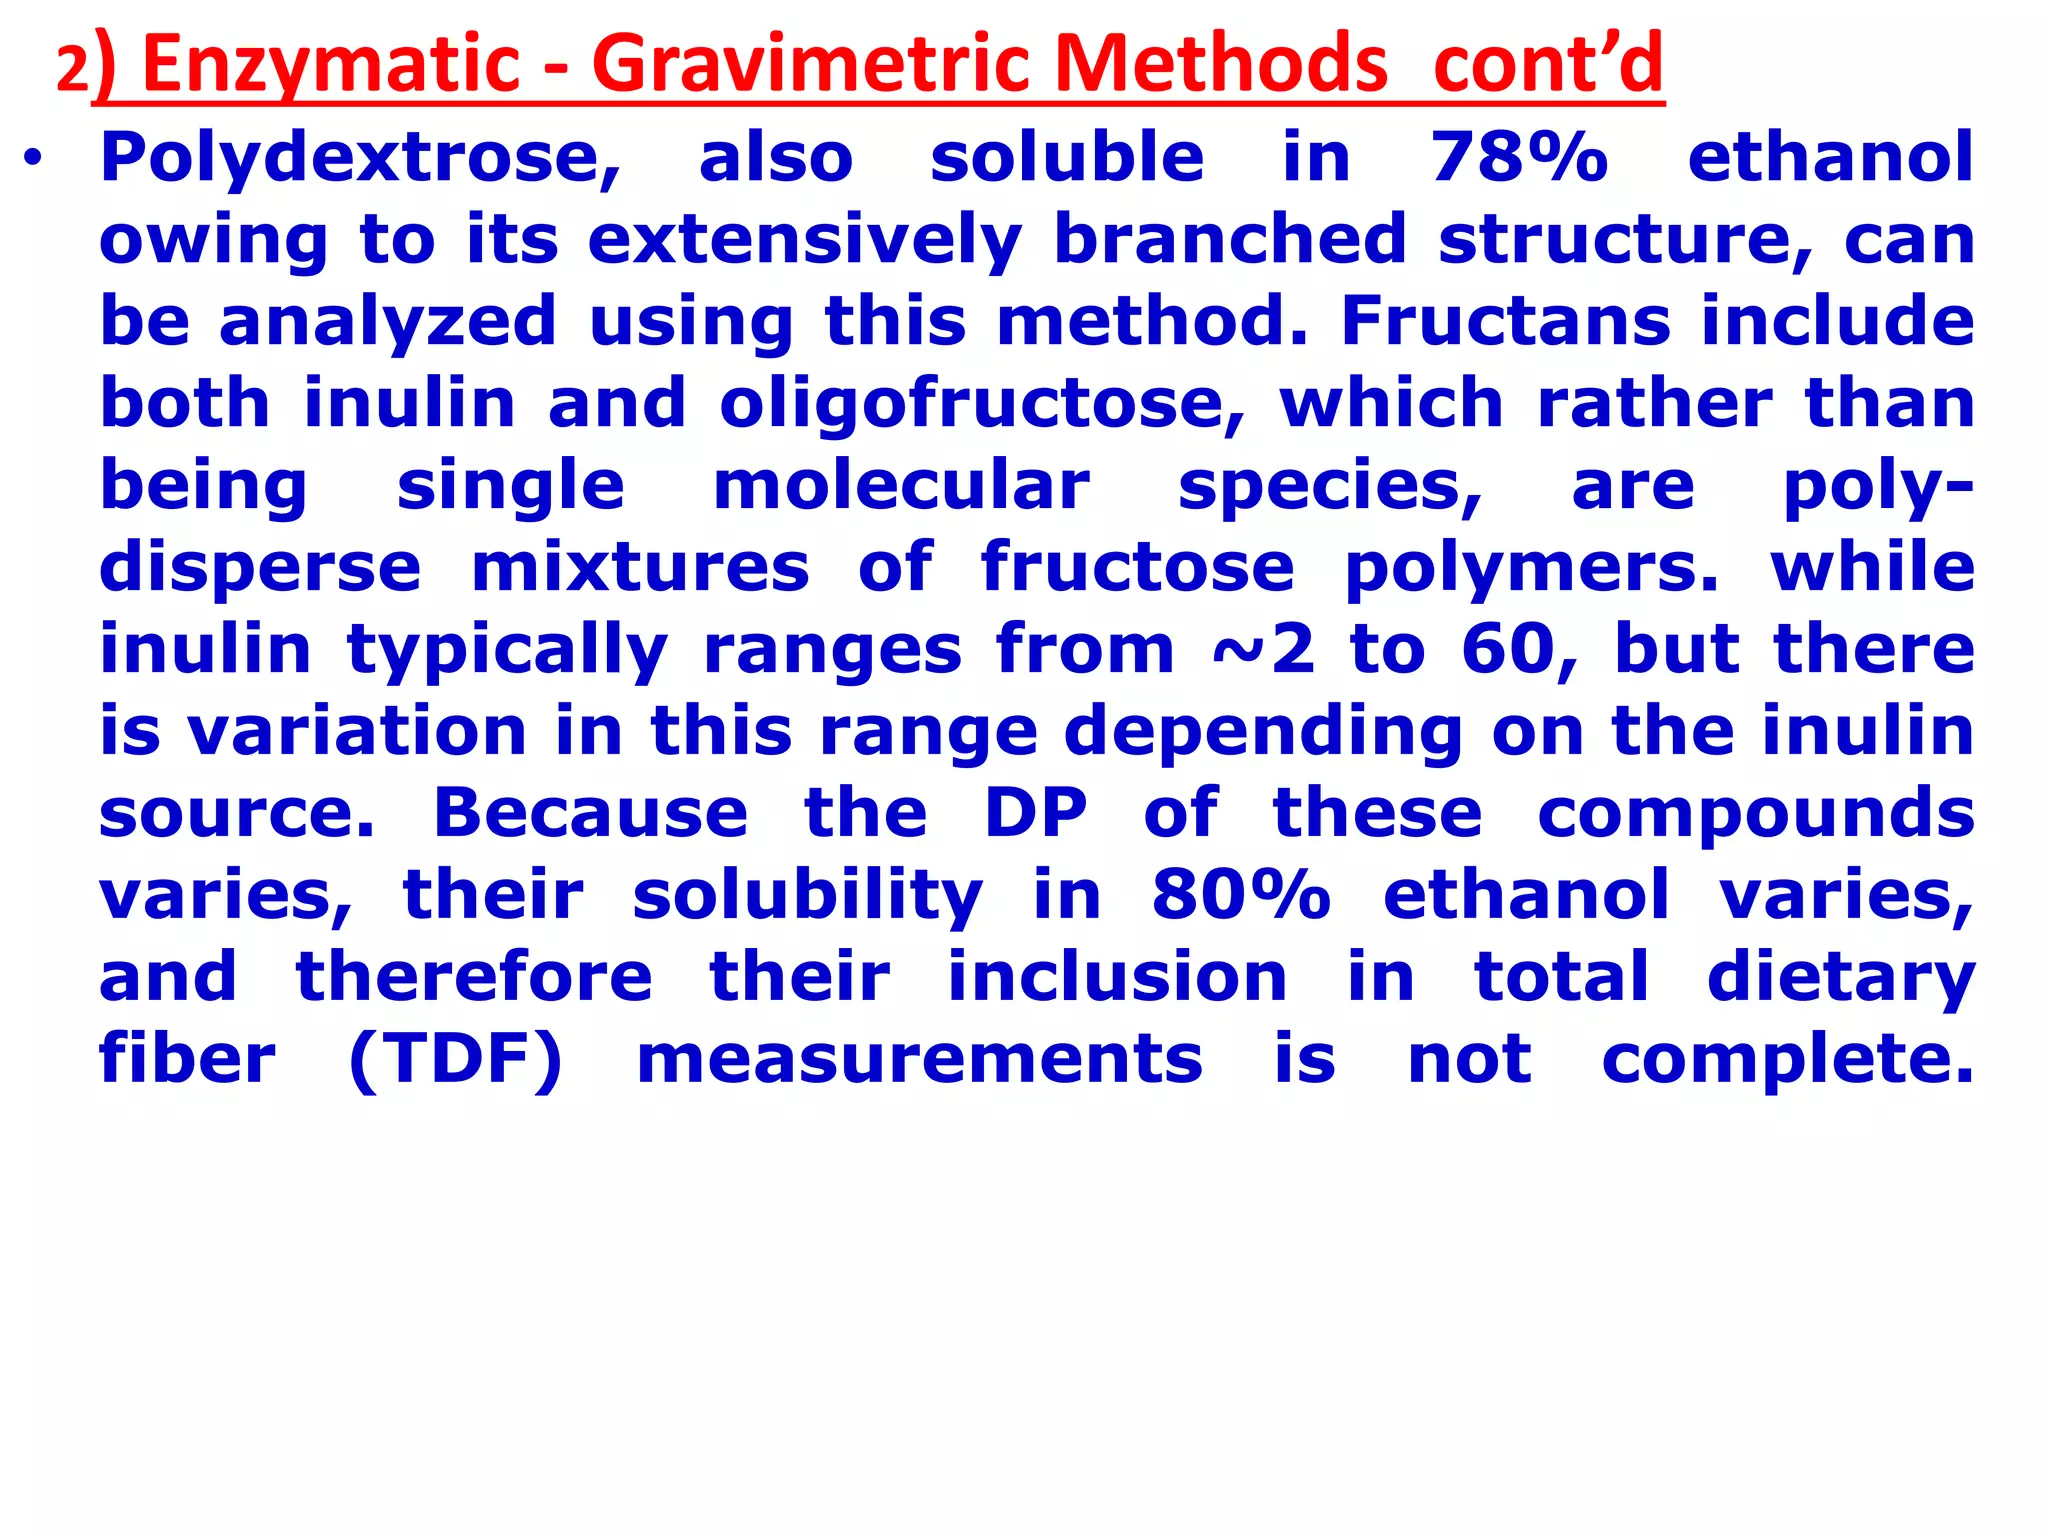
![III) Oligosacharide & Polysaccharide Analysis
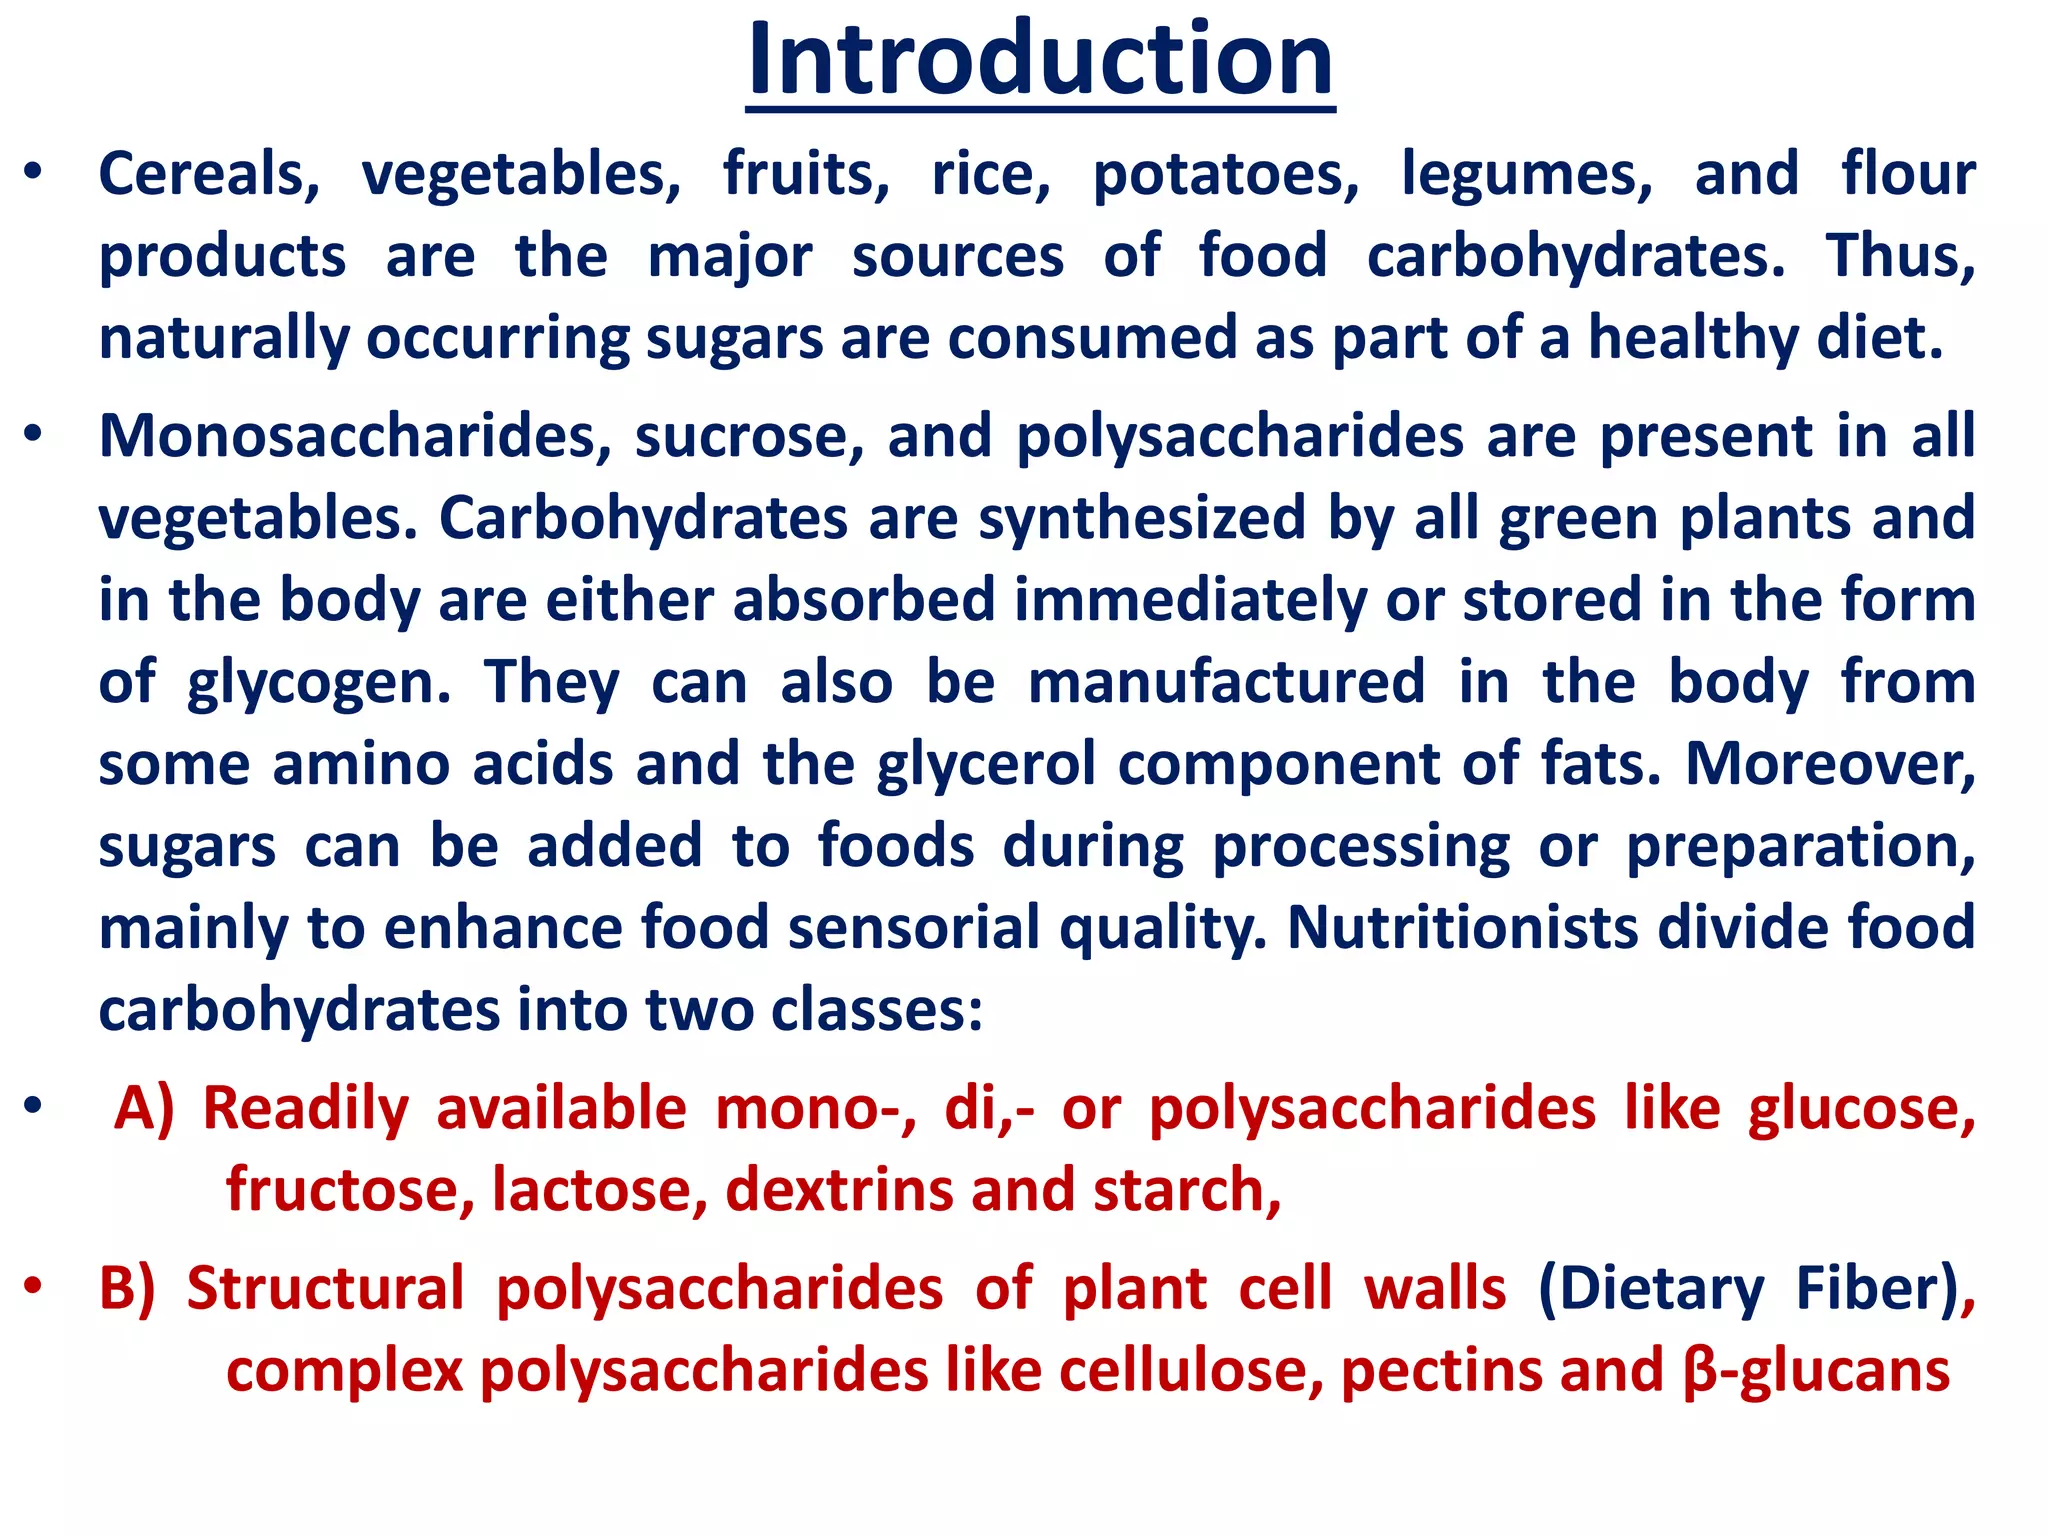
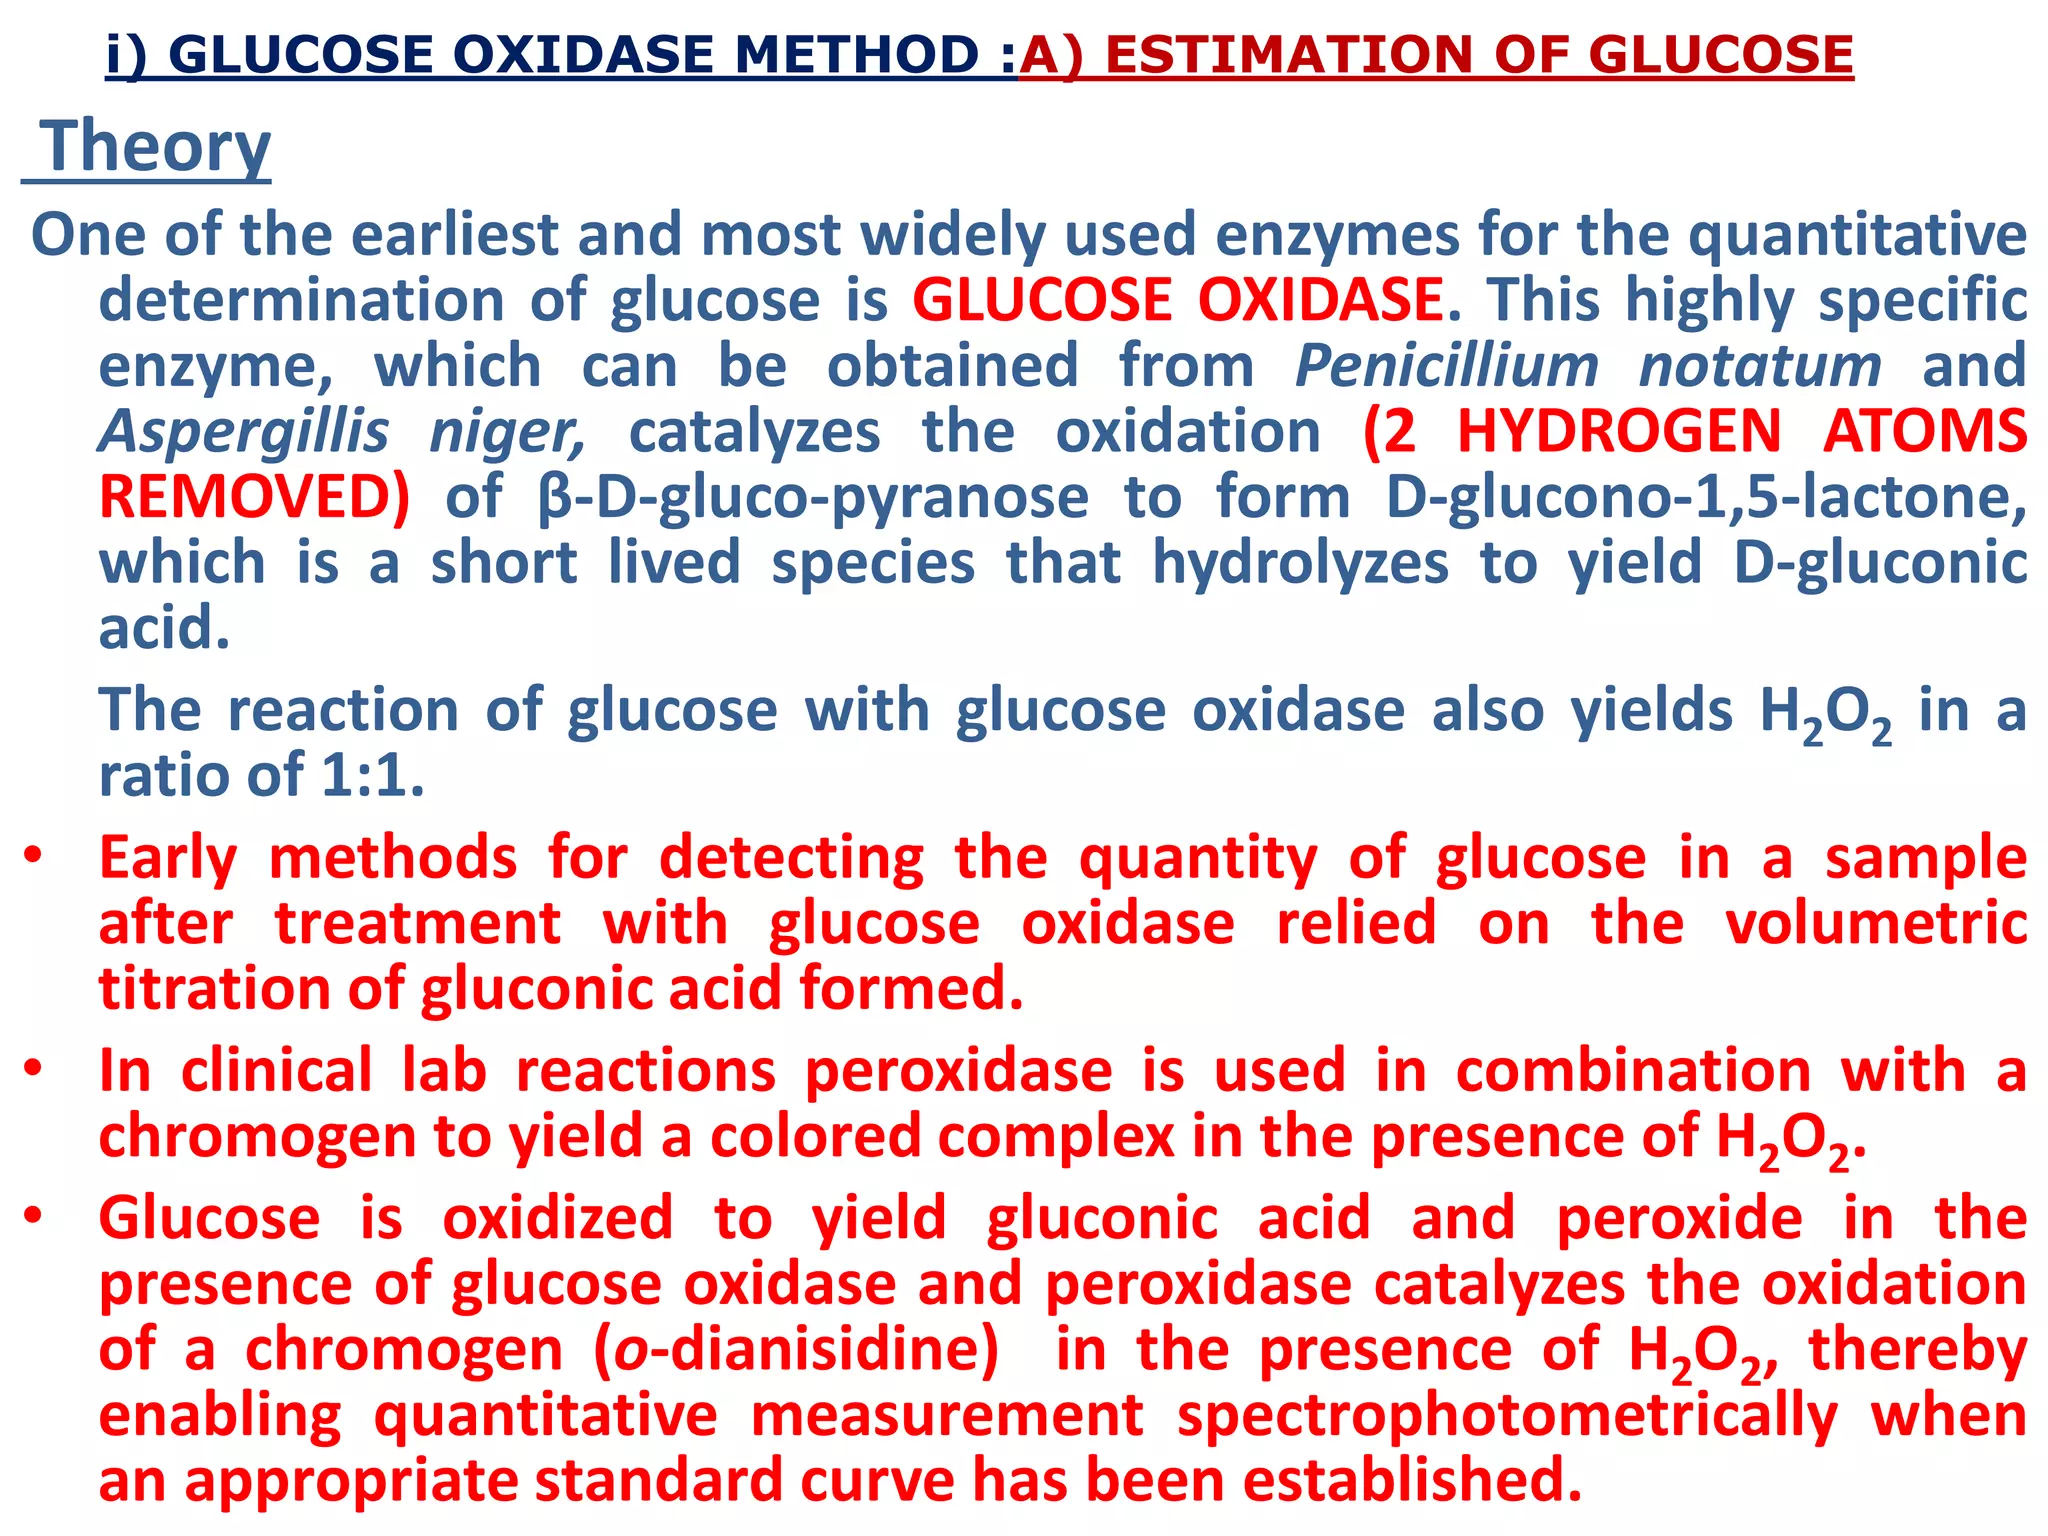
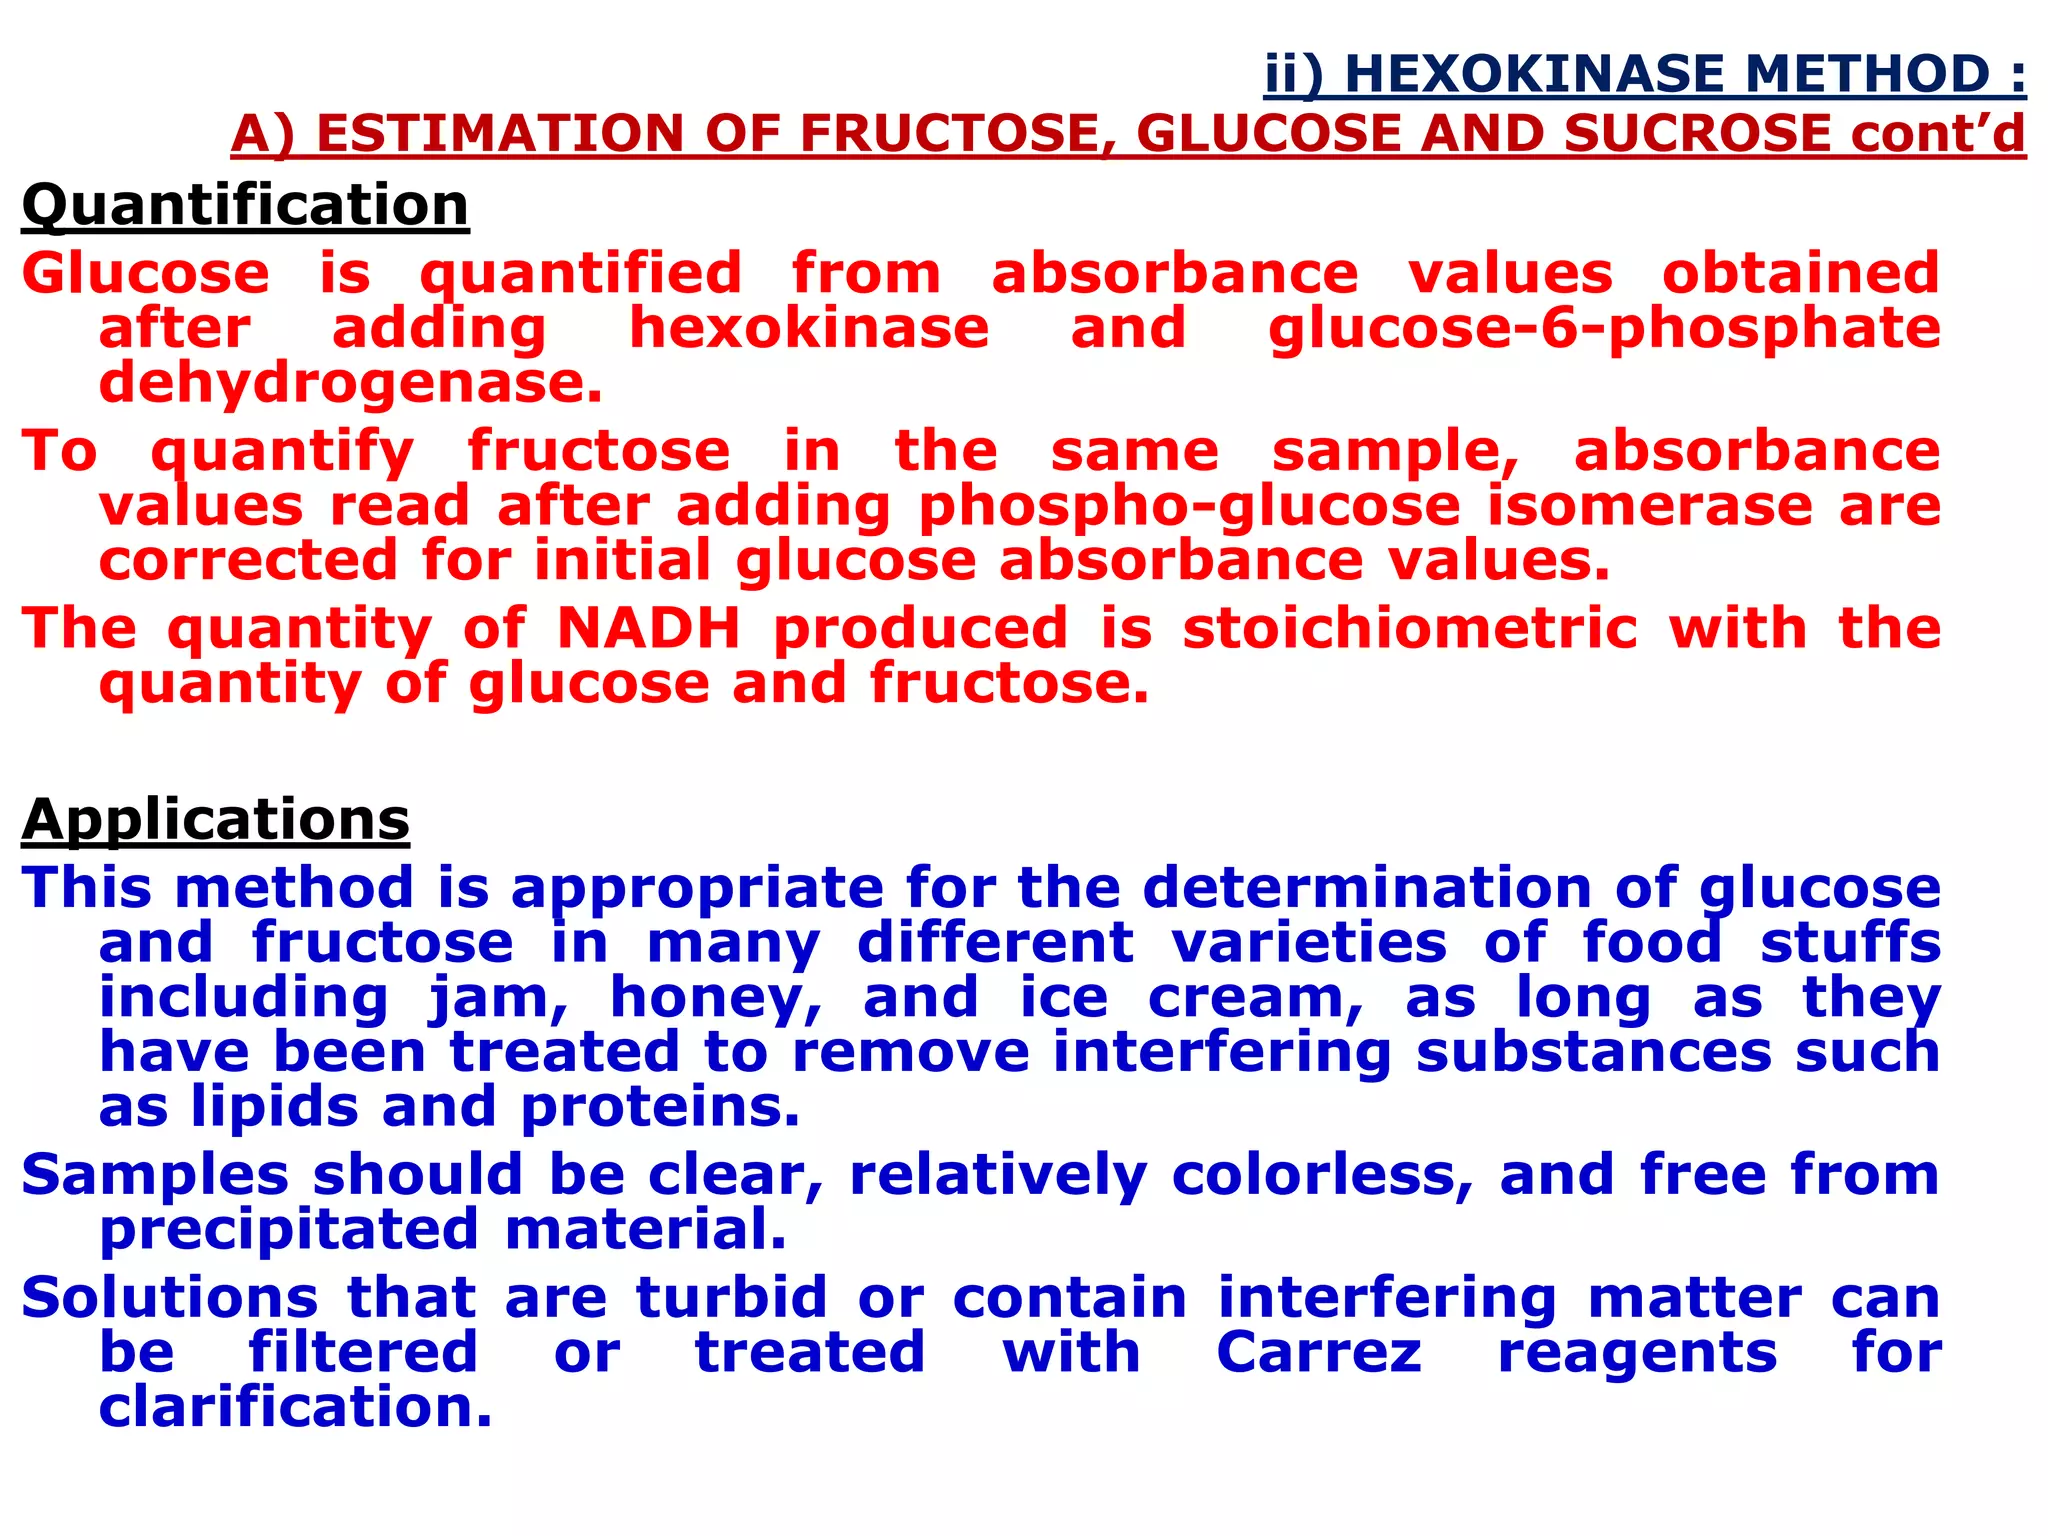
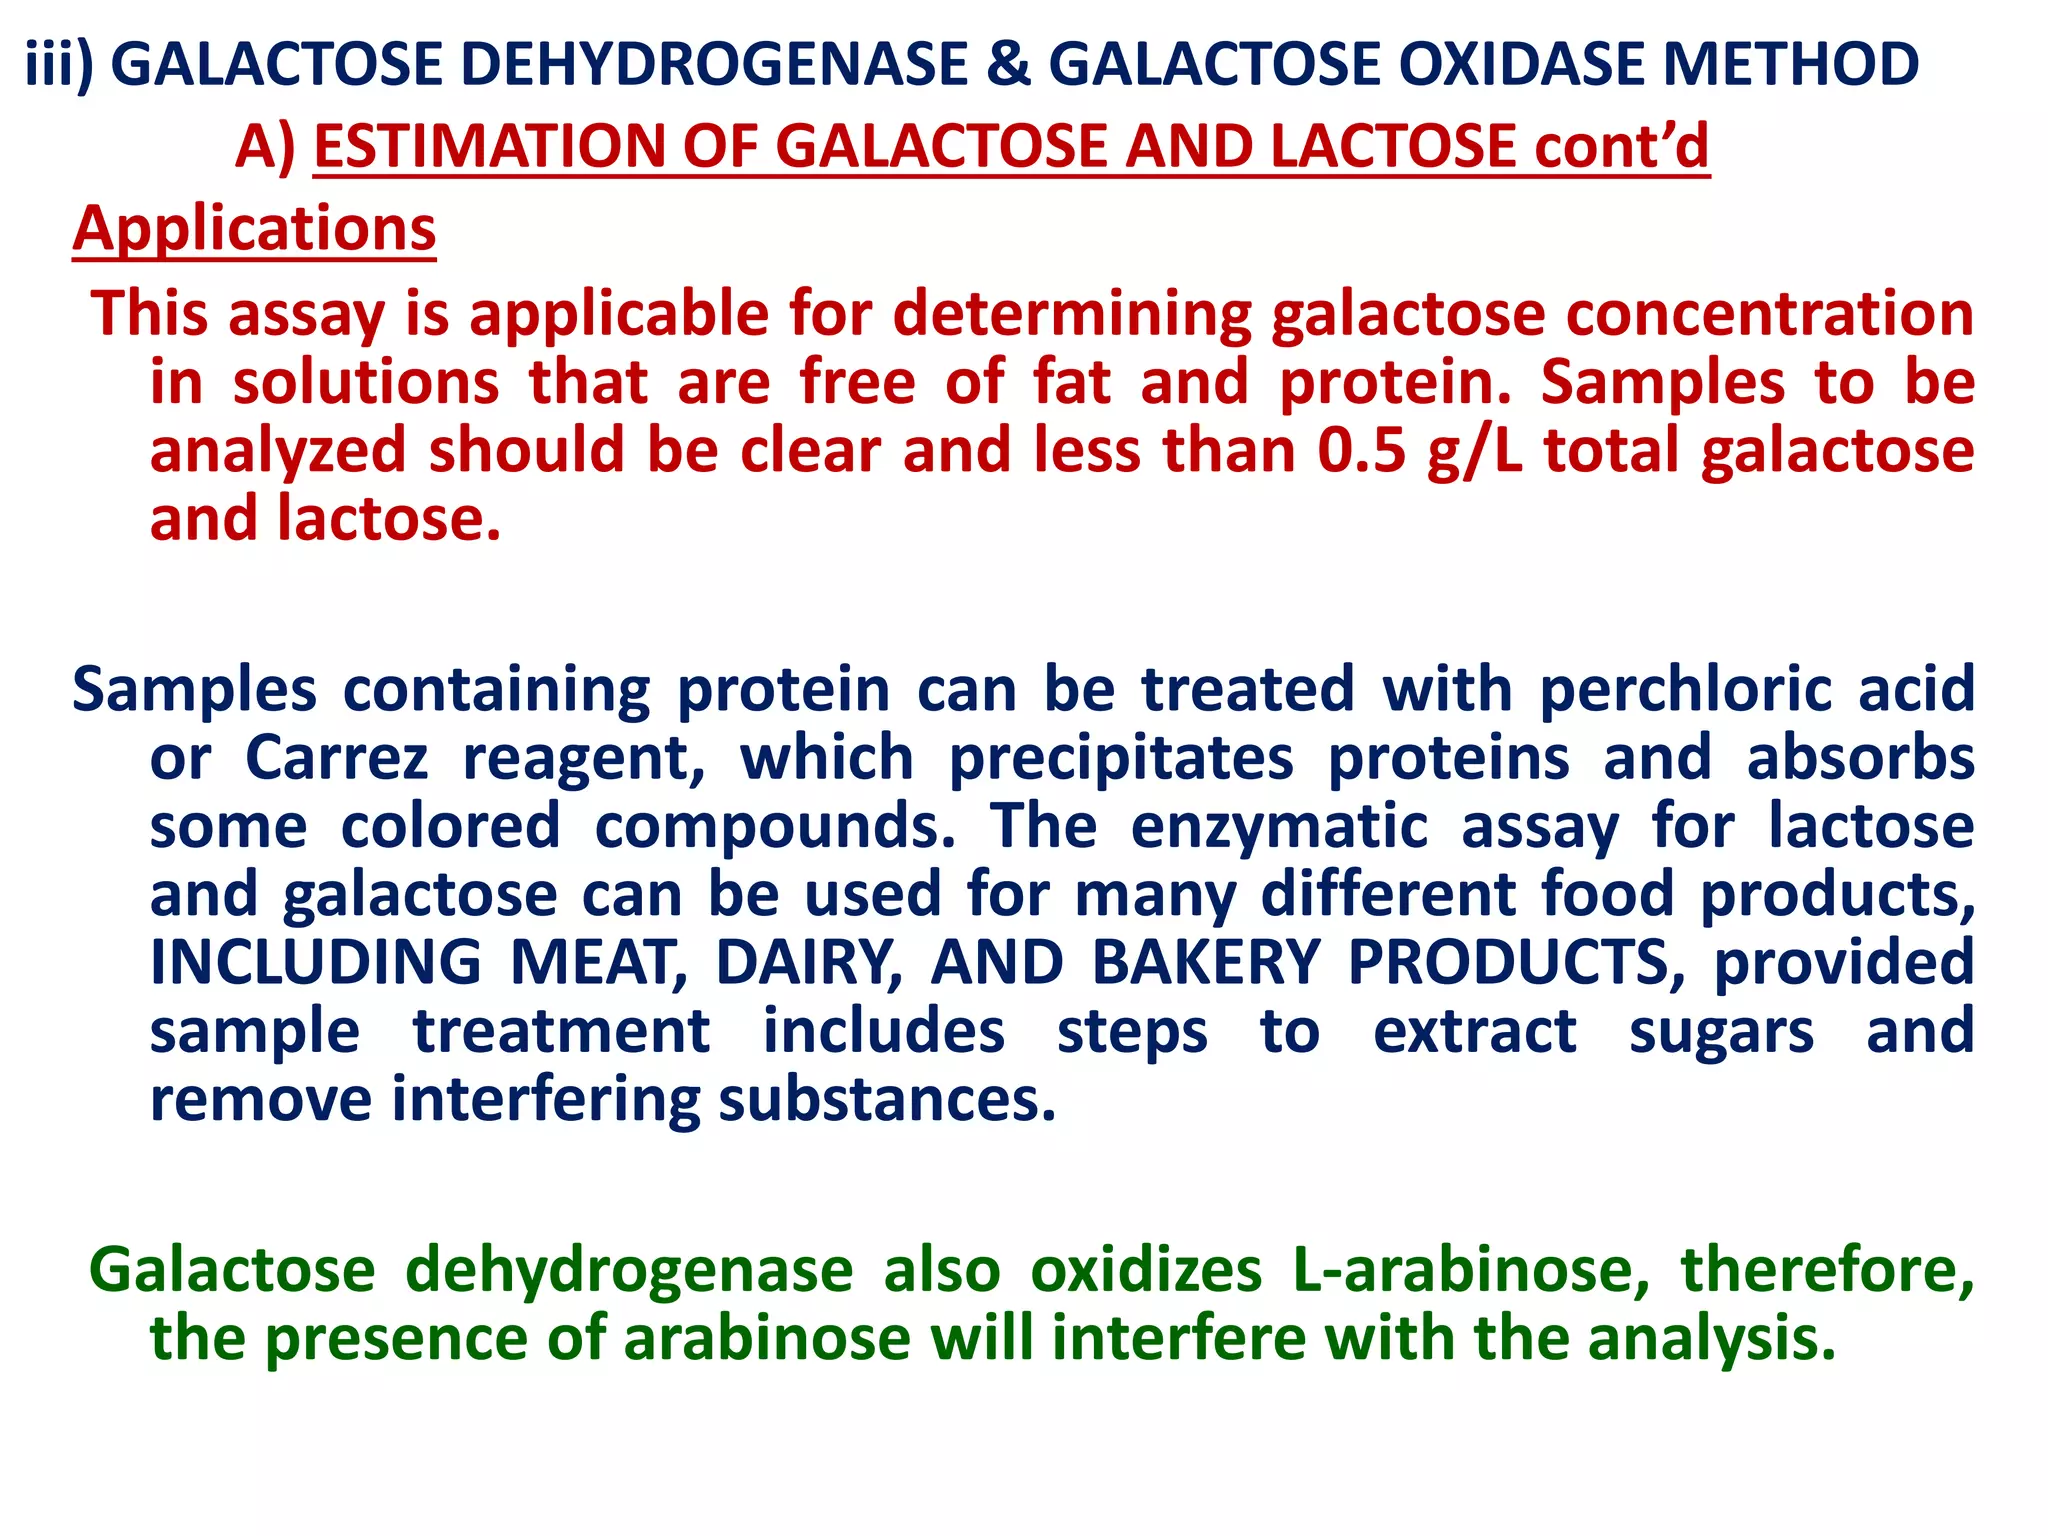
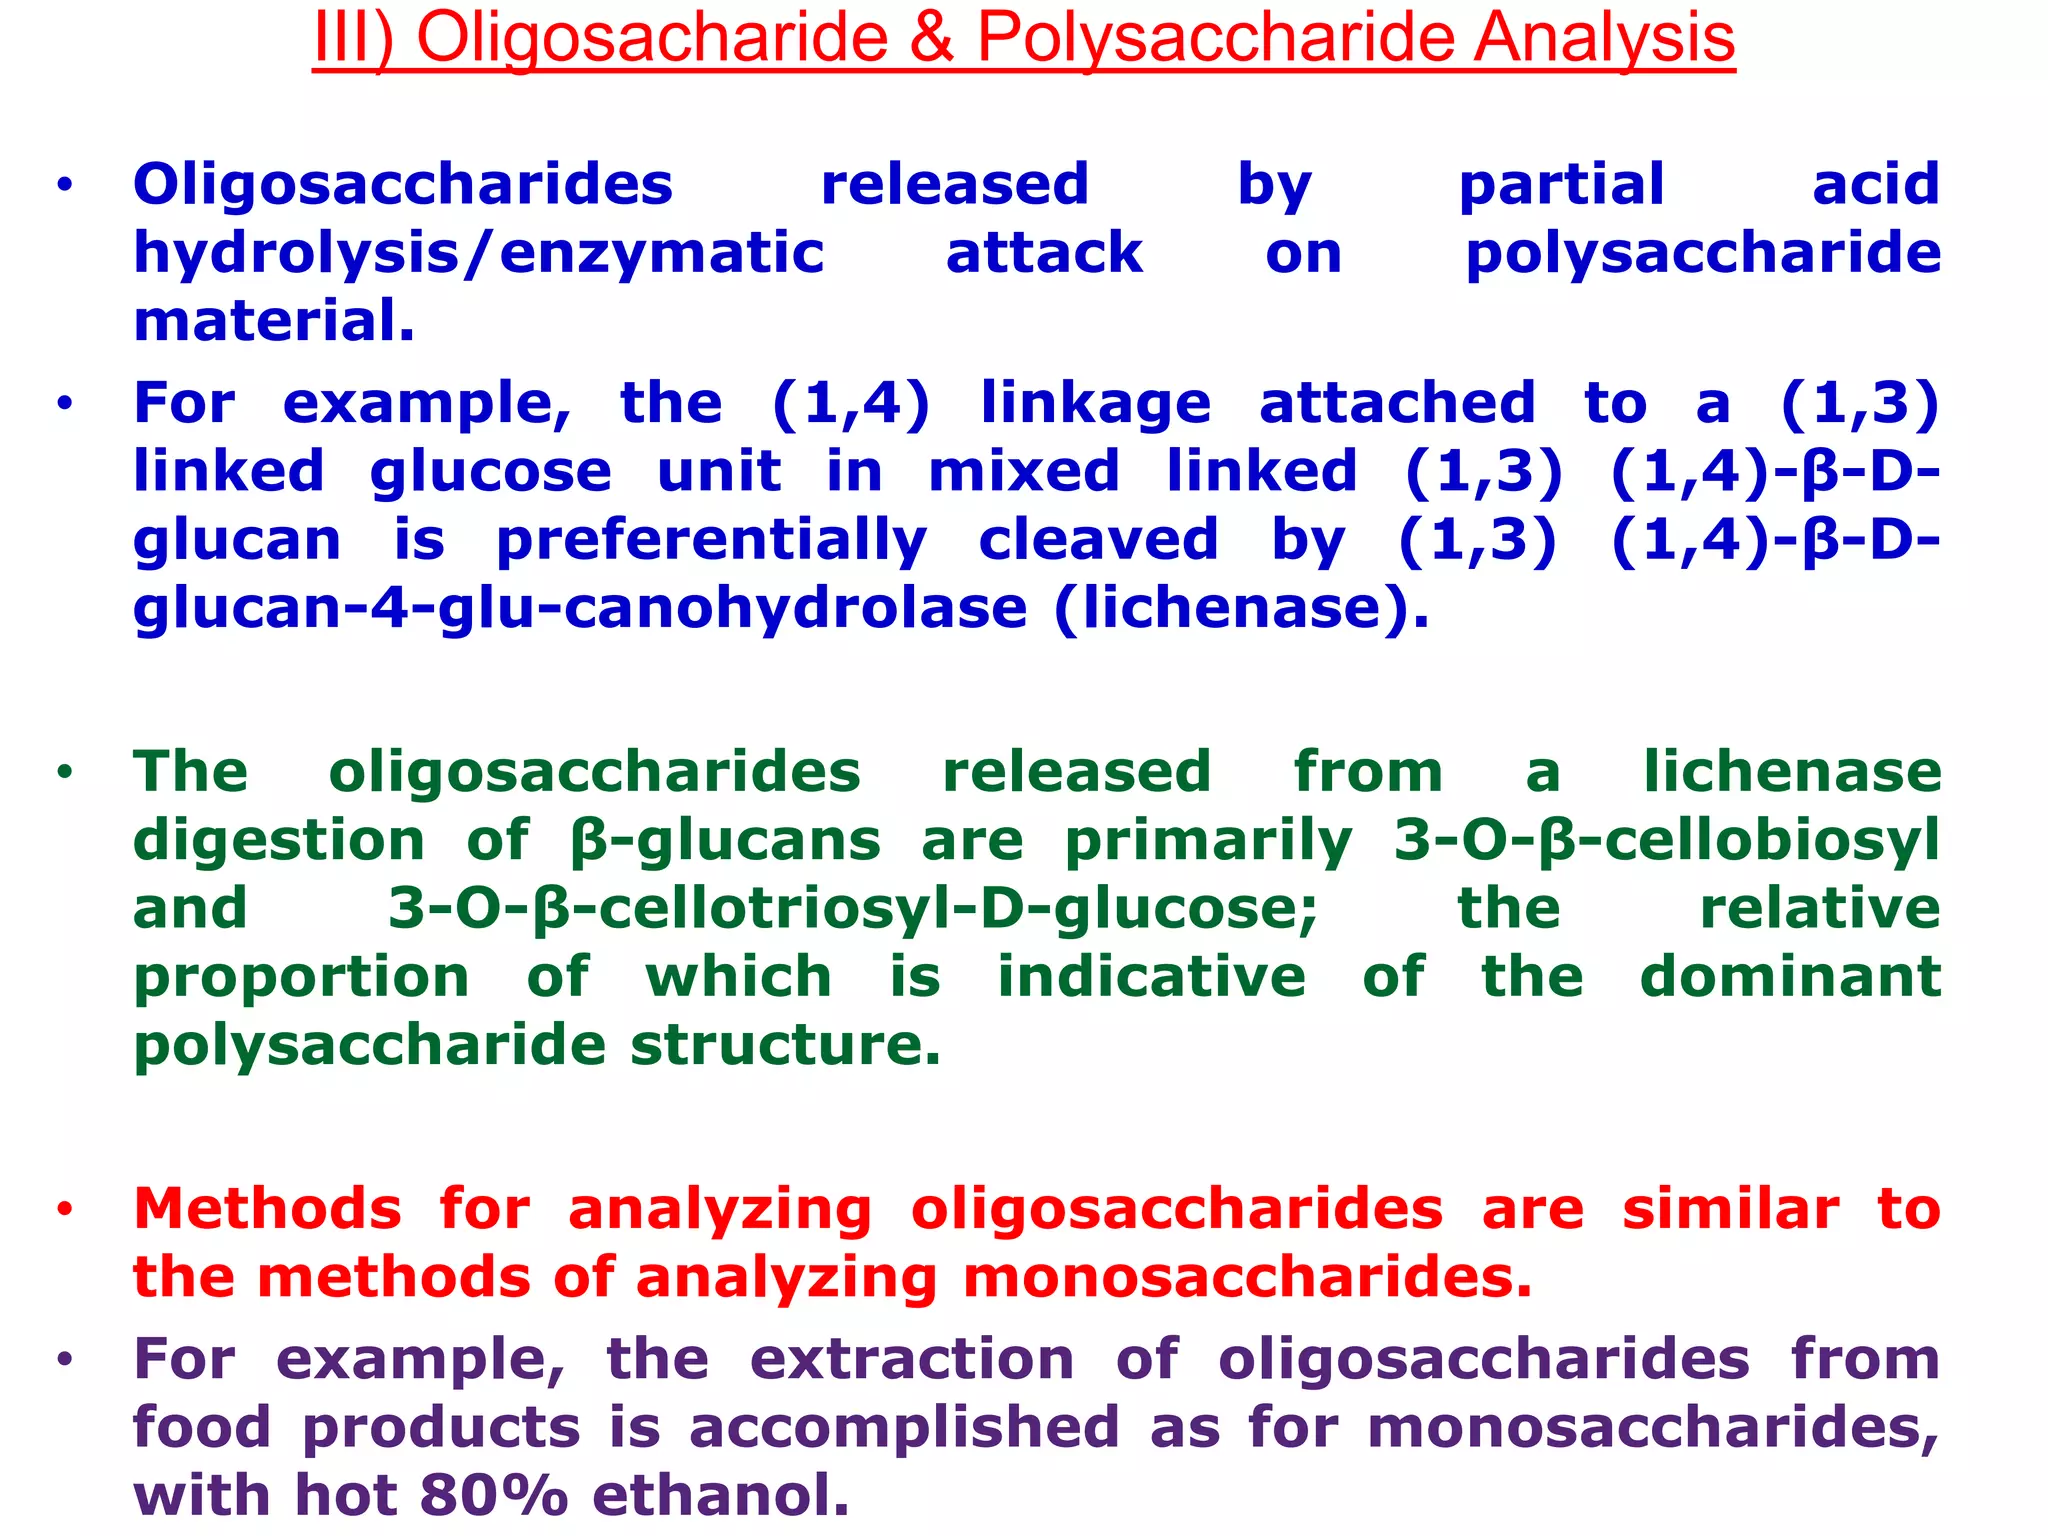
• They can be hydrolyzed with acid or enzymes to their
constituent monosaccharides and the hydrolysate
subjected to analysis by chromatographic, chemical or
enzymatic methods.
• In addition, size exclusion techniques such as high
performance size exclusion chromatography or gel
permeation chromatography can be used to separate
oligosaccharide mixtures by size.
Methods adopted are:
• 1)Size Exclusion Chromatography [GEL
FILTRATION]
[MOLECULAR SIEVE CHROMATOGRAPHY]
• 2) High Performance Anion Exchange
Chromatography (HPAEC)](https://image.slidesharecdn.com/generalmethodsforanalysisoffoodcarbohydrates-200224104841/75/General-methods-for-analysis-of-food-carbohydrates-75-2048.jpg)
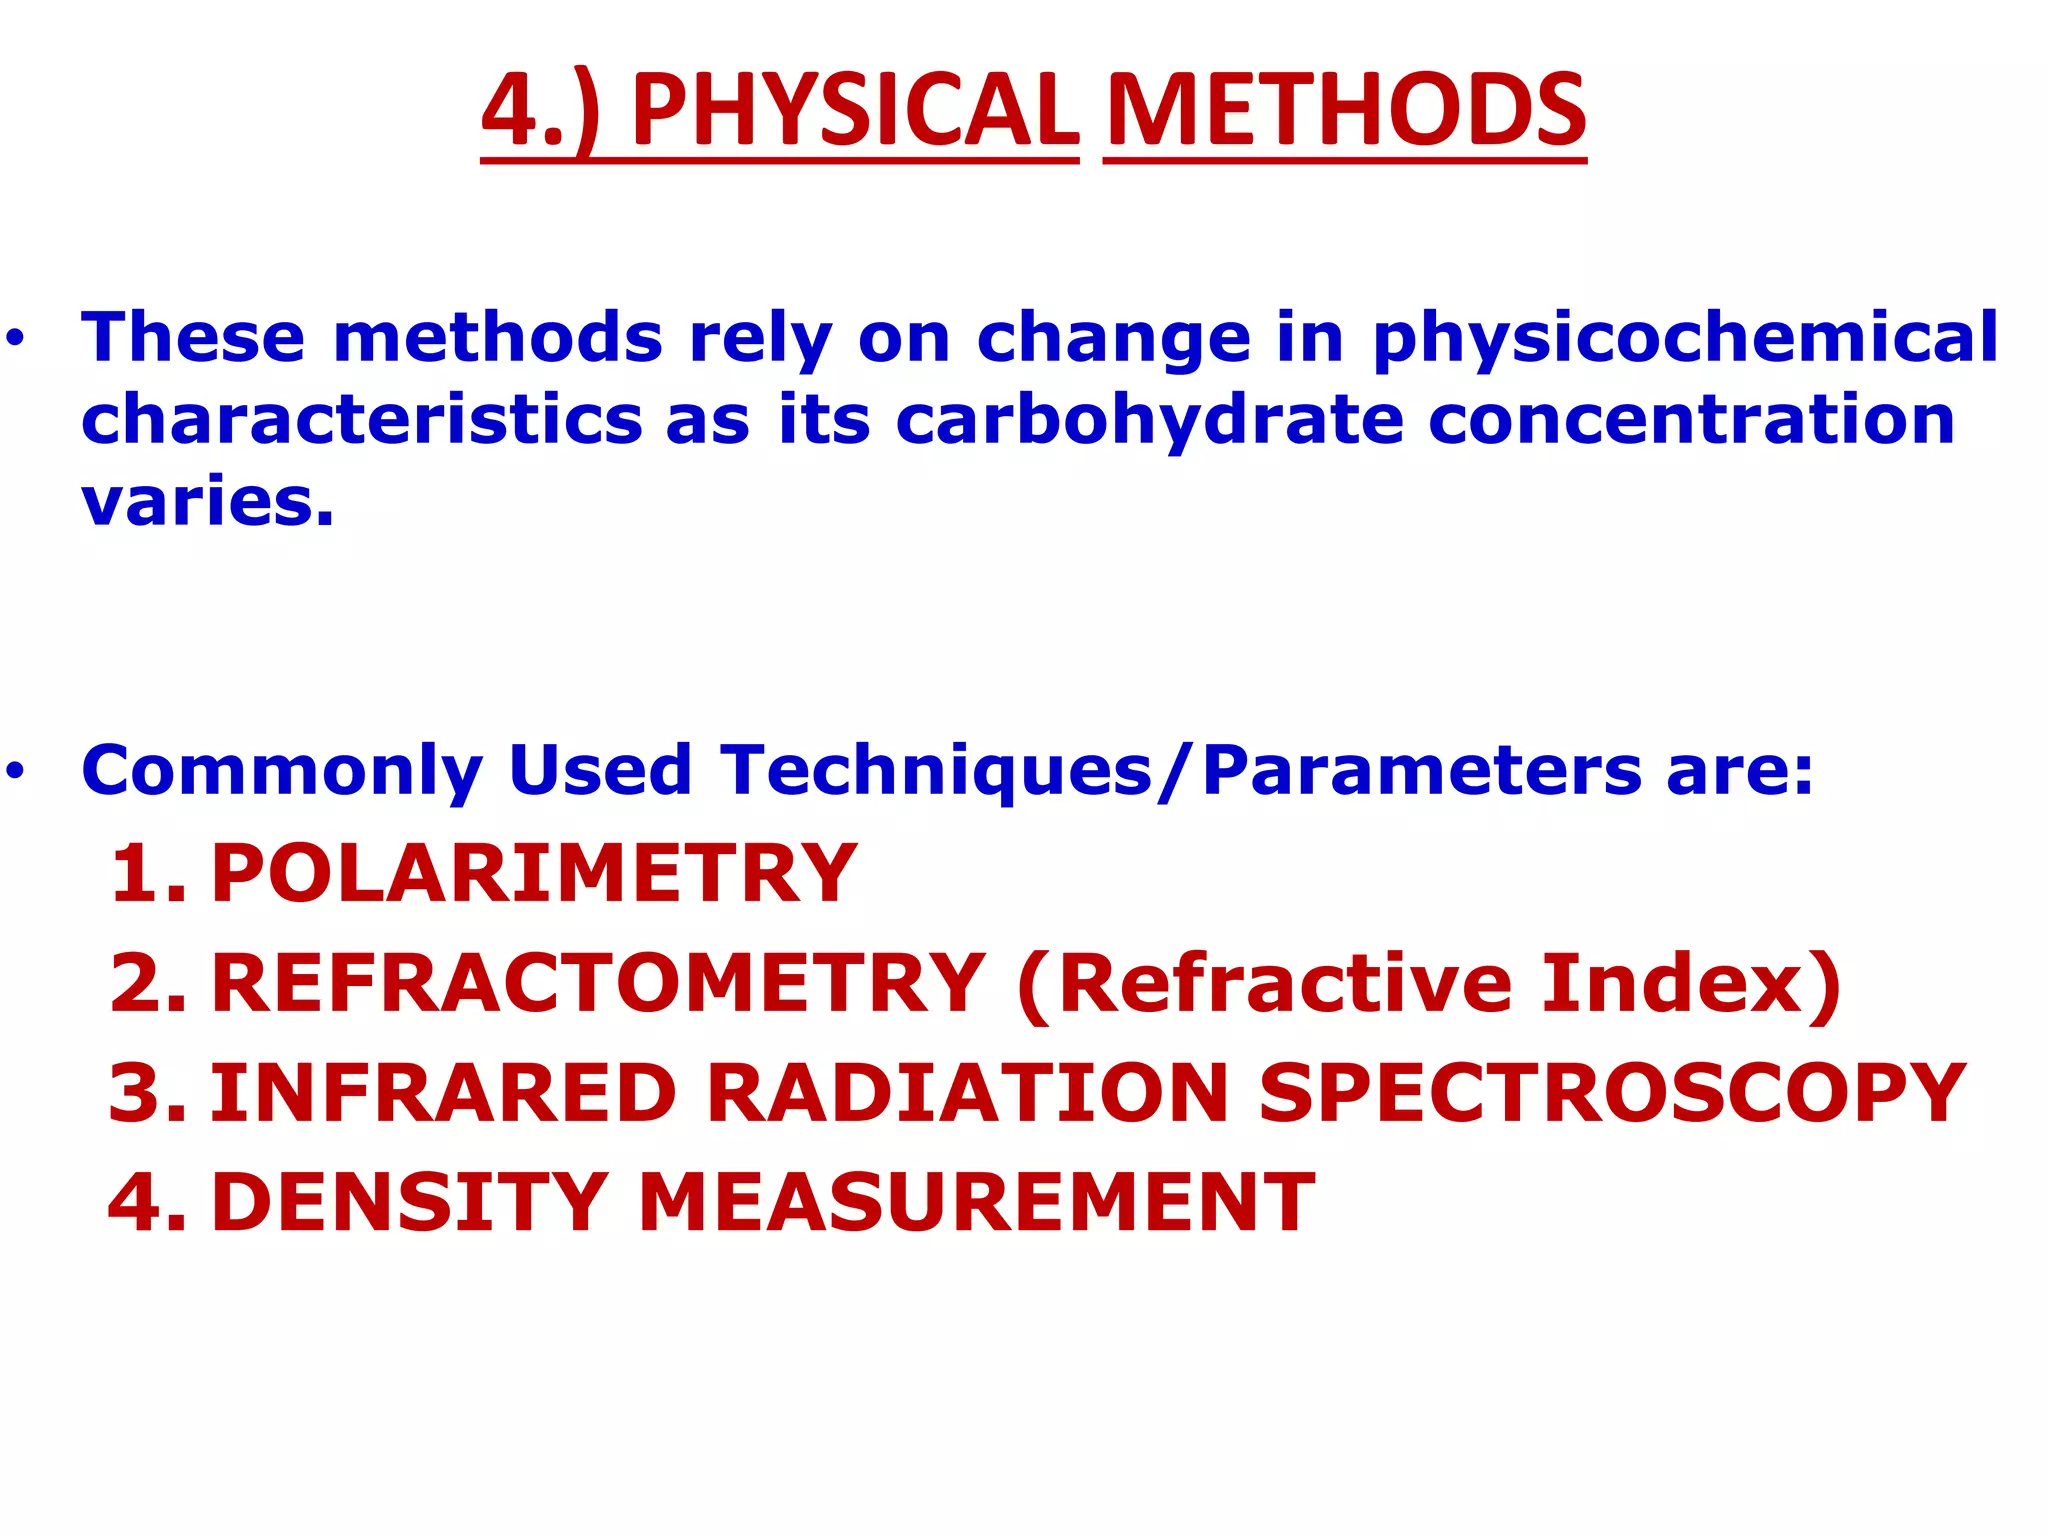
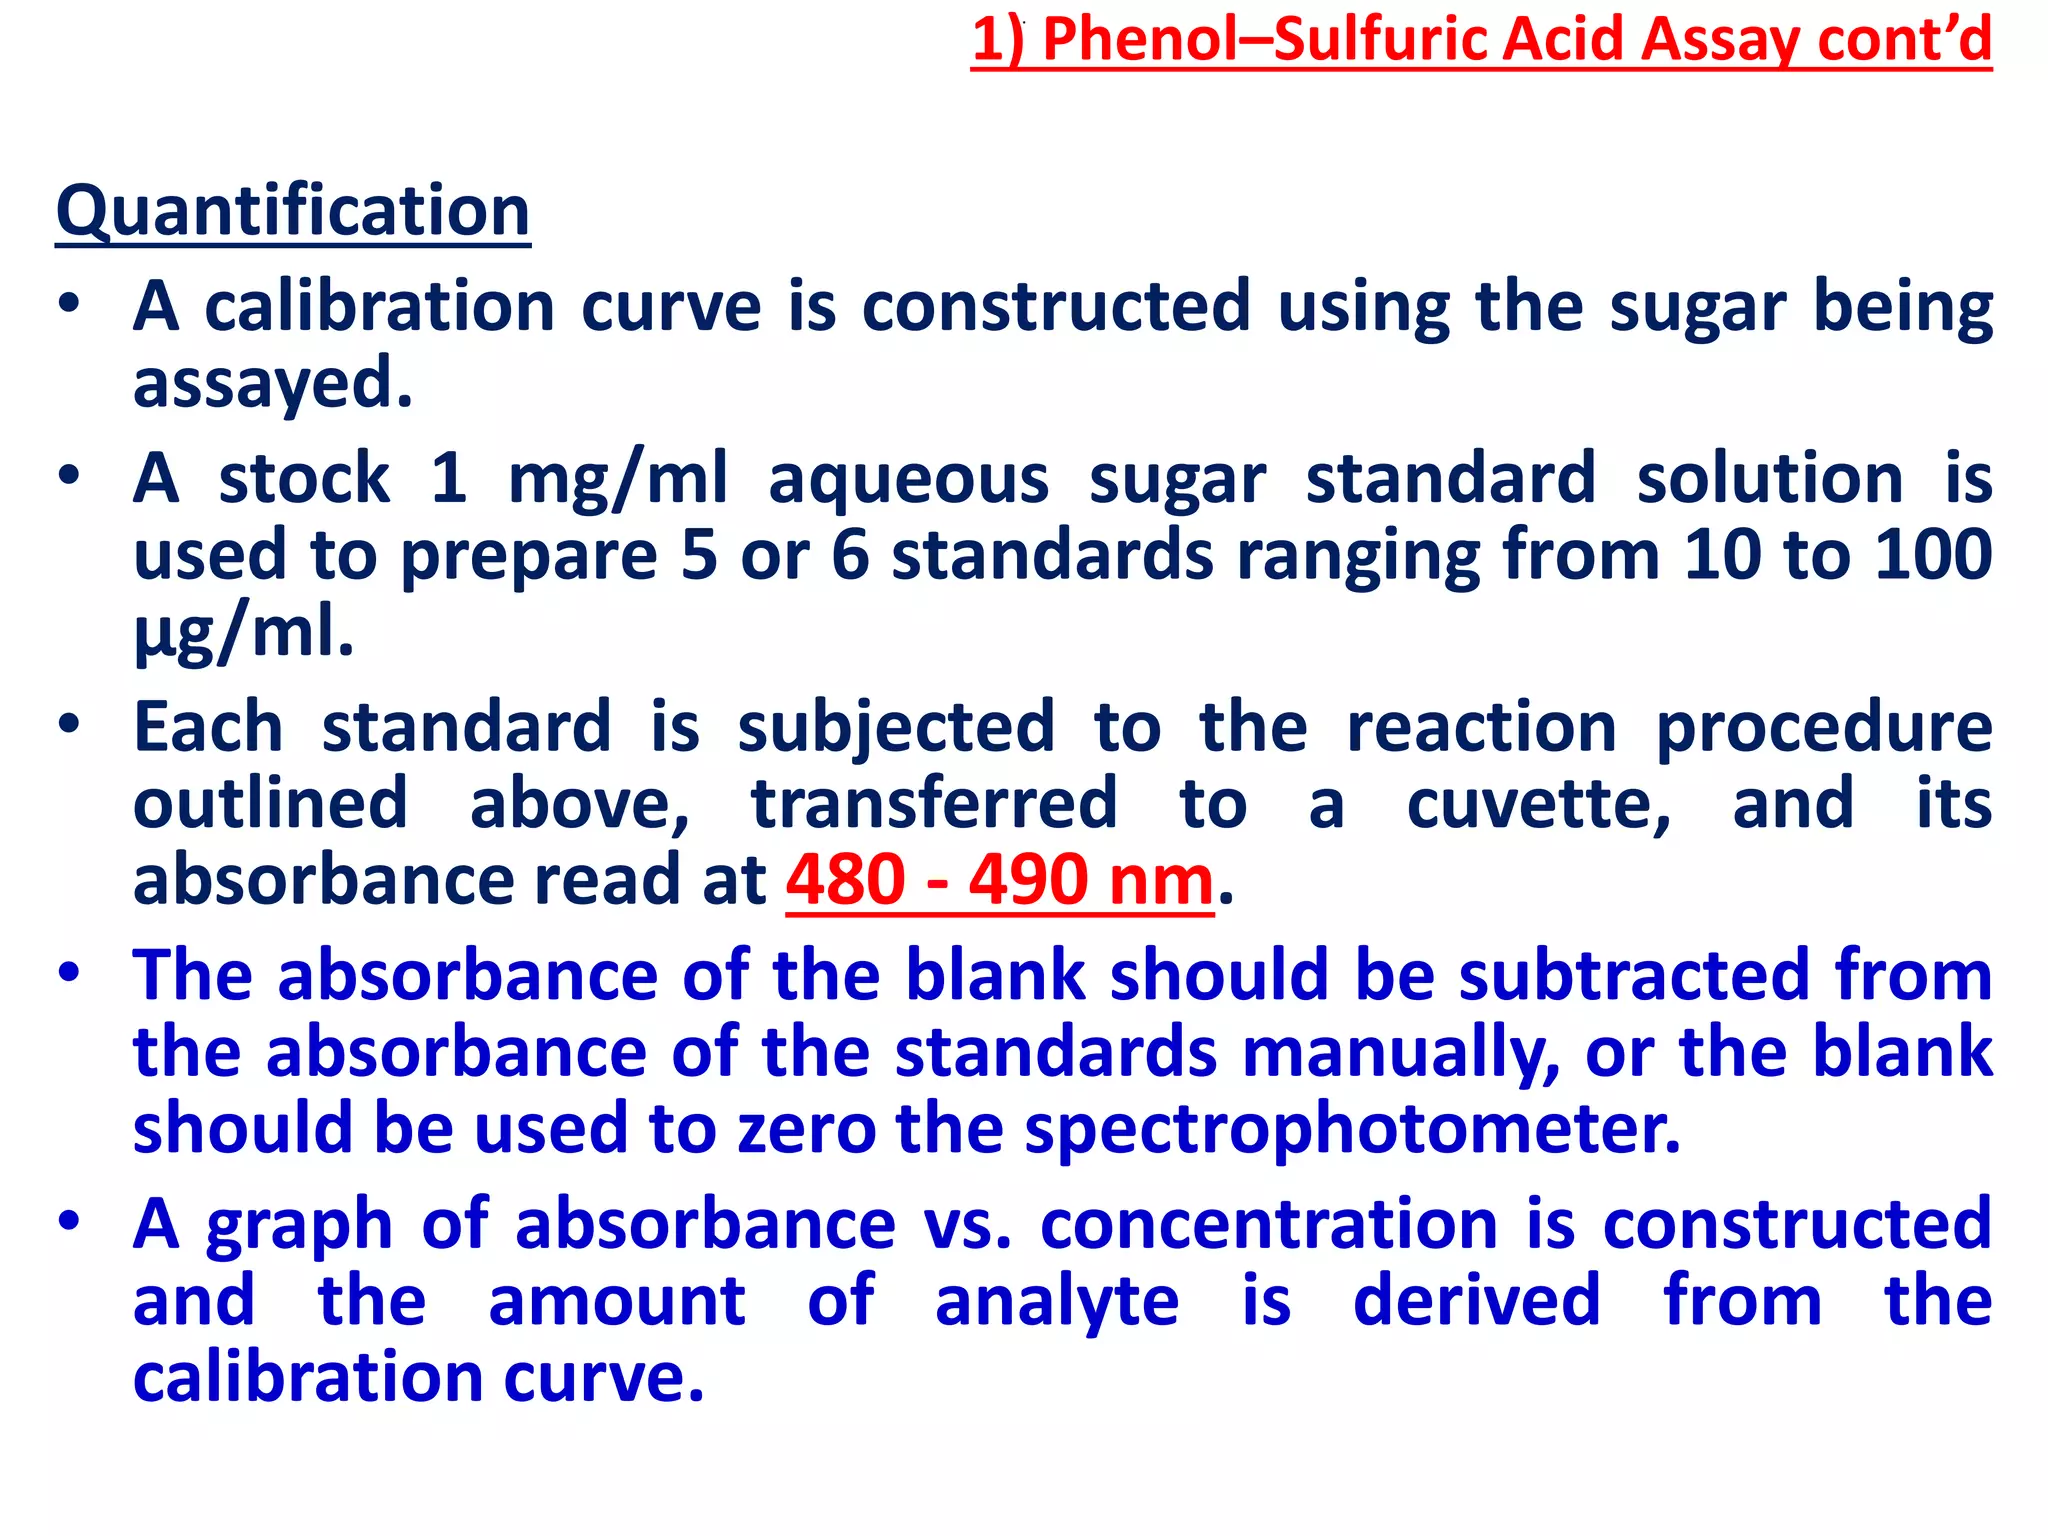
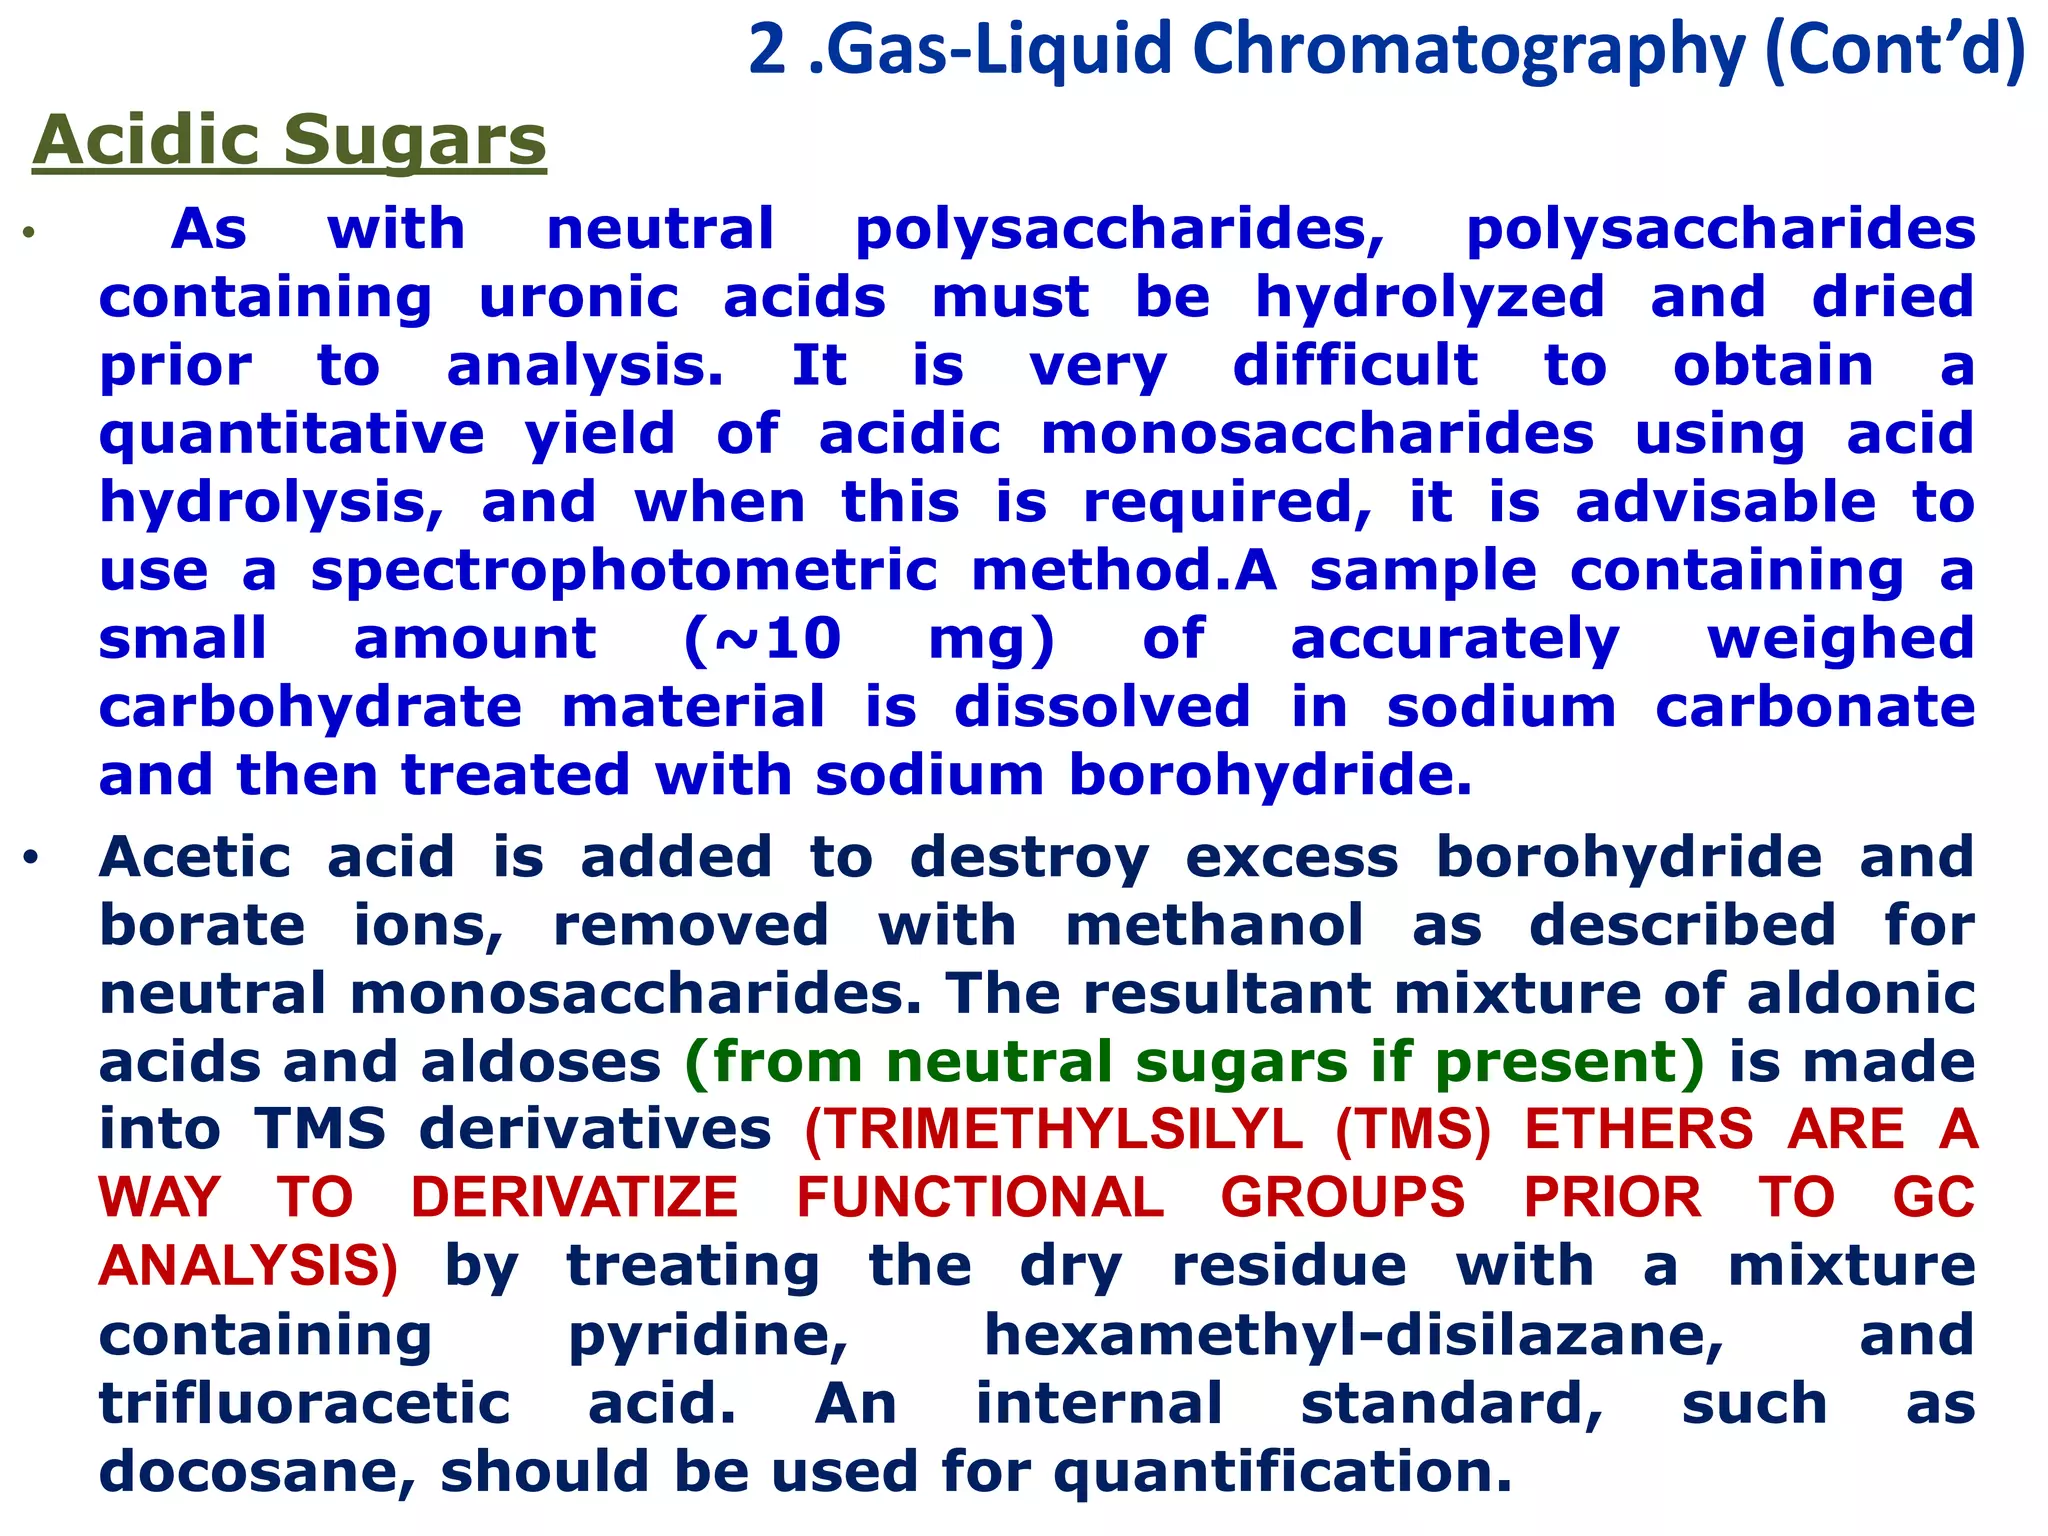
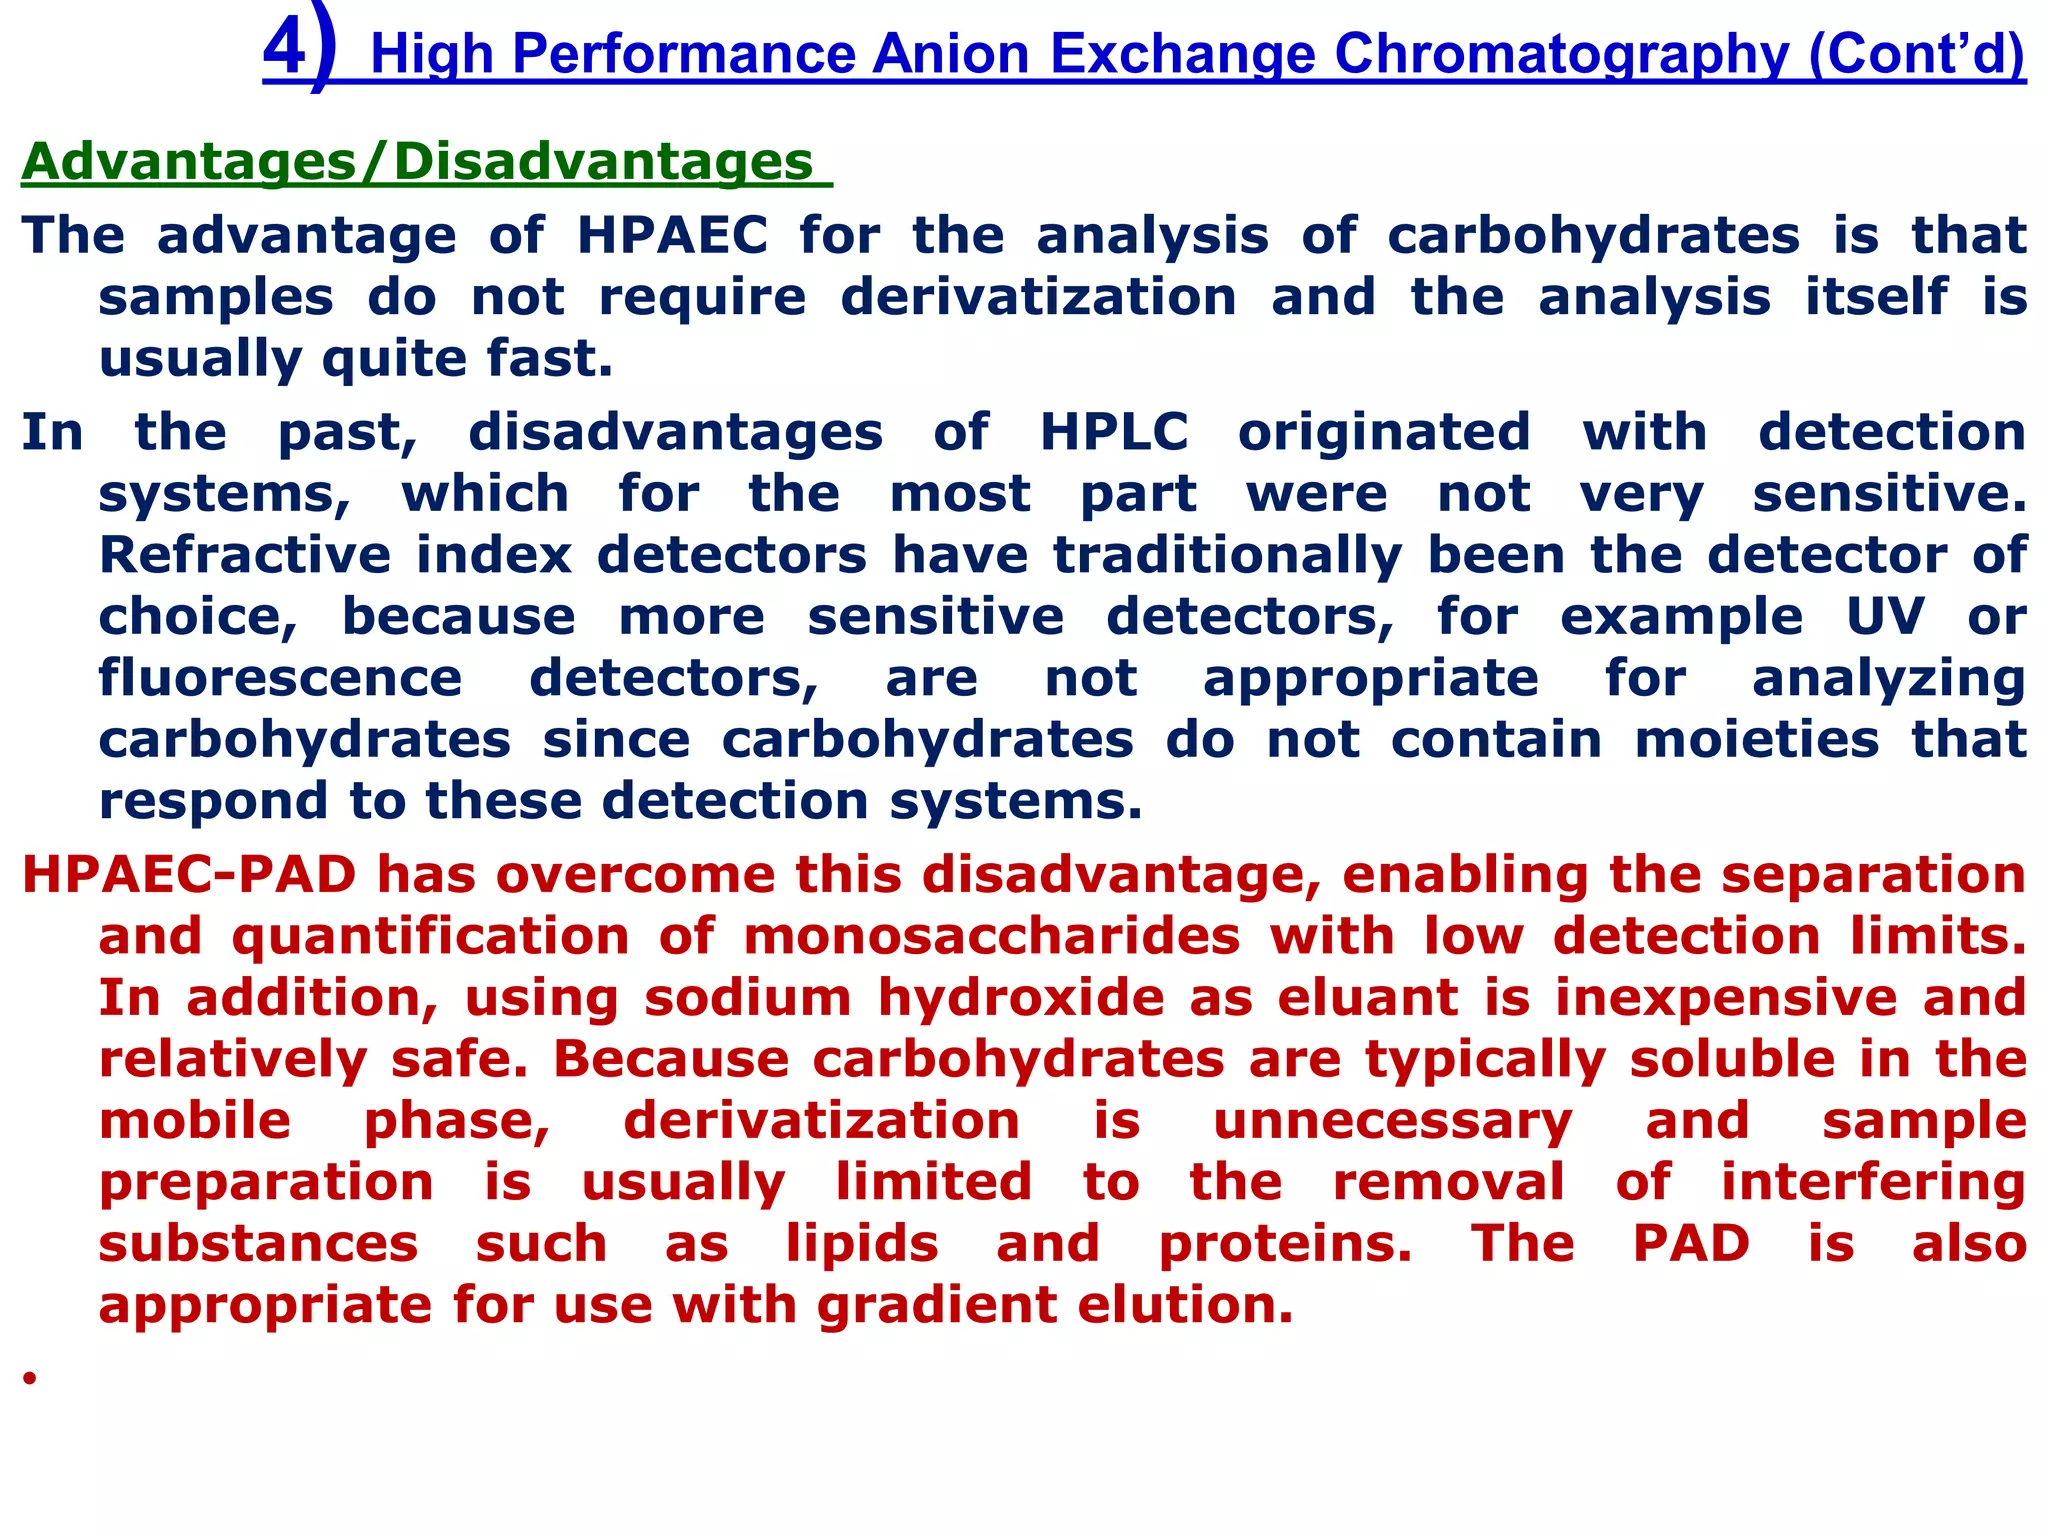
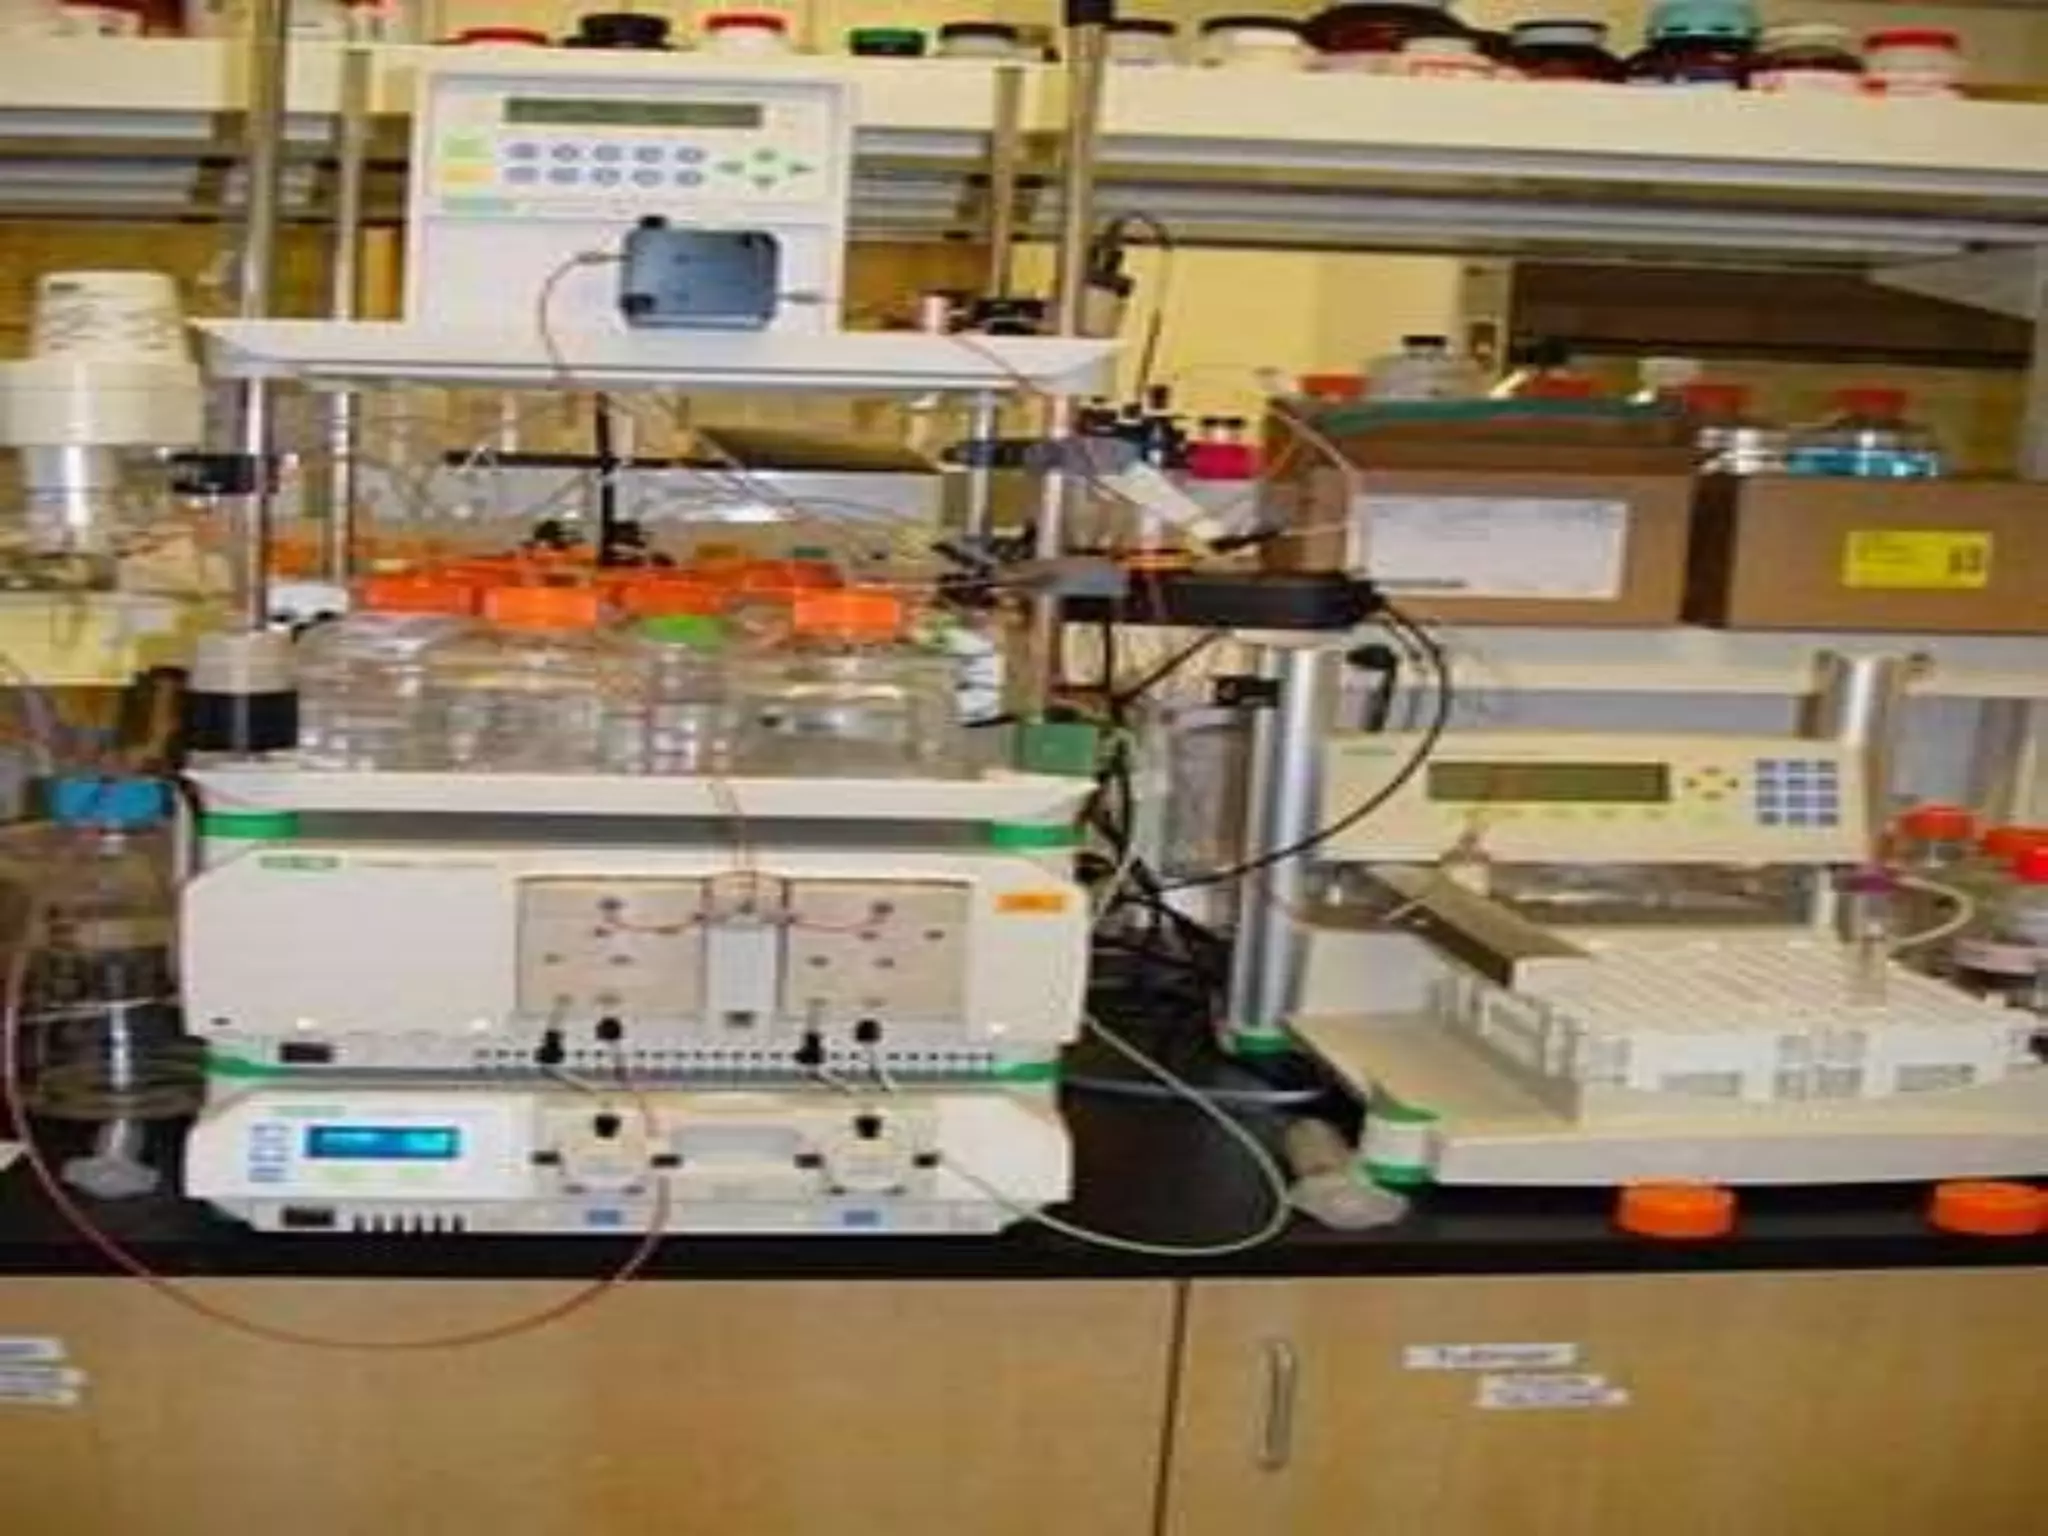
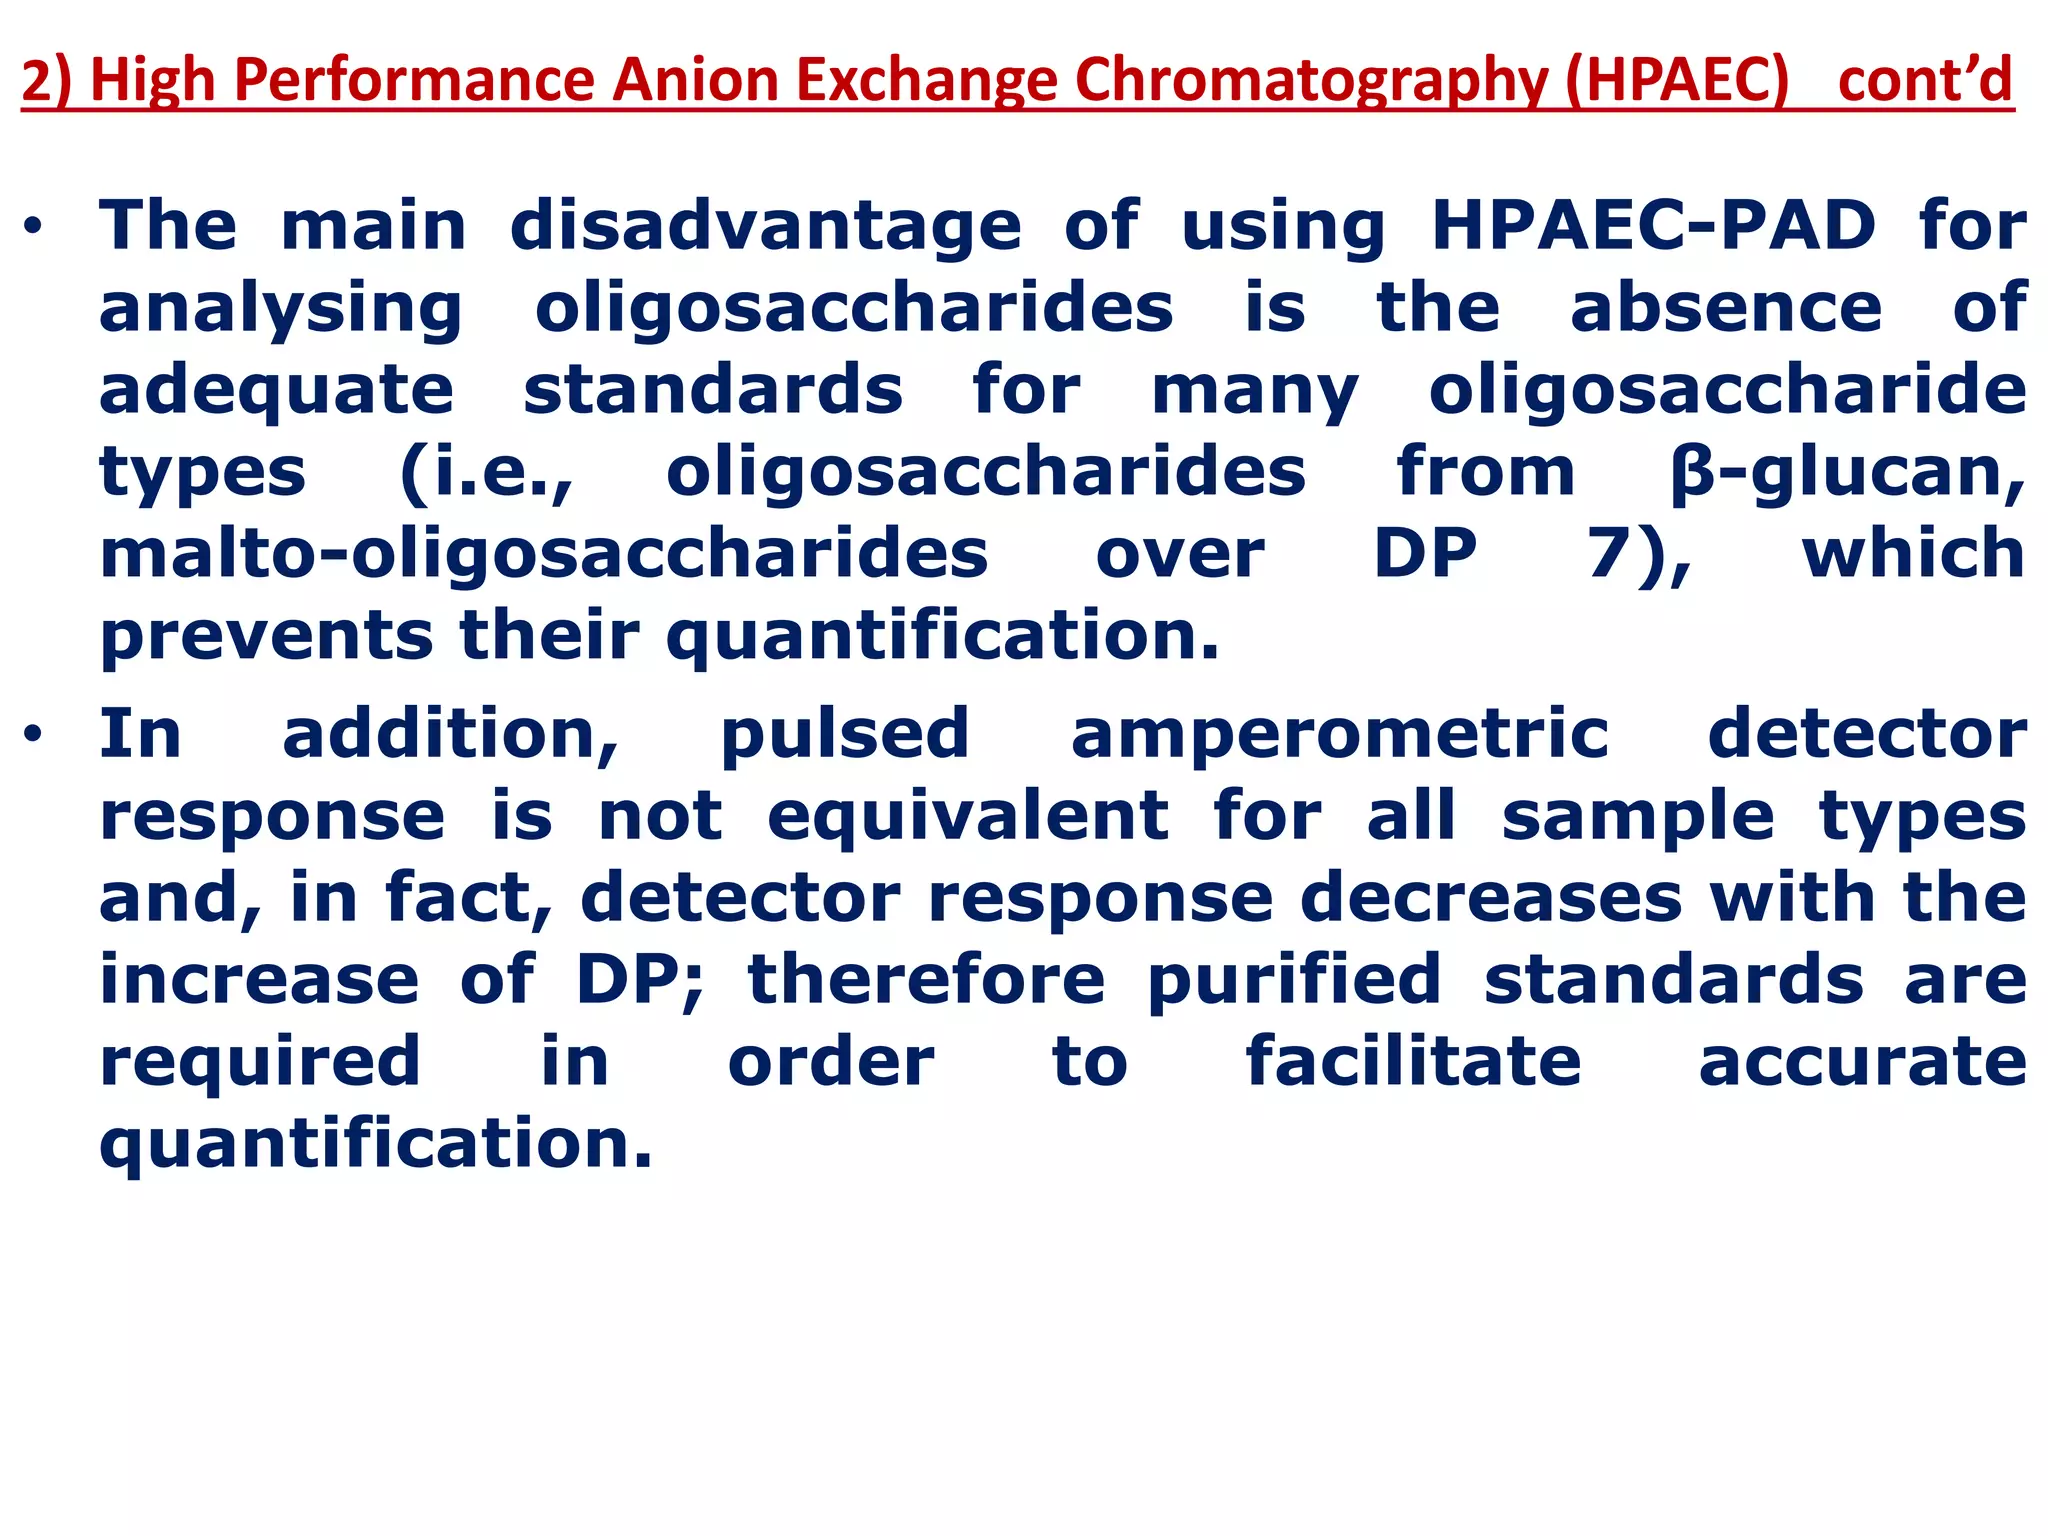
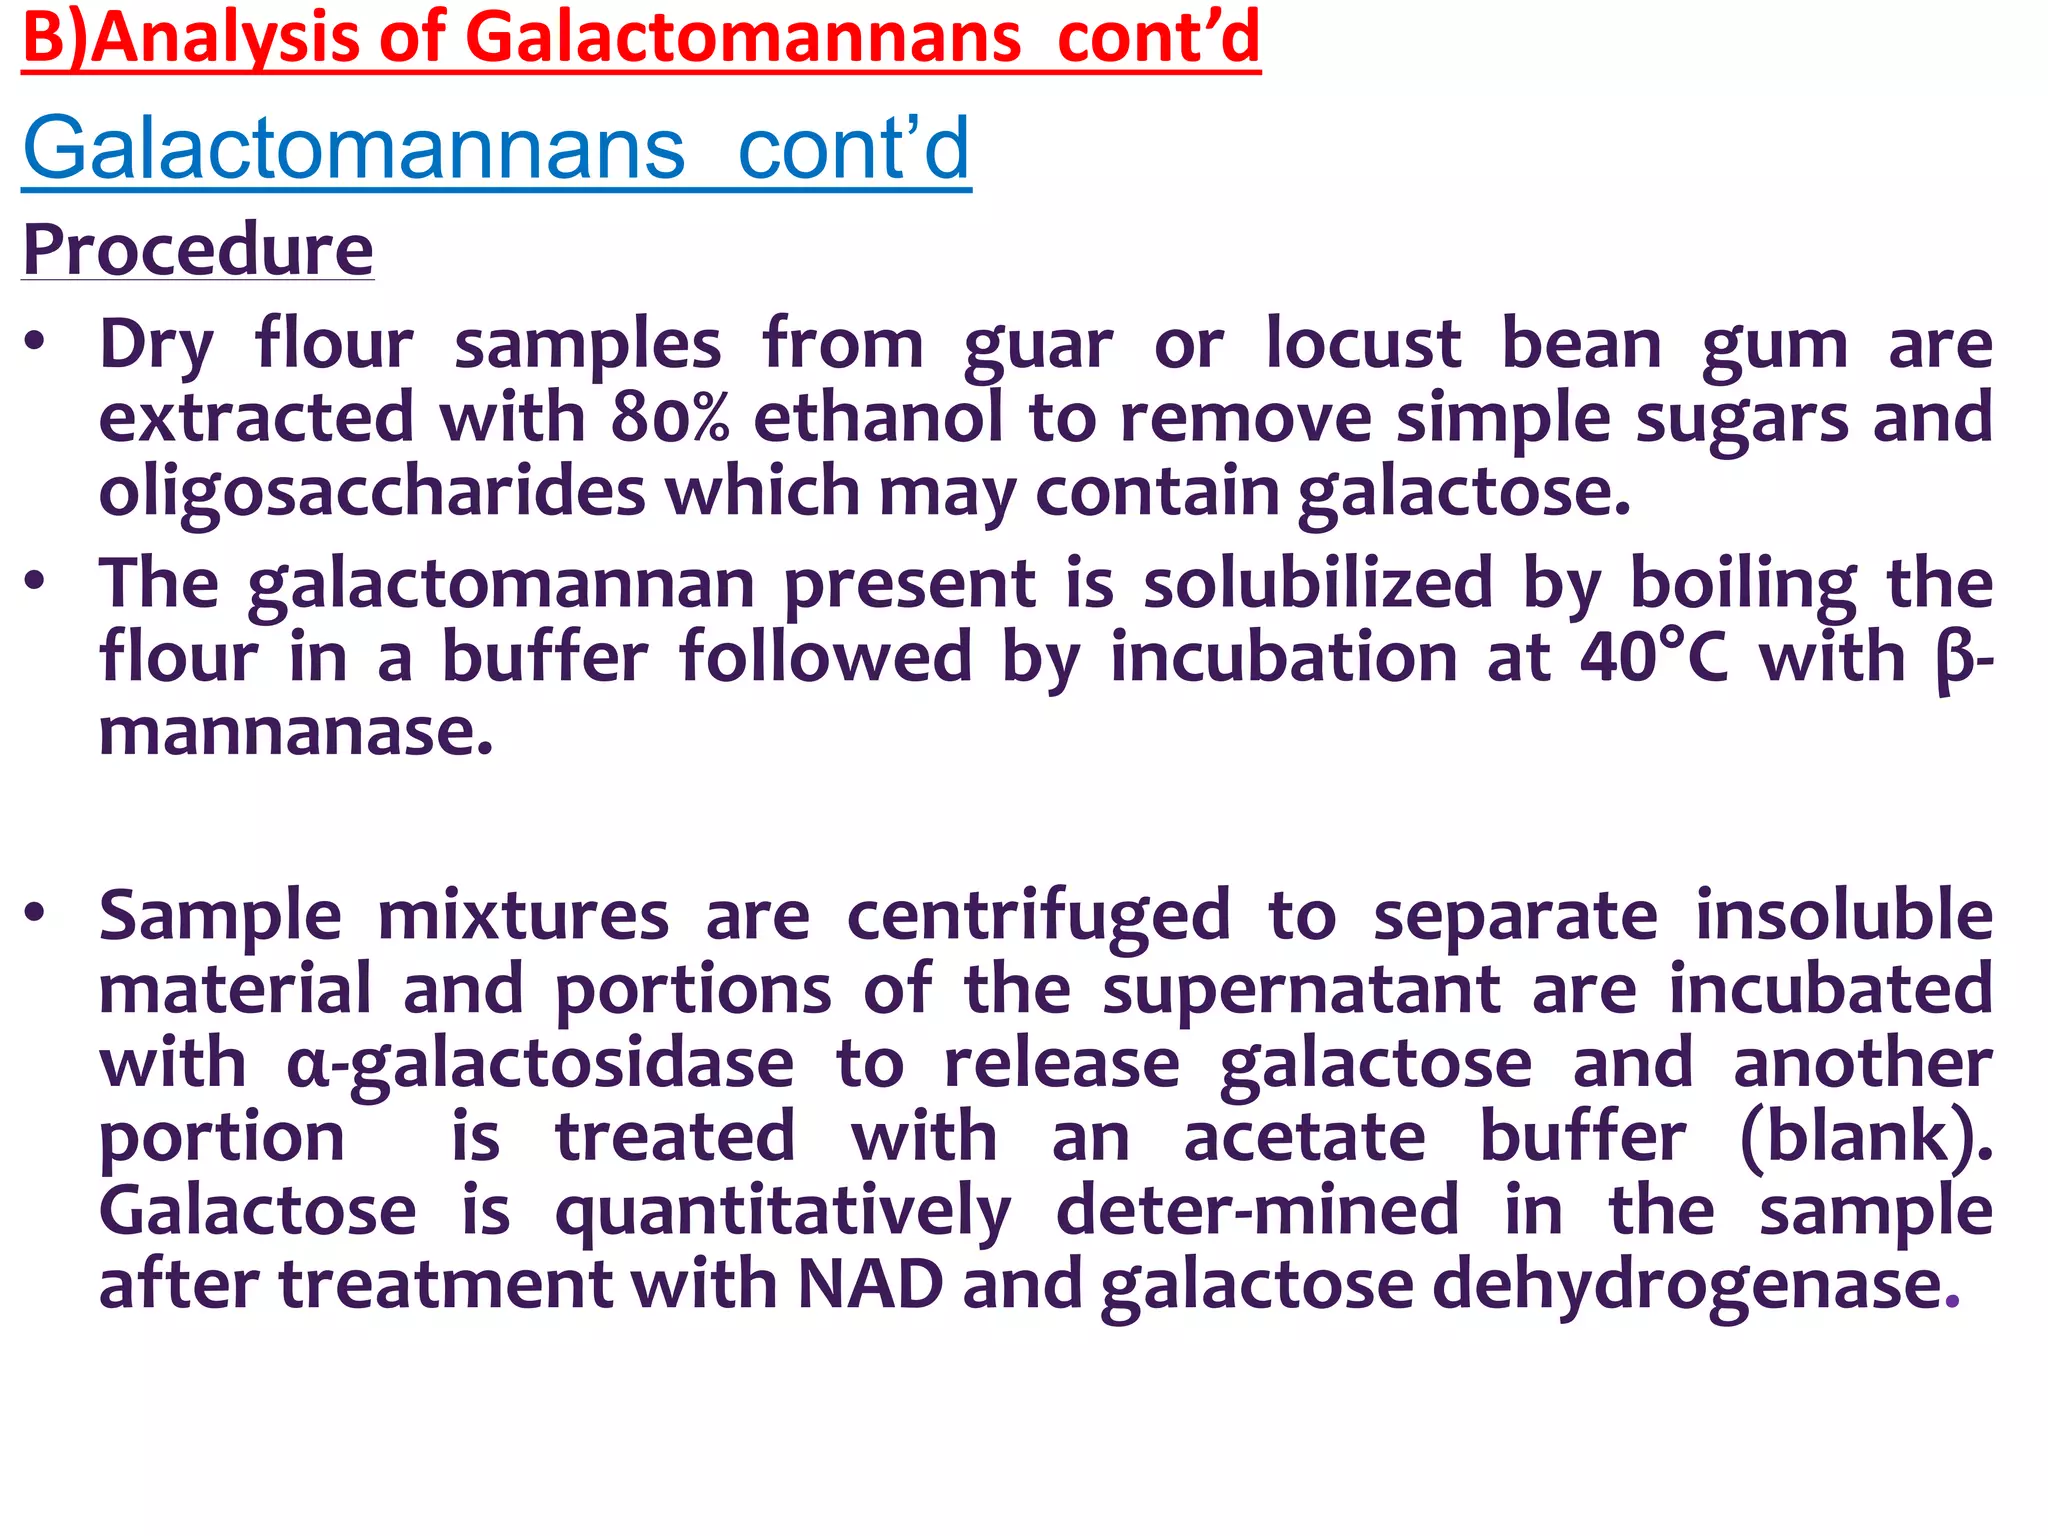
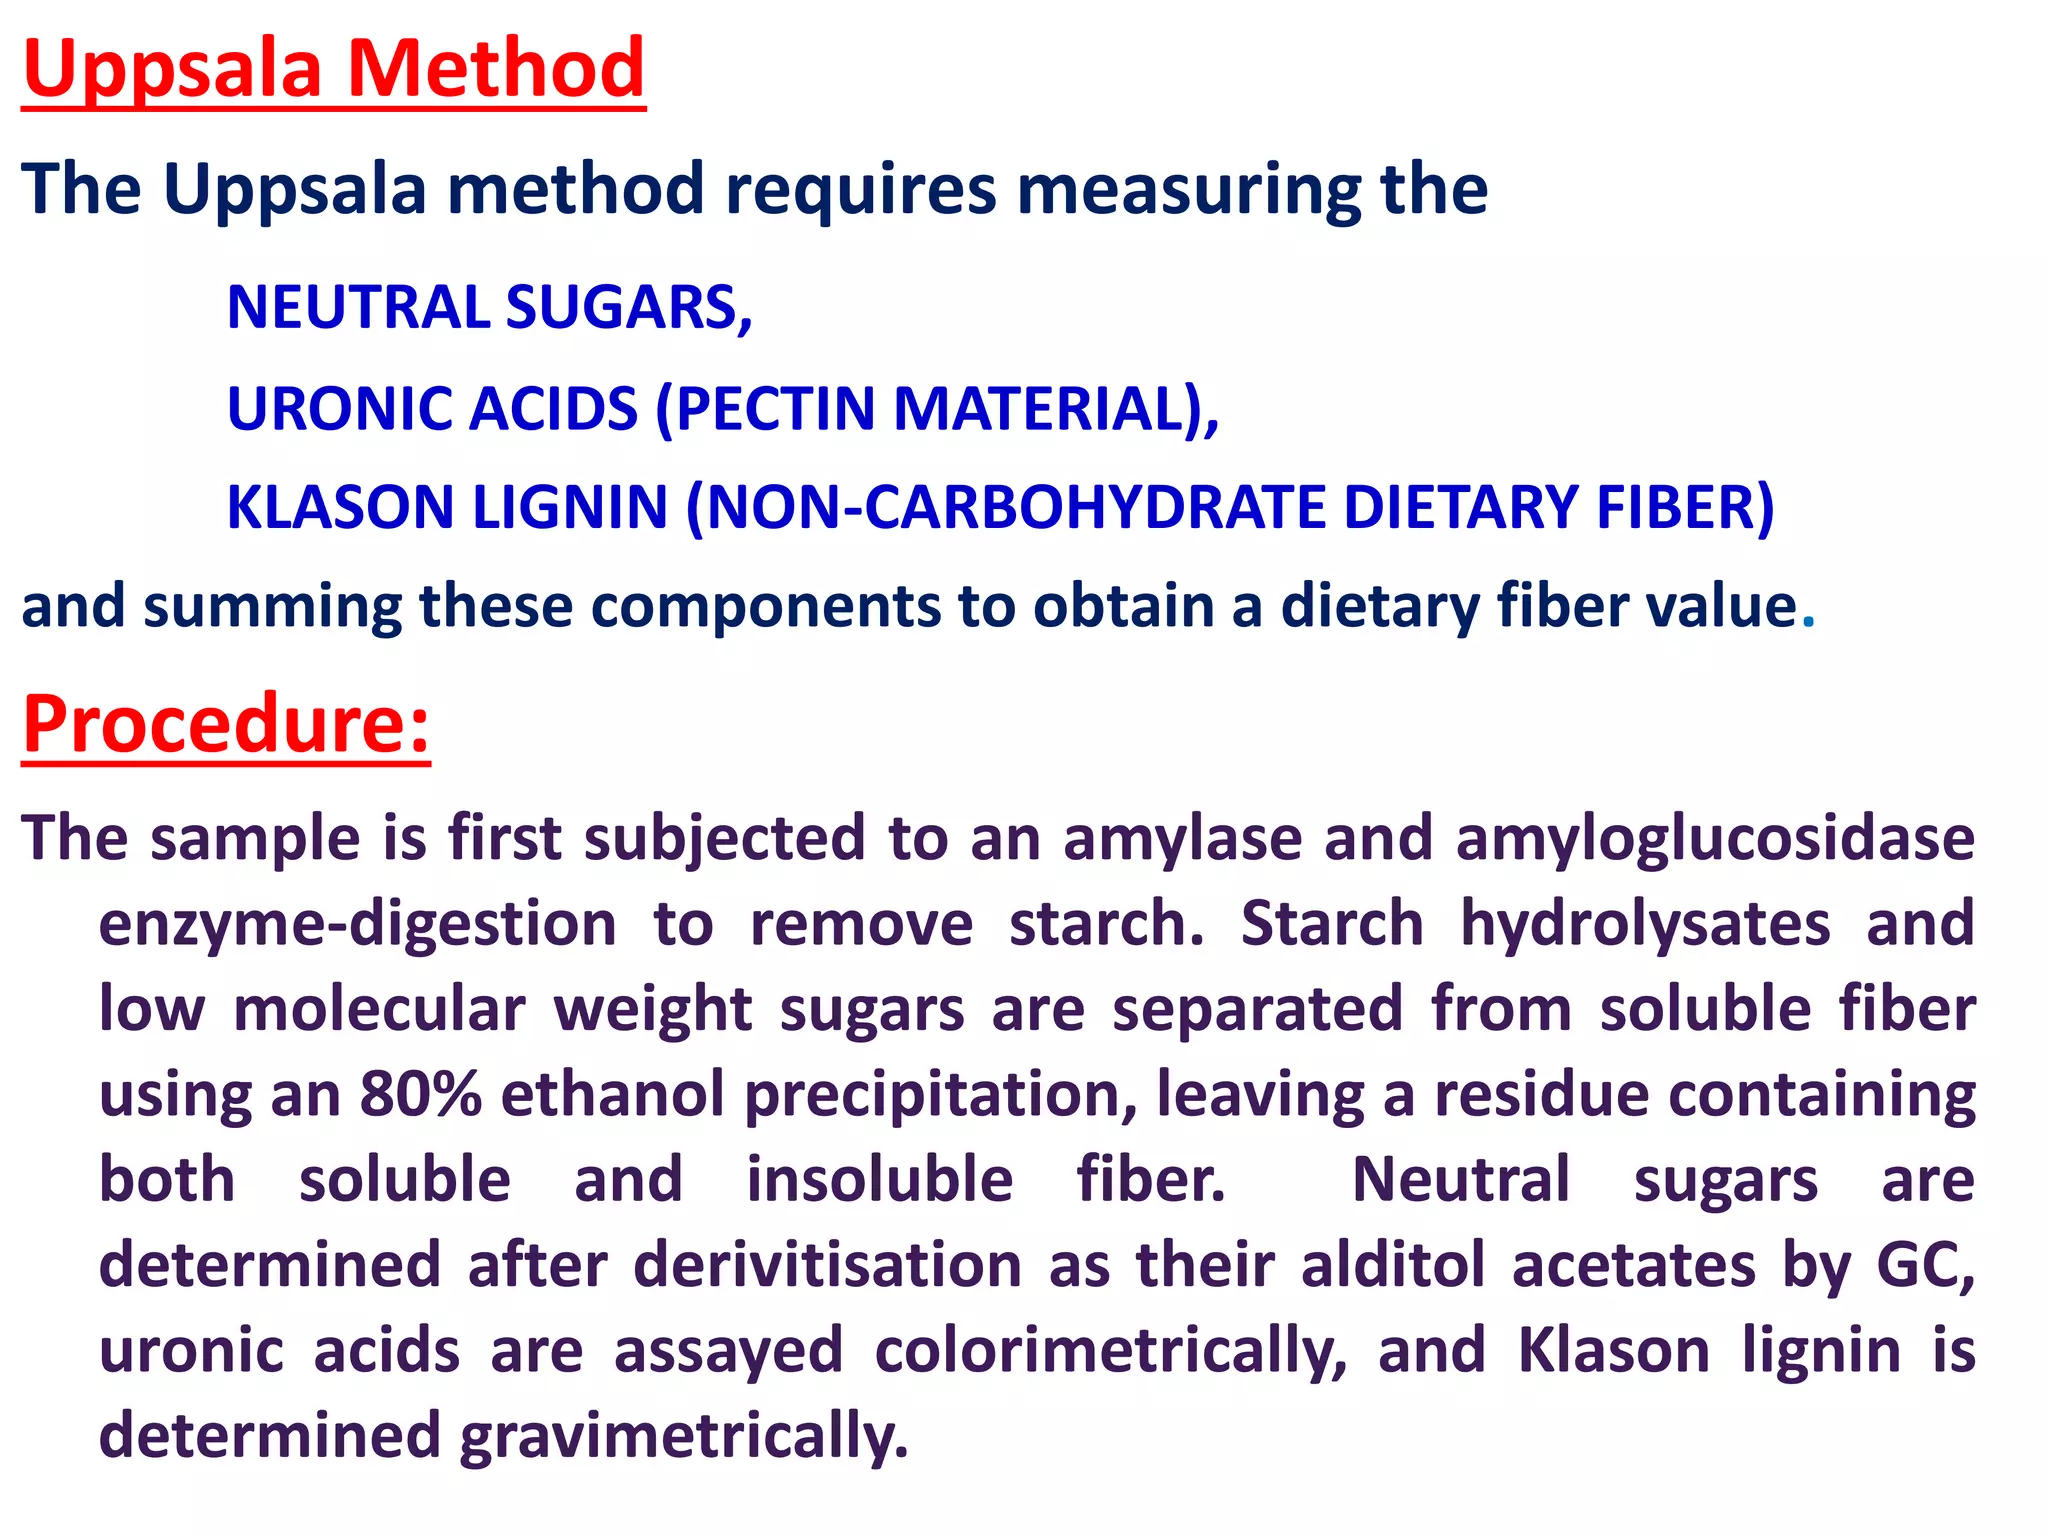
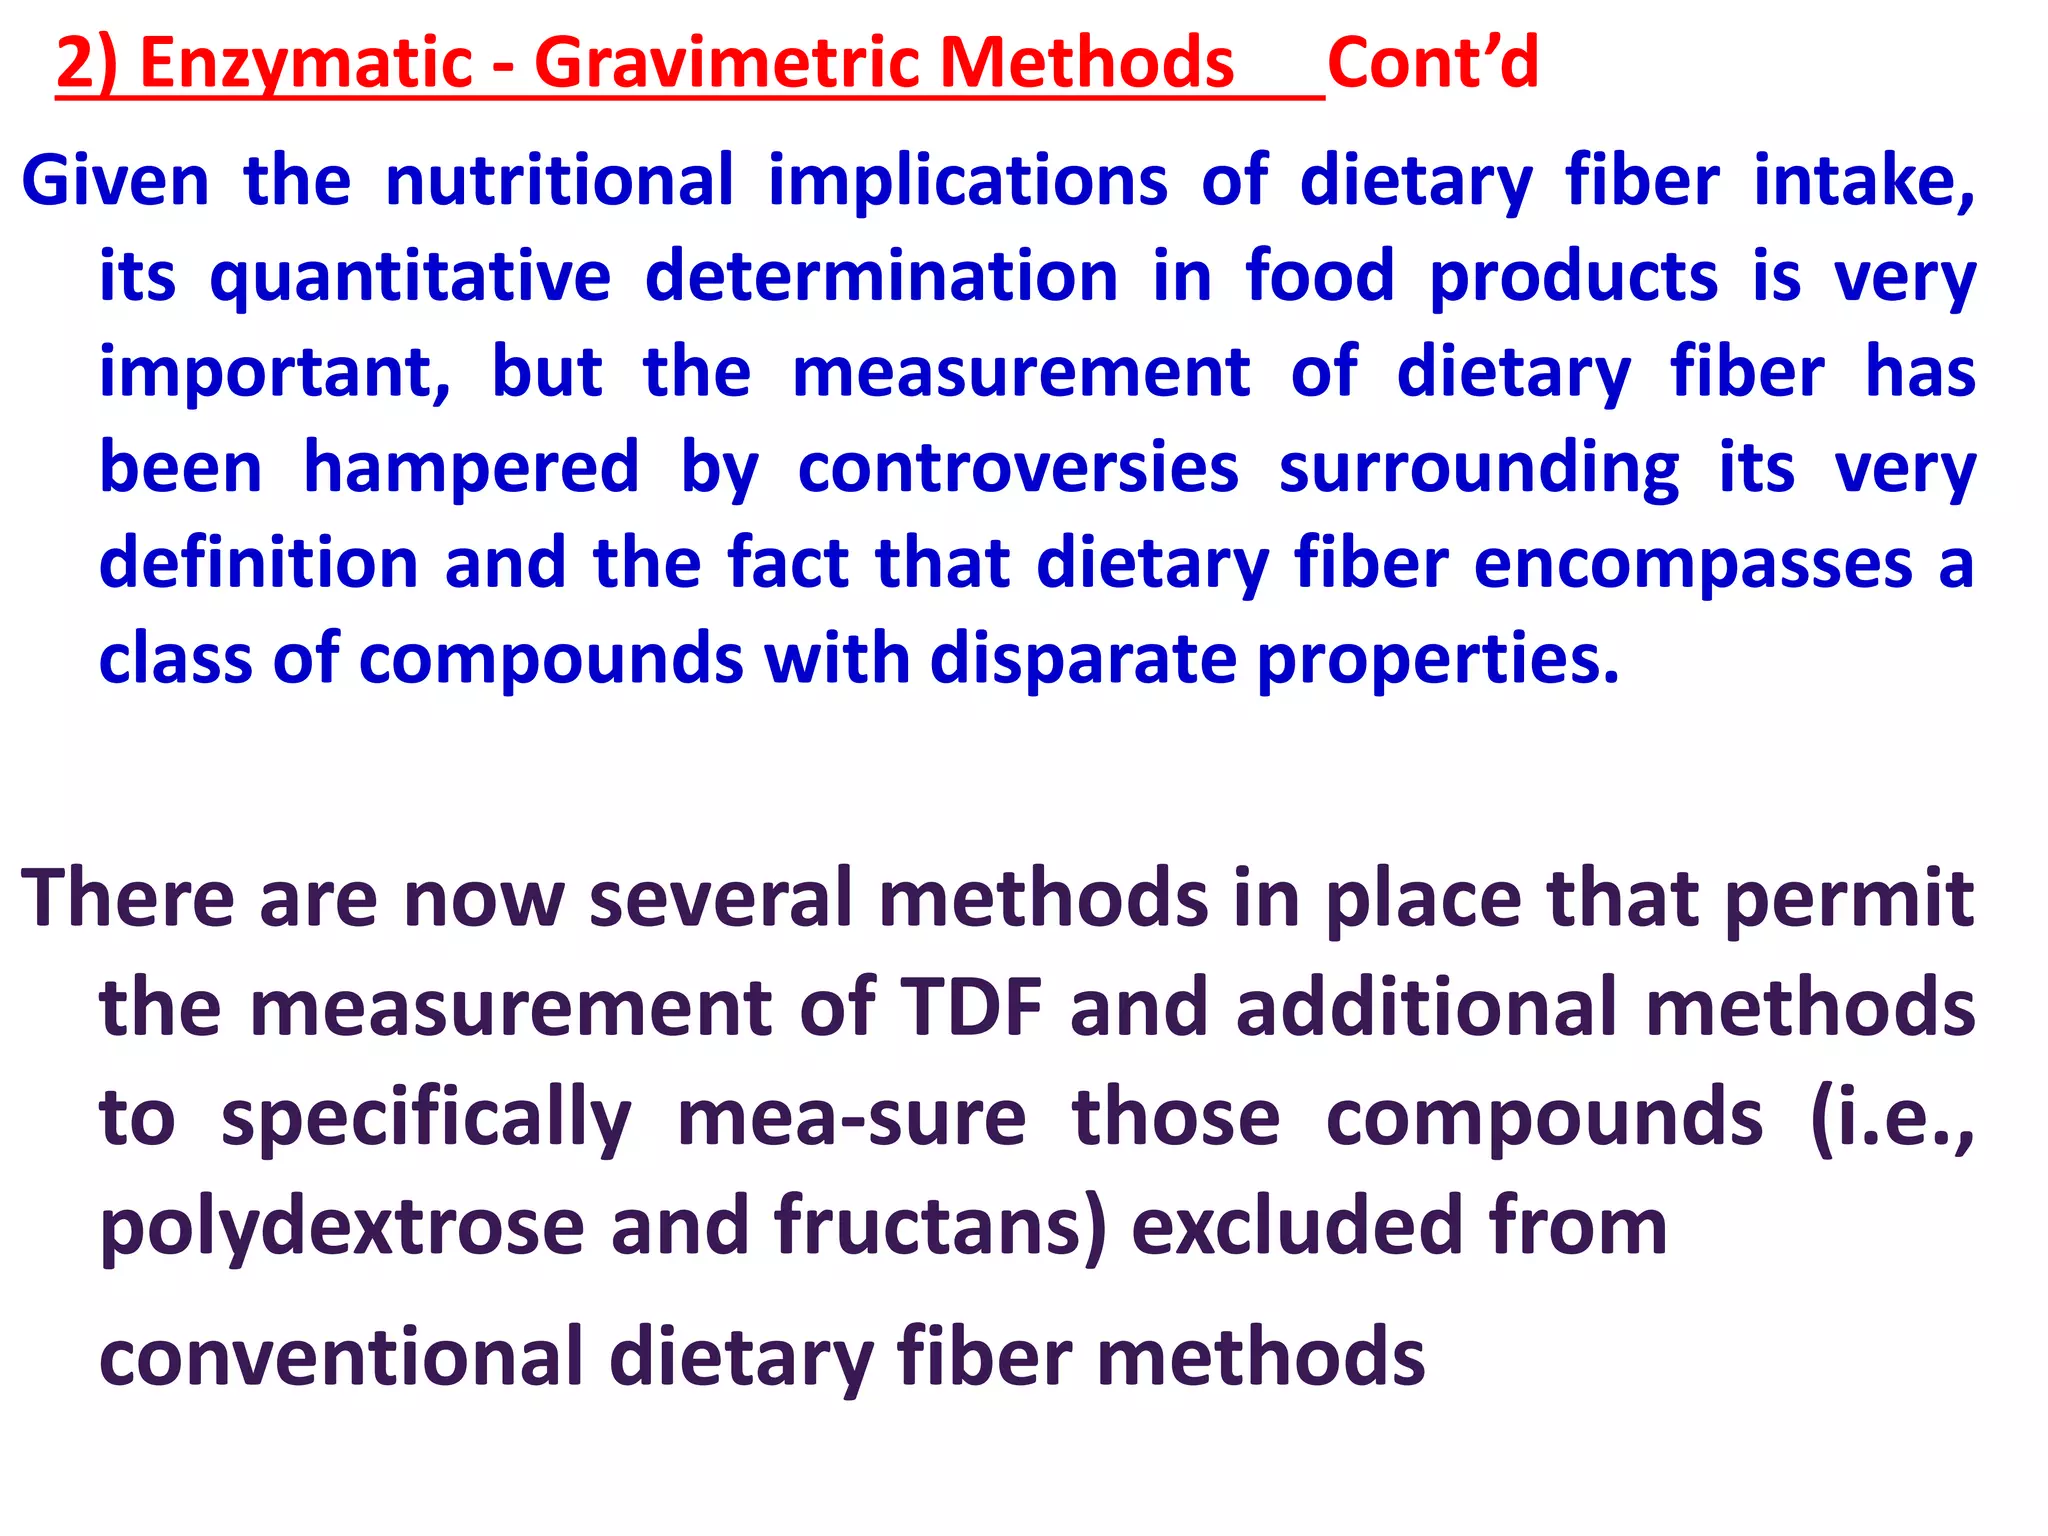
![1)Size Exclusion Chromatography cont’d
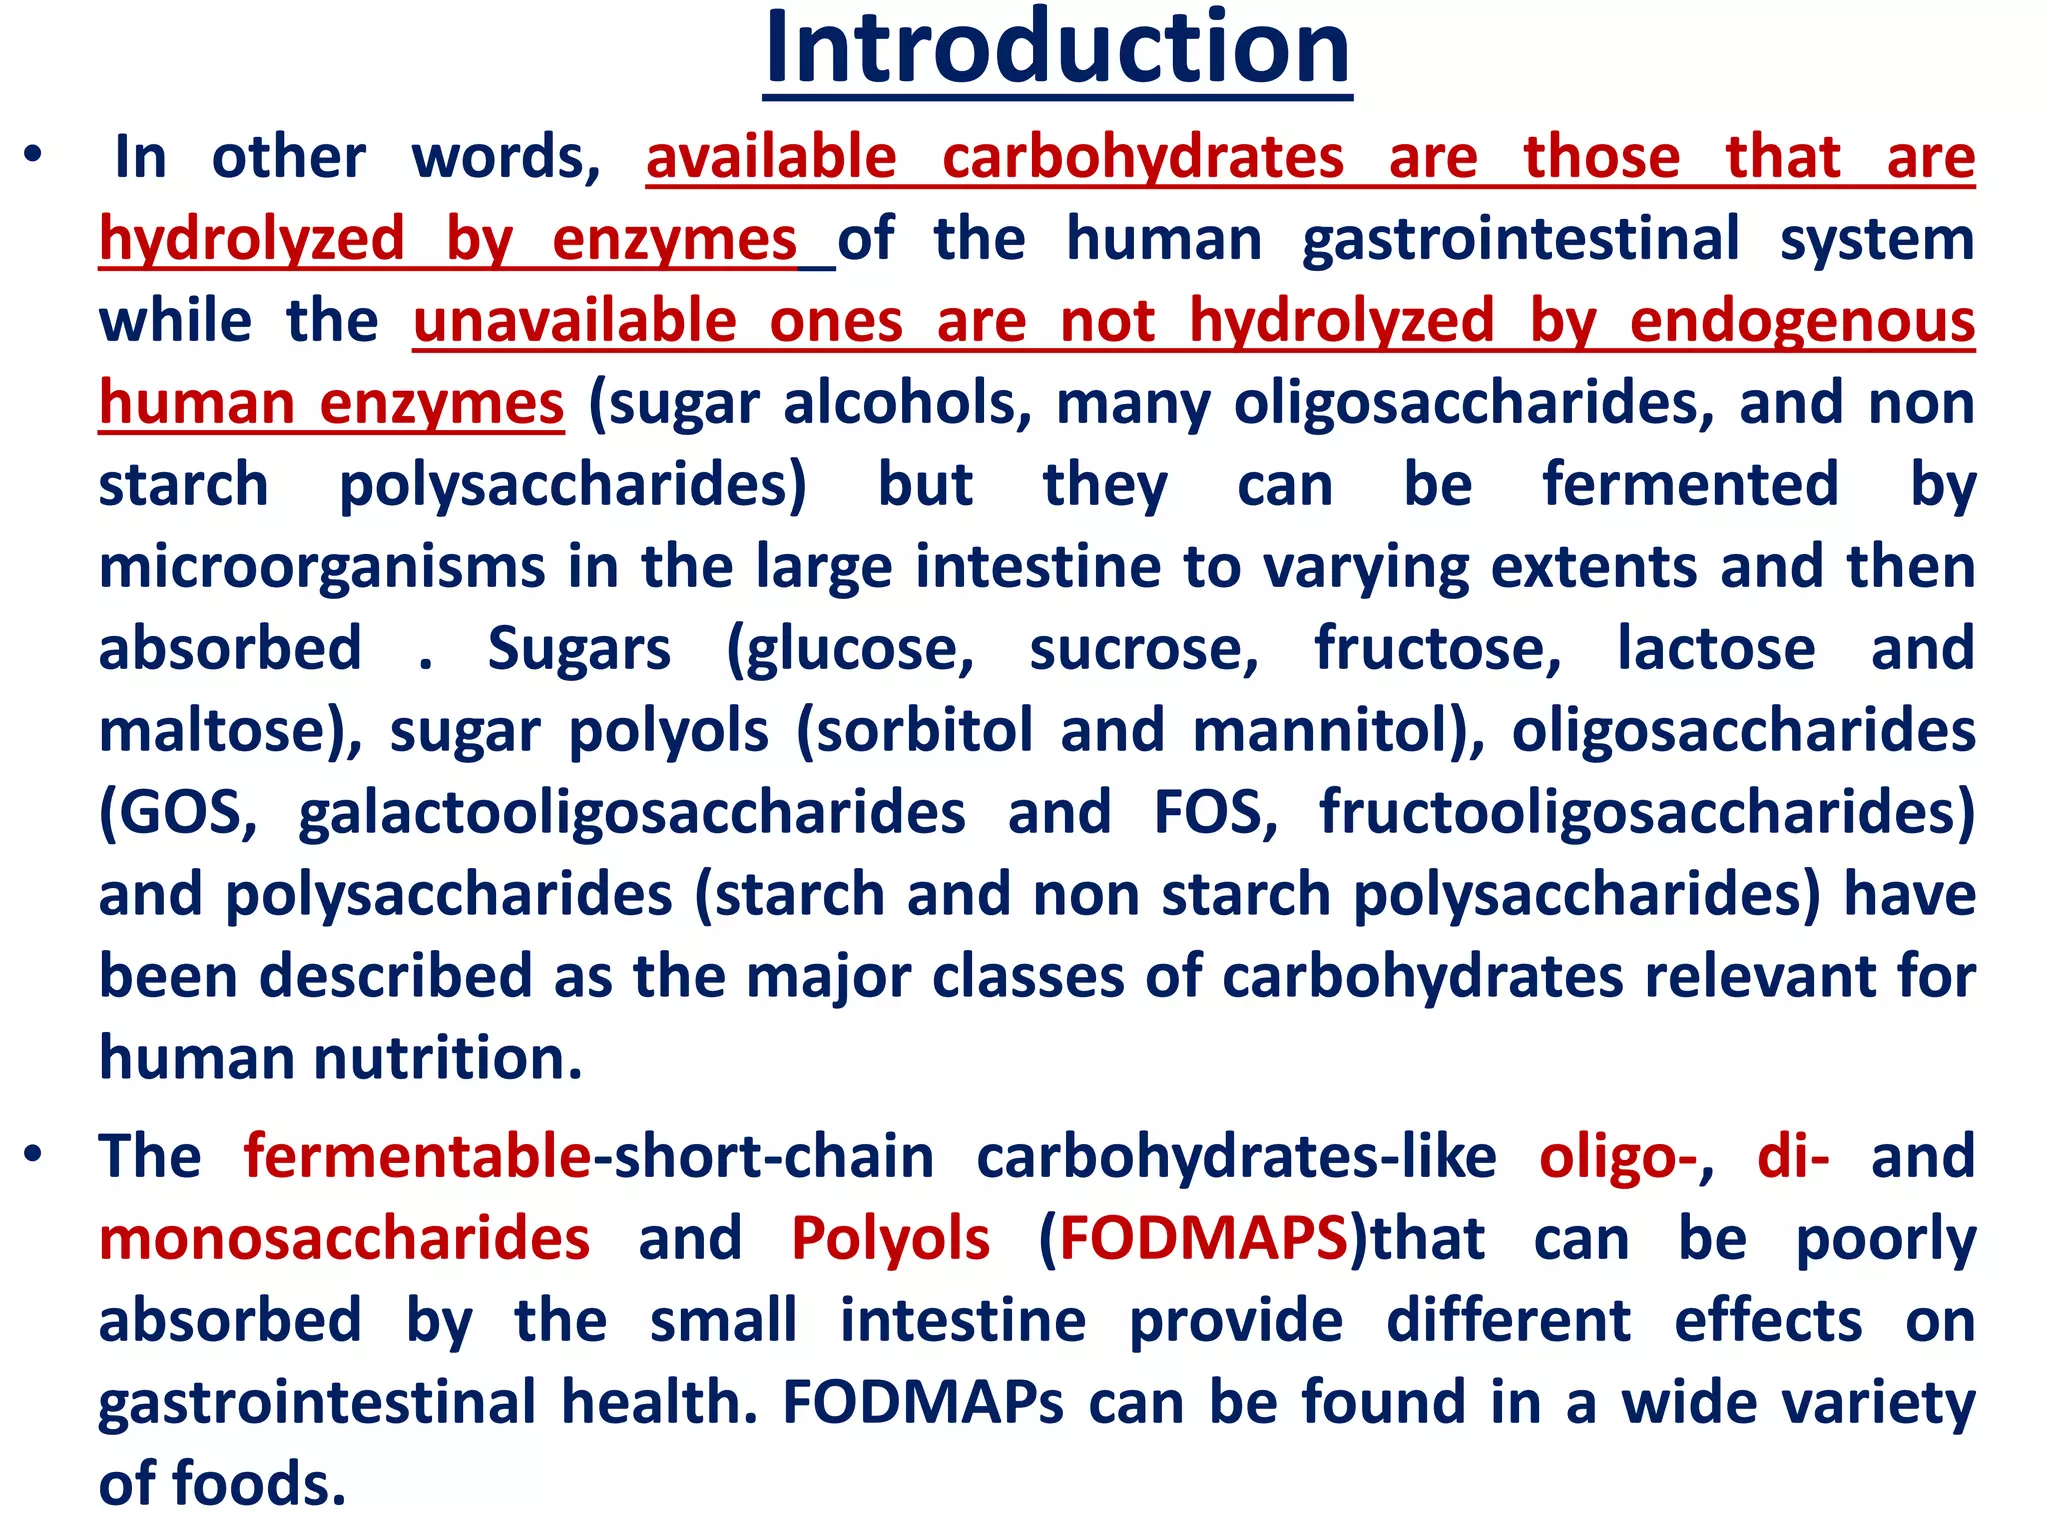
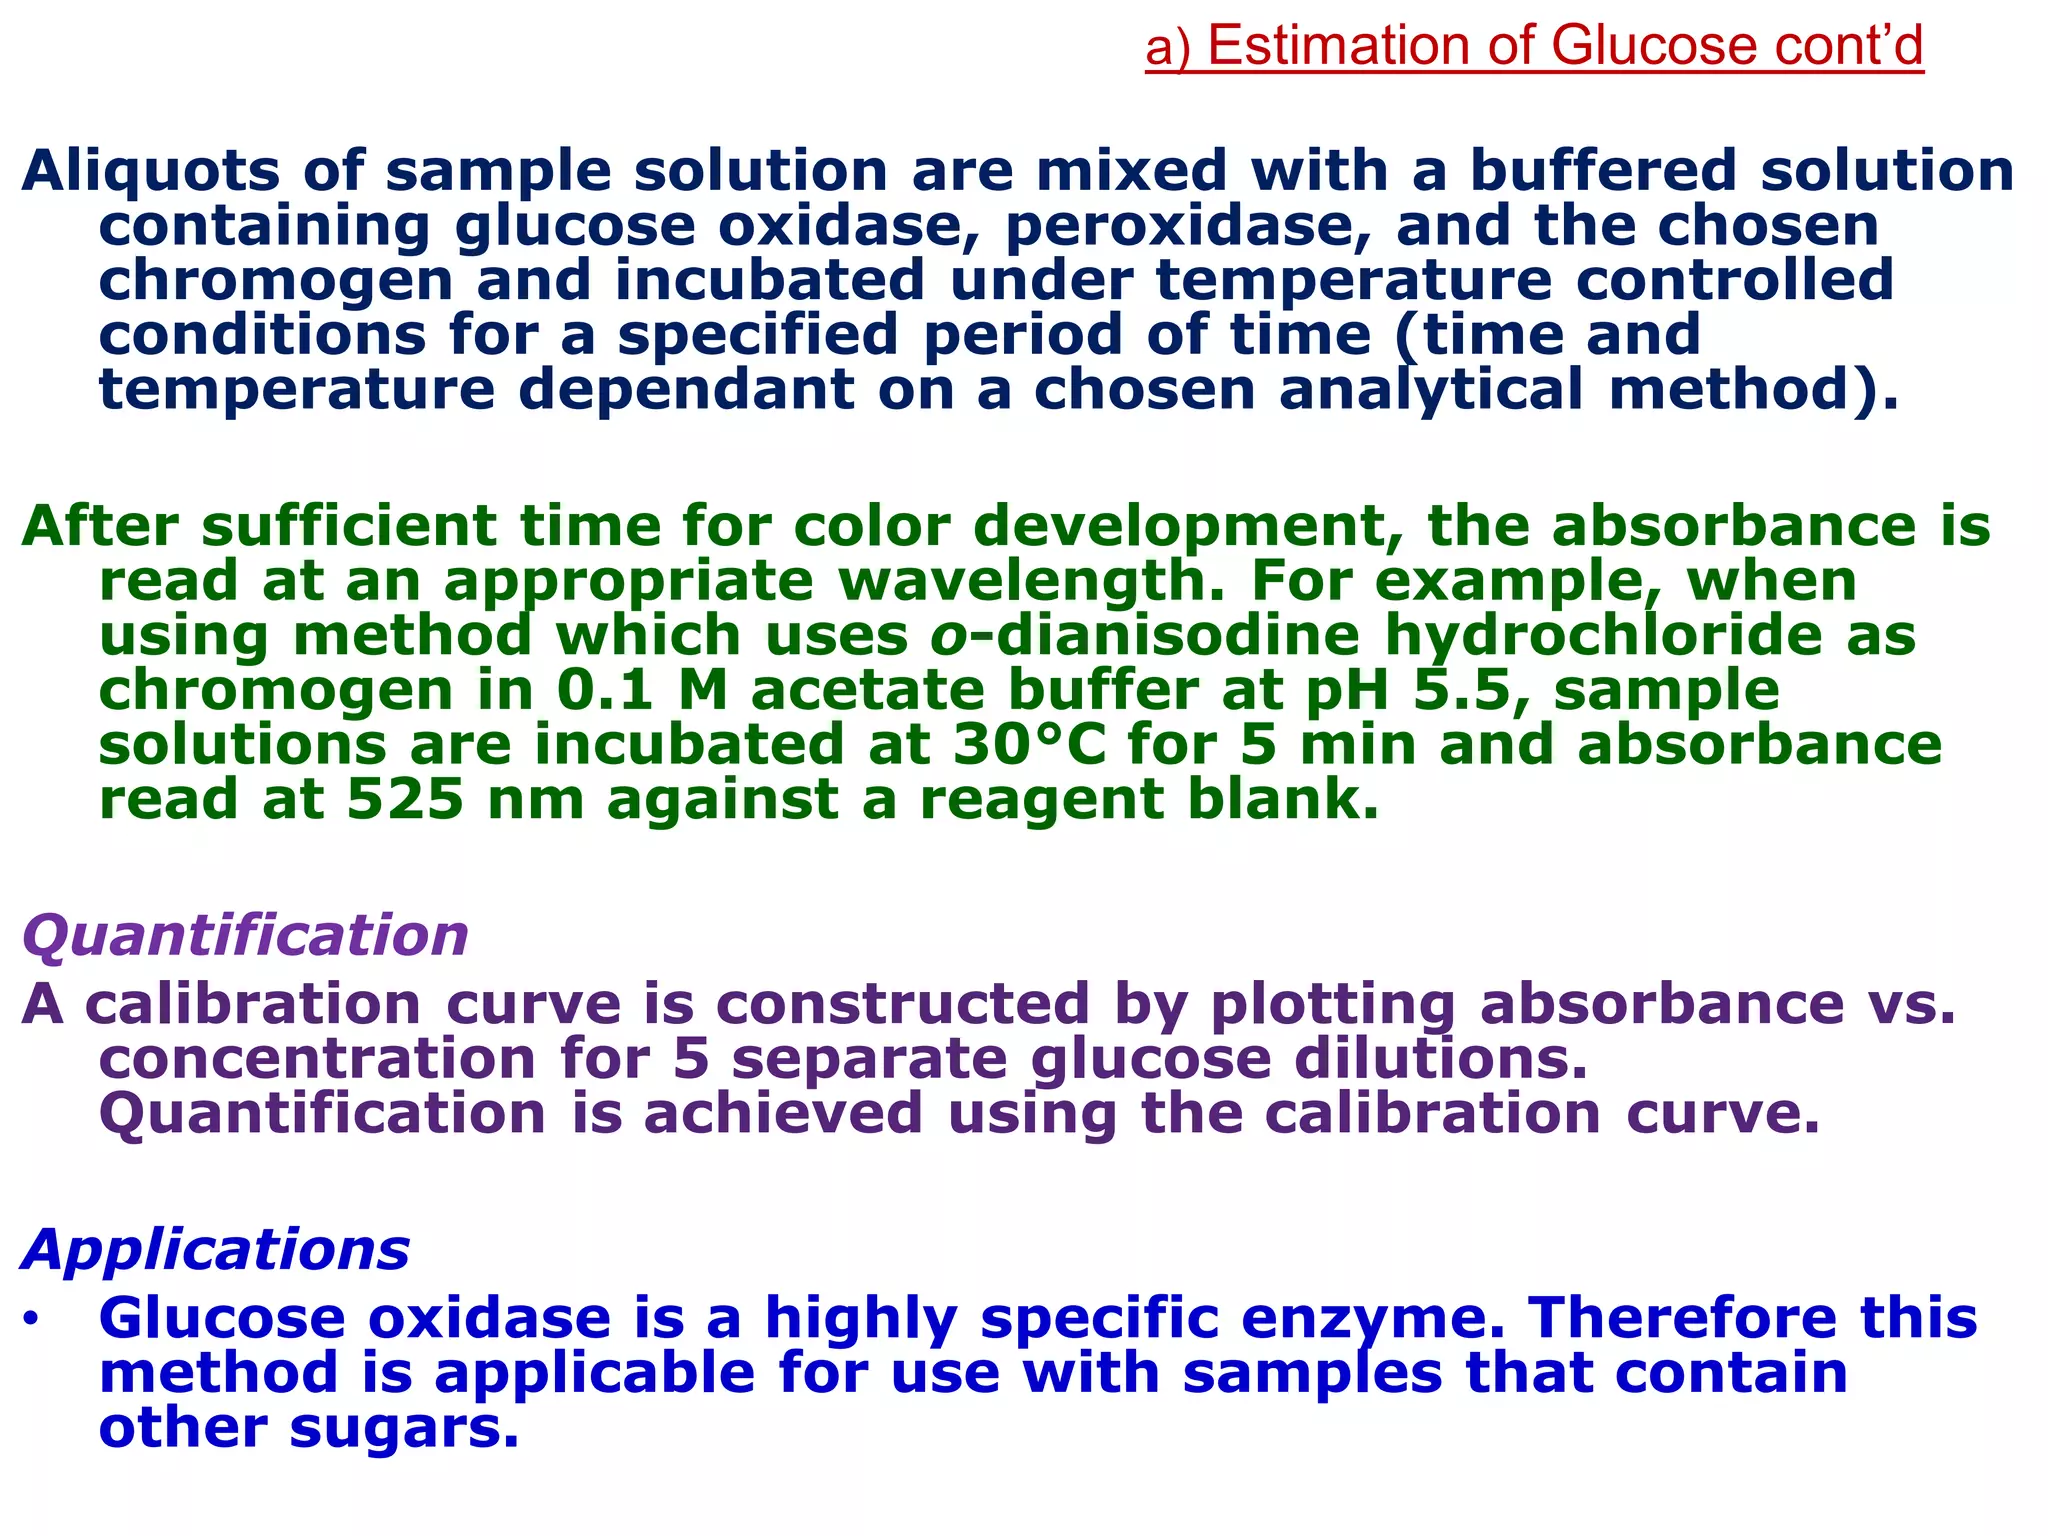
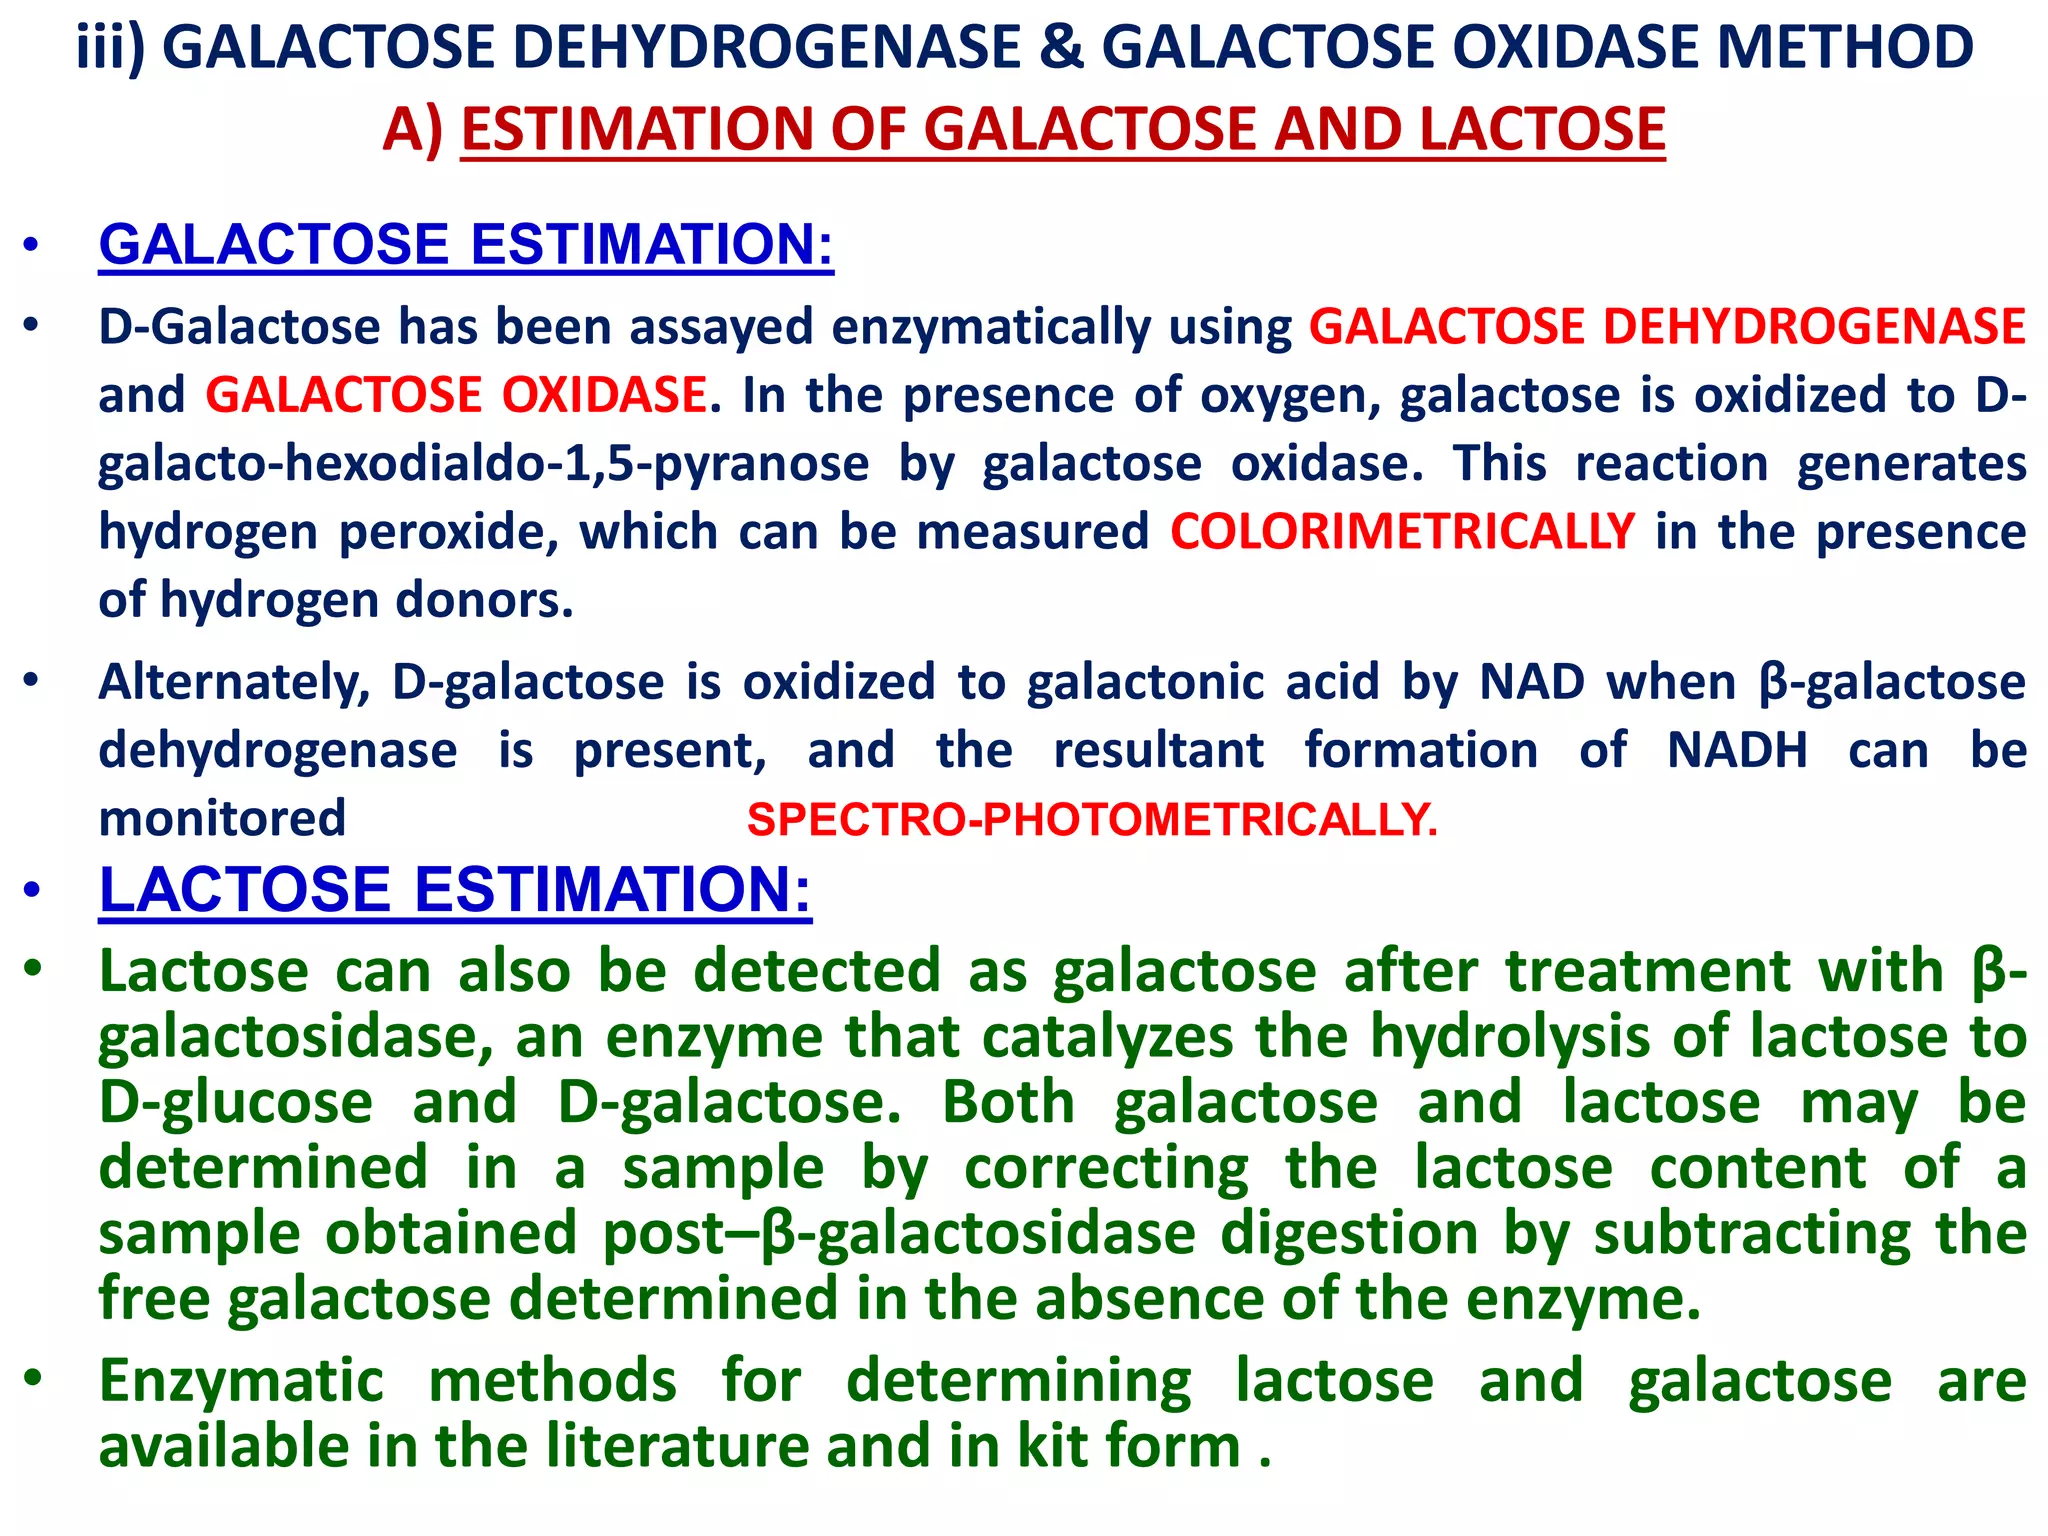
• Size exclusion chromatography has been used as a
method for separating and characterizing mixtures of
oligosaccharides based on size. Dextrins, or starch
hydrolysates, can be rather complex mixtures of
oligosaccharides with the size and proportion of linear
and branched oligomers vary depending on the starting
material (rice starch, corn starch, etc.) and hydrolysis
method (enzymes, acid) even when the DE is the same.
• [DEXTROSE EQUIVALENT VALUE (DE);DEXTRINS WITH DE < 20
ARE NAMED AS MALTODEXTRINS]
• Dextrins [DEXTRINS ARE WATER-SOLUBLE & HYDROLYZED STARCHES]
of DE ranging from 4 to 25 were analyzed on a SEC
system equipped with multi-angle light-scattering
detector, enabling the acquisition of information with
respect to molecular weight distribution.
• In combination with high performance anion exchange
chromatography (HPAEC), which provided information about the
relative occurrence of individual oligosaccharides, SEC coupled
with a molecular weight sensitive detector allowed a more
complete dextrin sample profile than the DE value alone (which
only reflects the number of reducing ends).](https://image.slidesharecdn.com/generalmethodsforanalysisoffoodcarbohydrates-200224104841/75/General-methods-for-analysis-of-food-carbohydrates-77-2048.jpg)


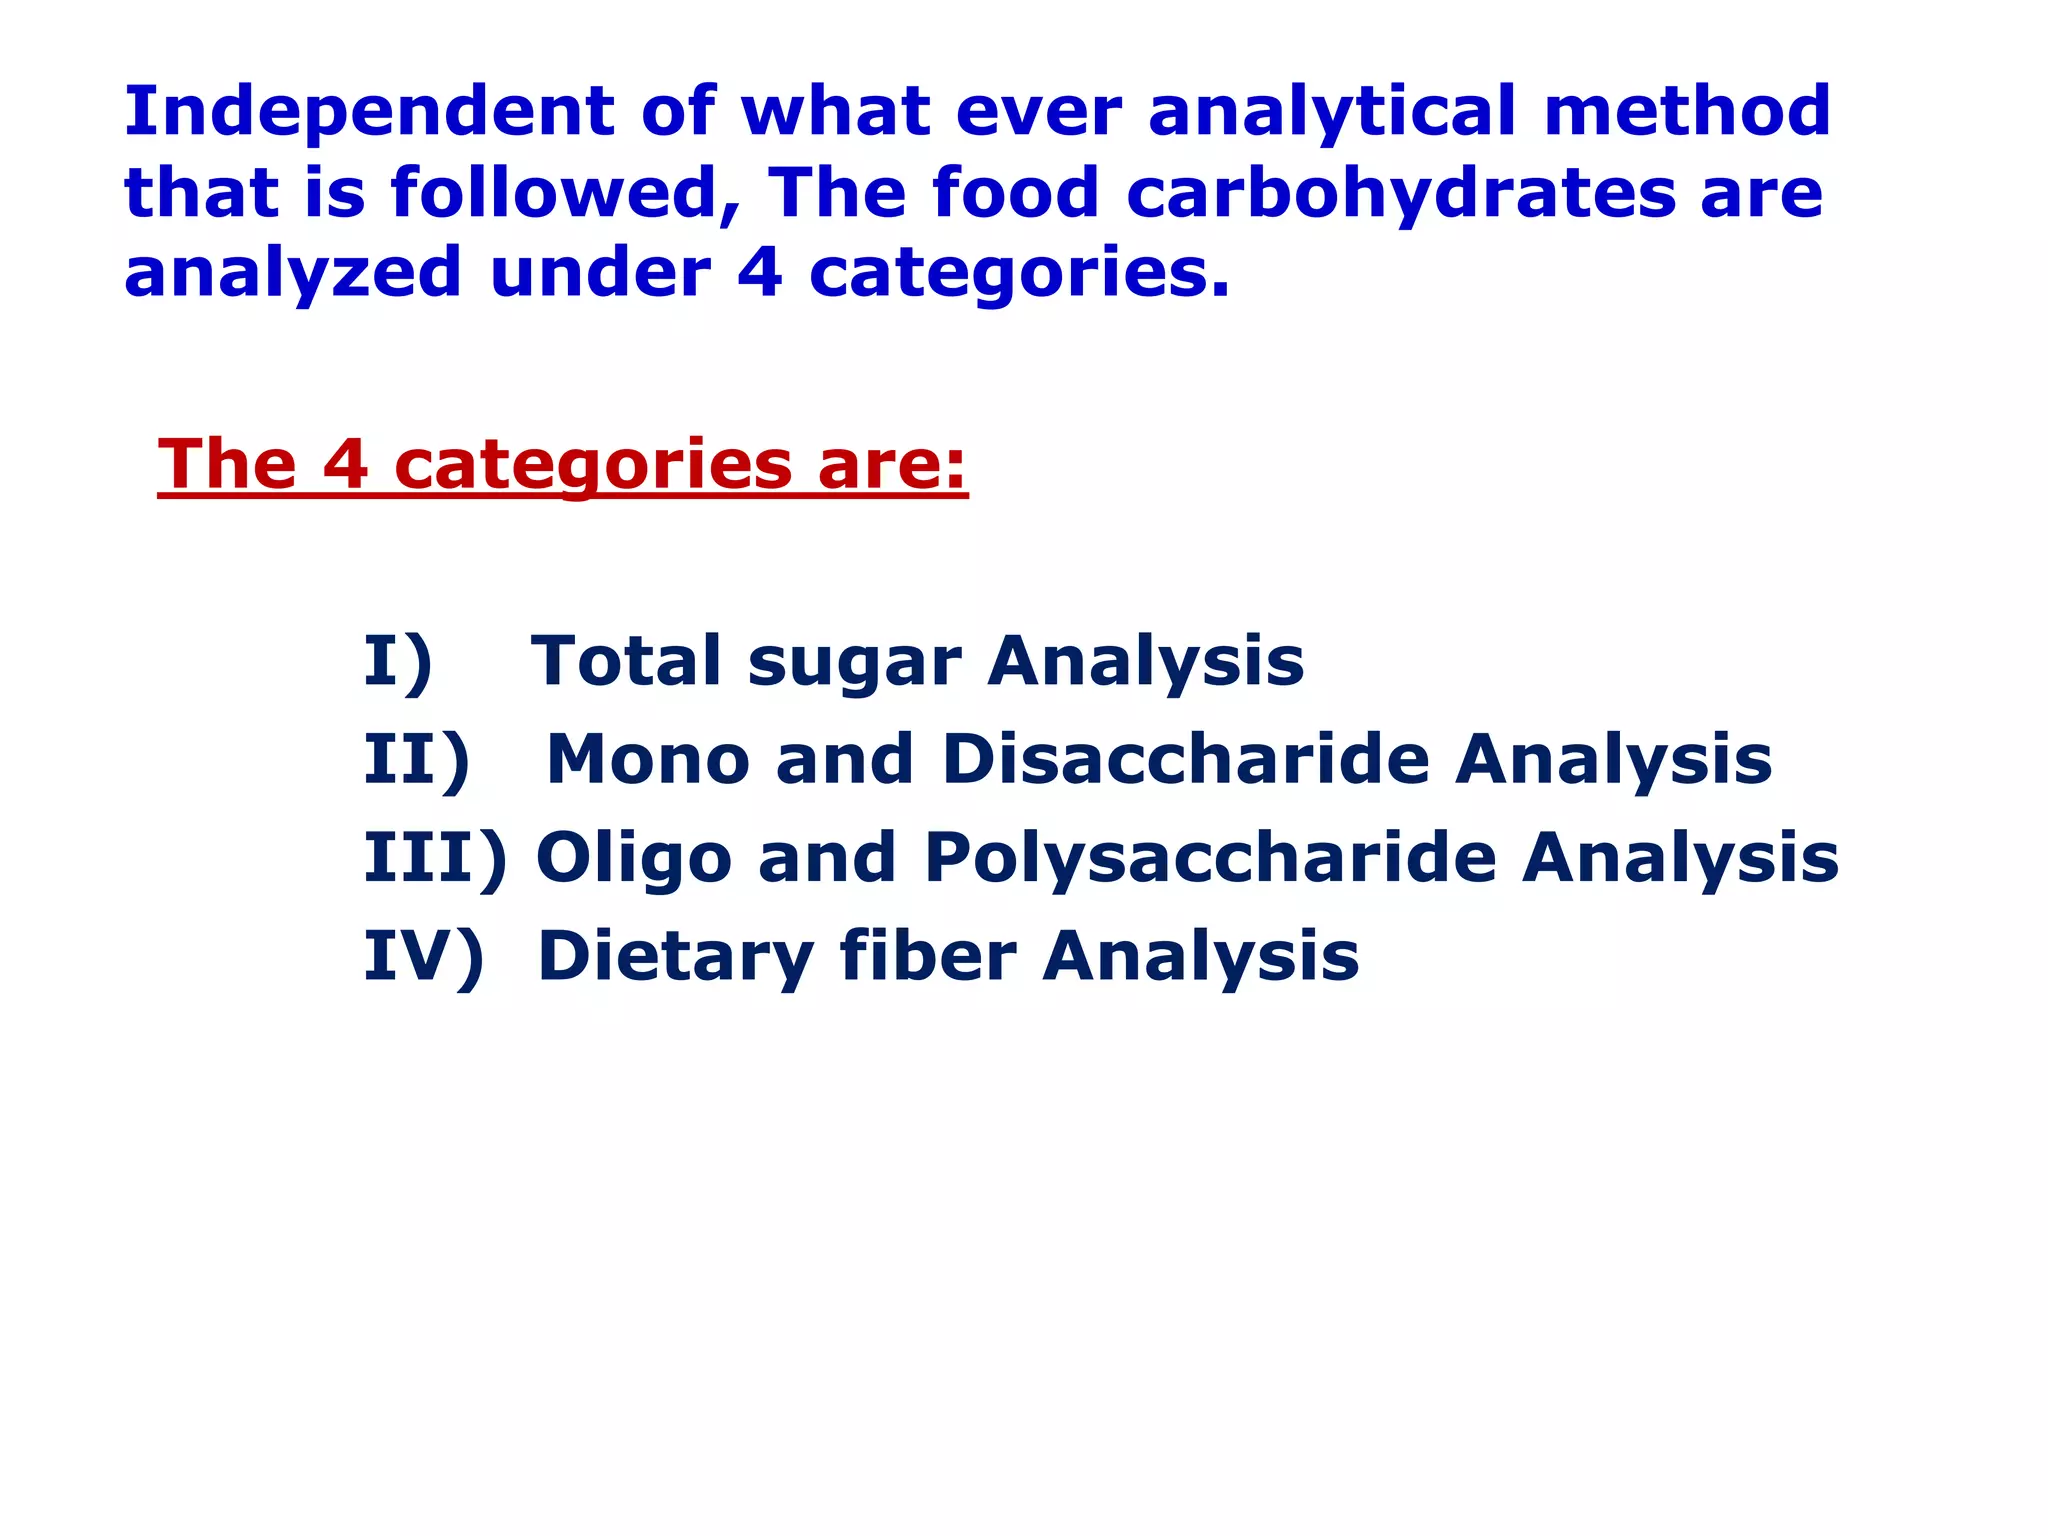
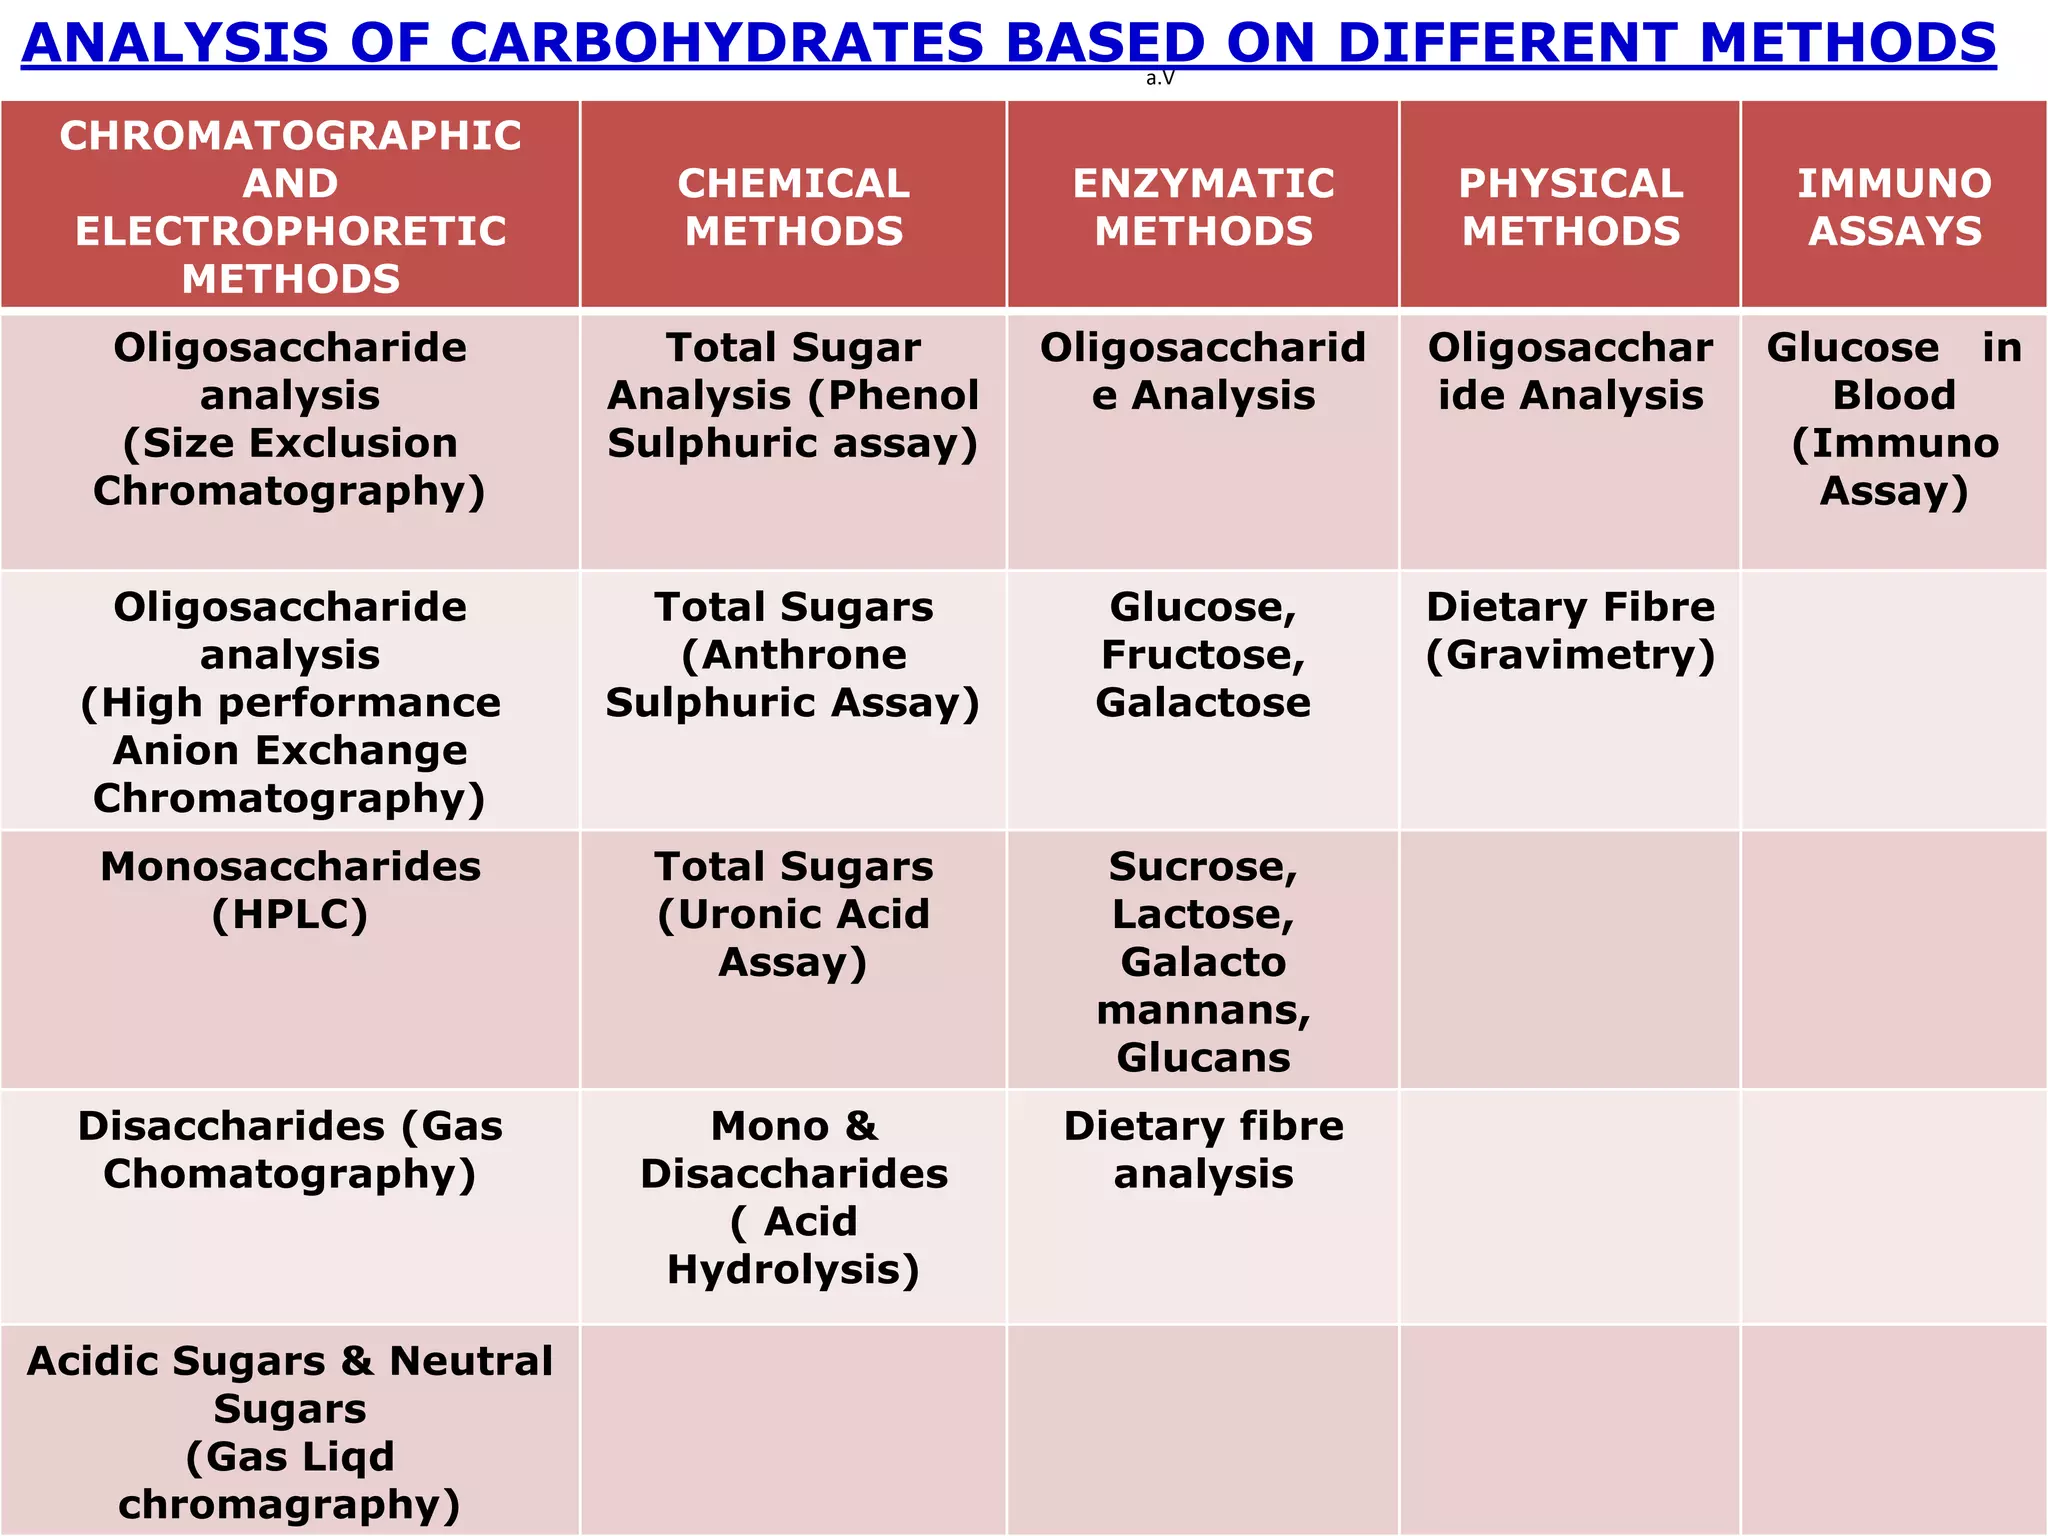
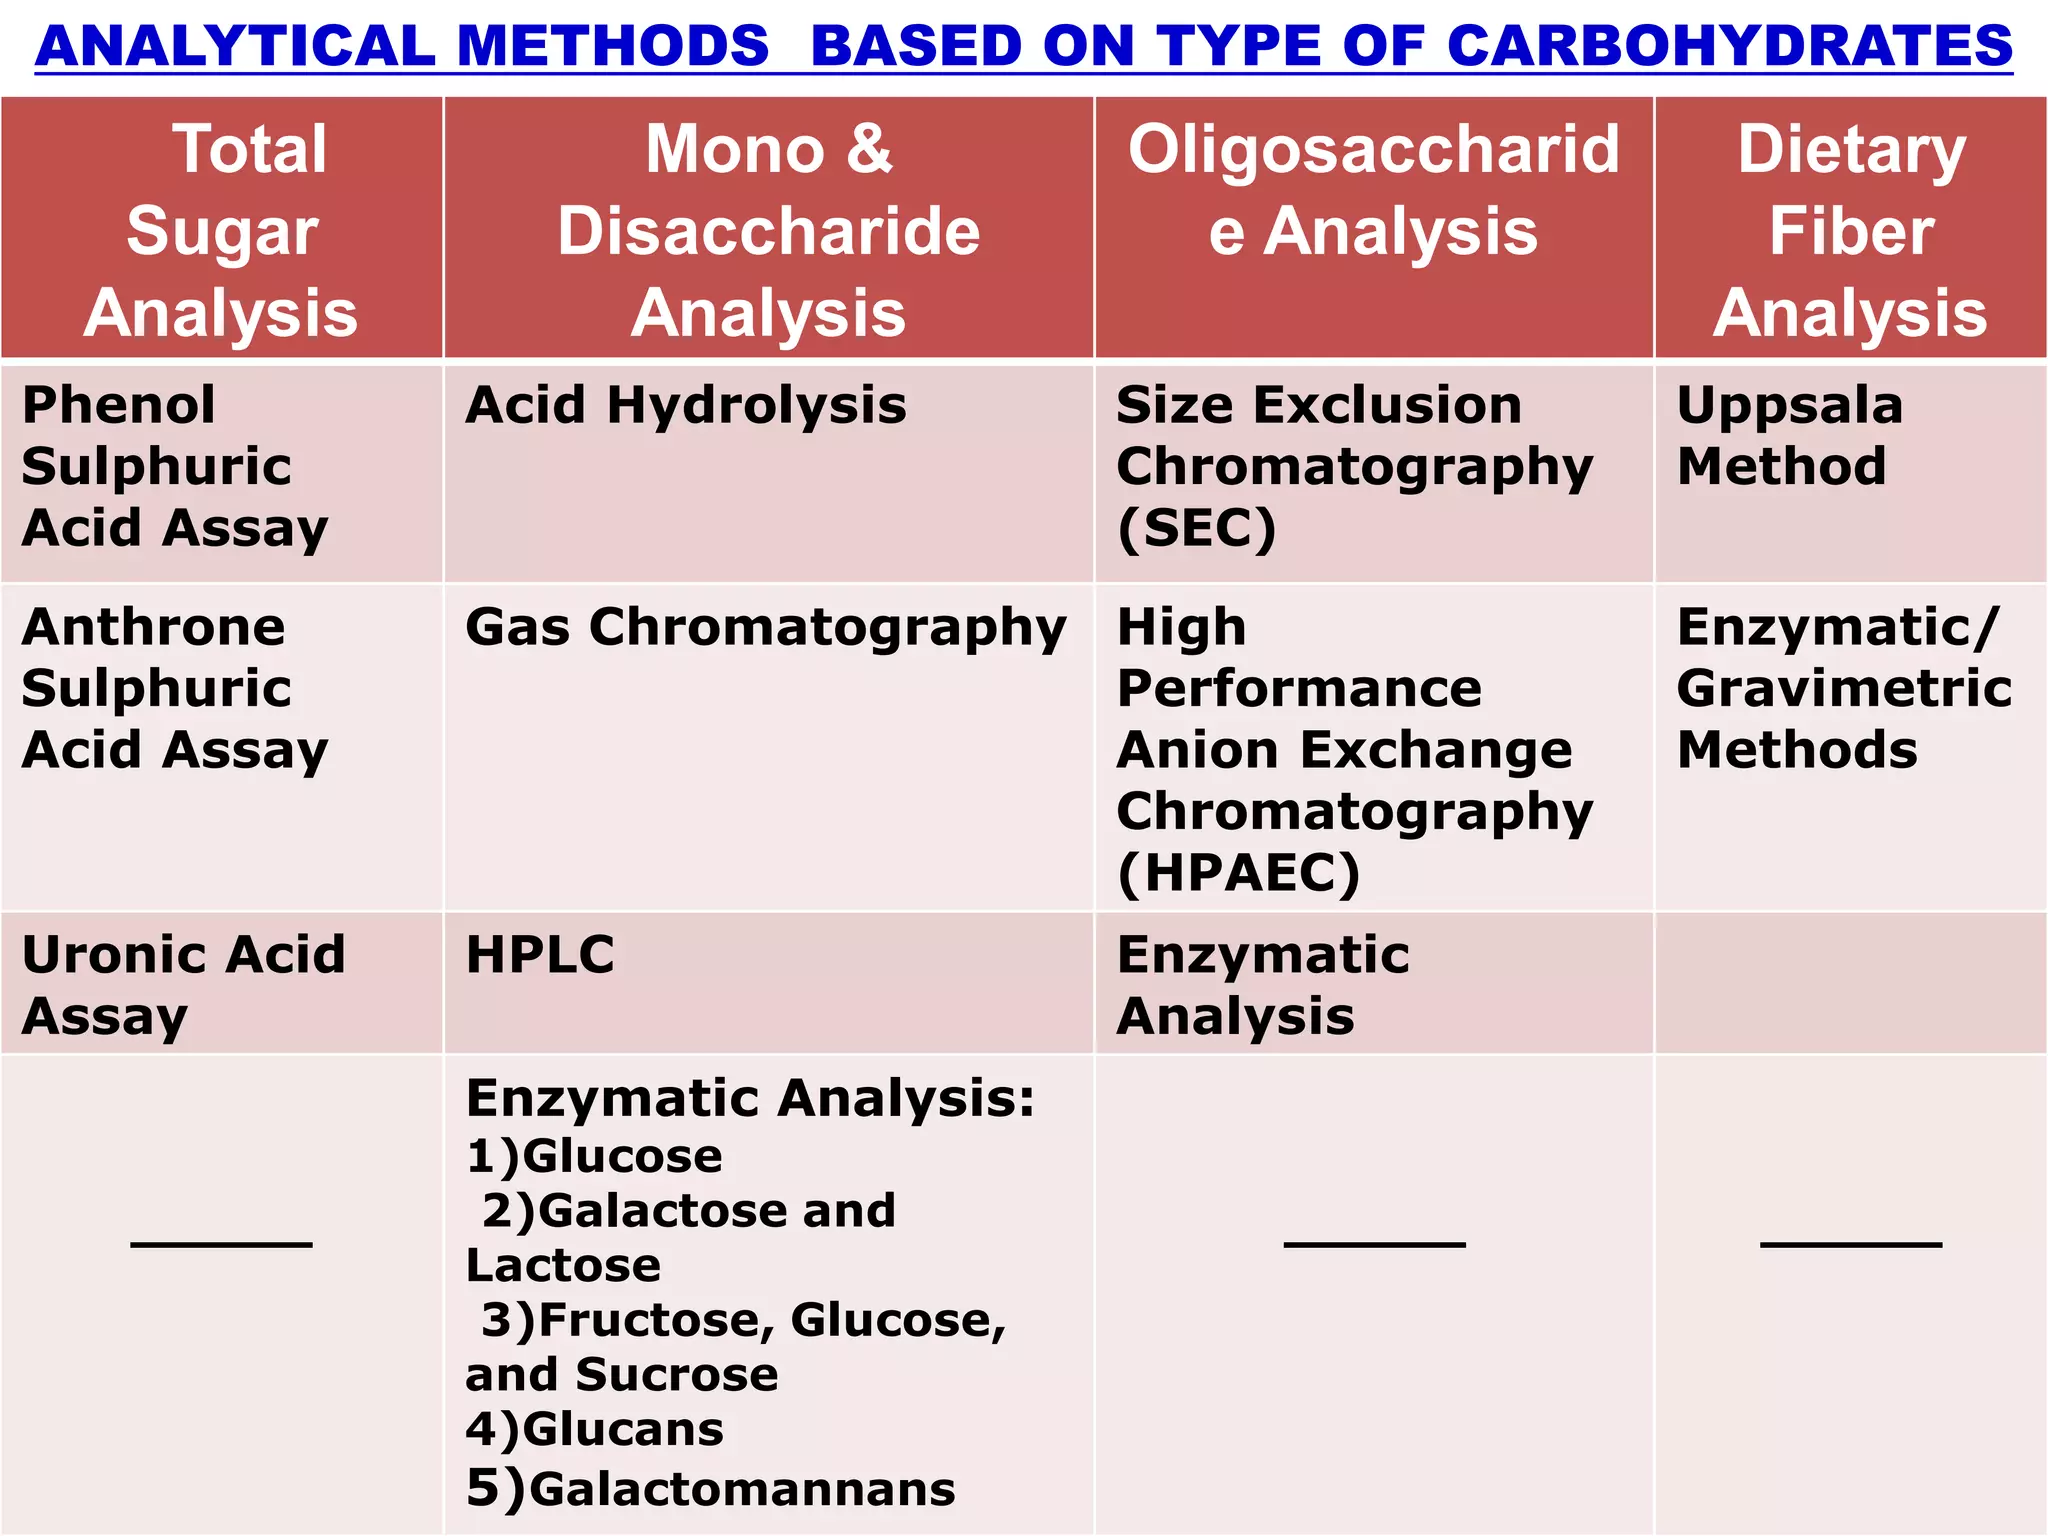
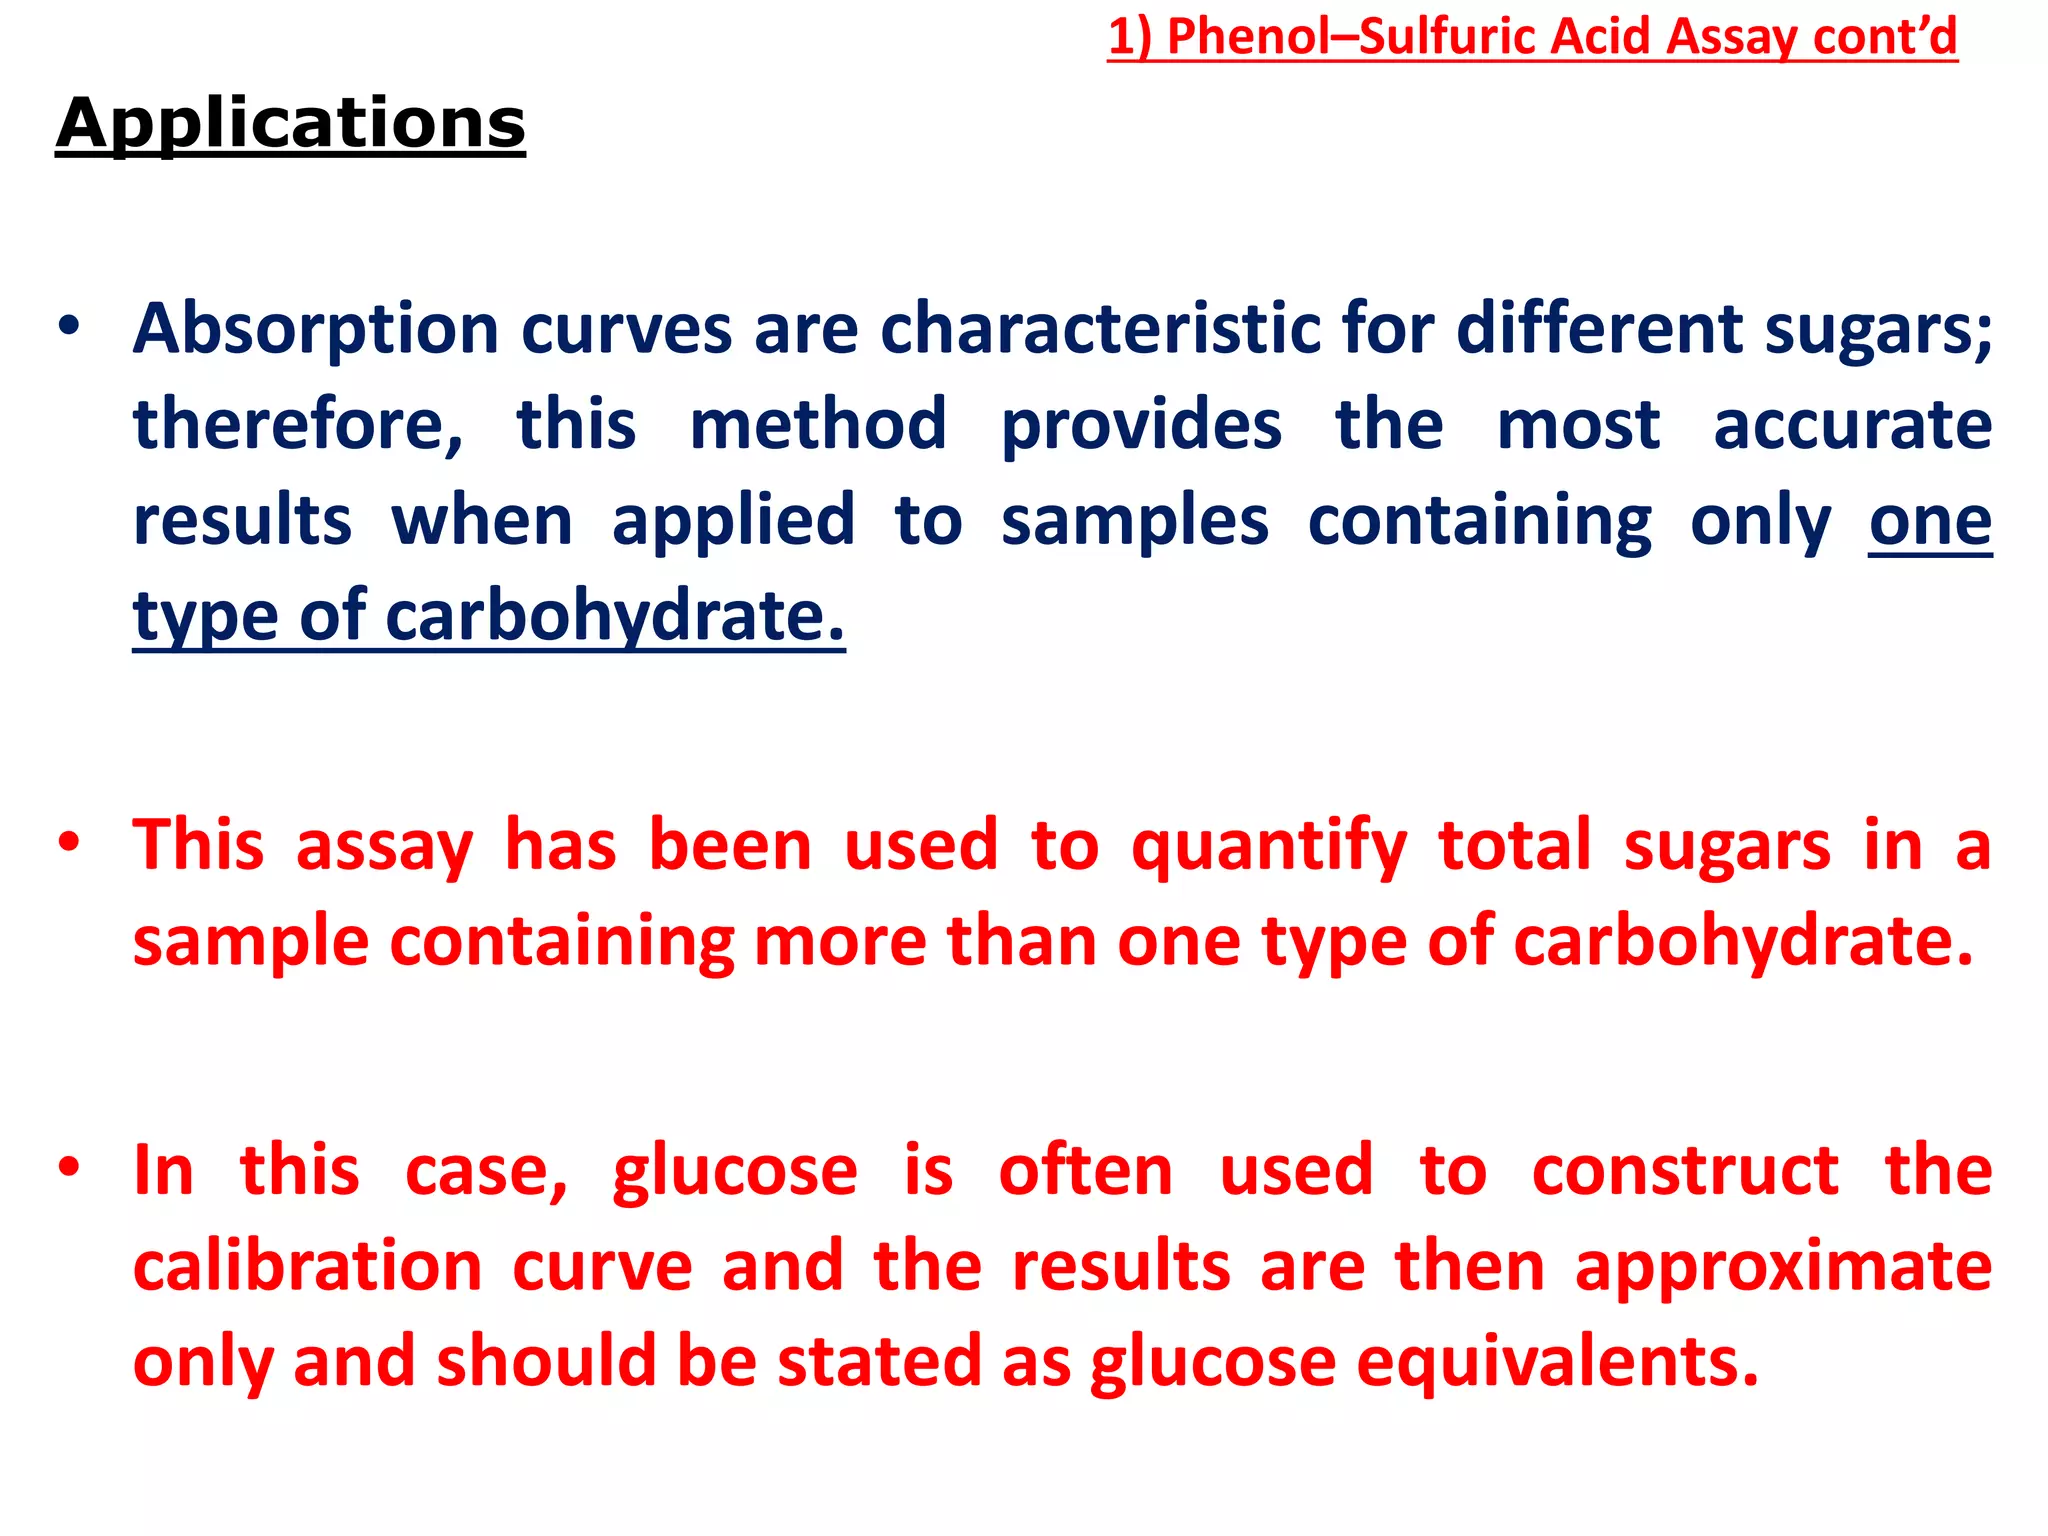
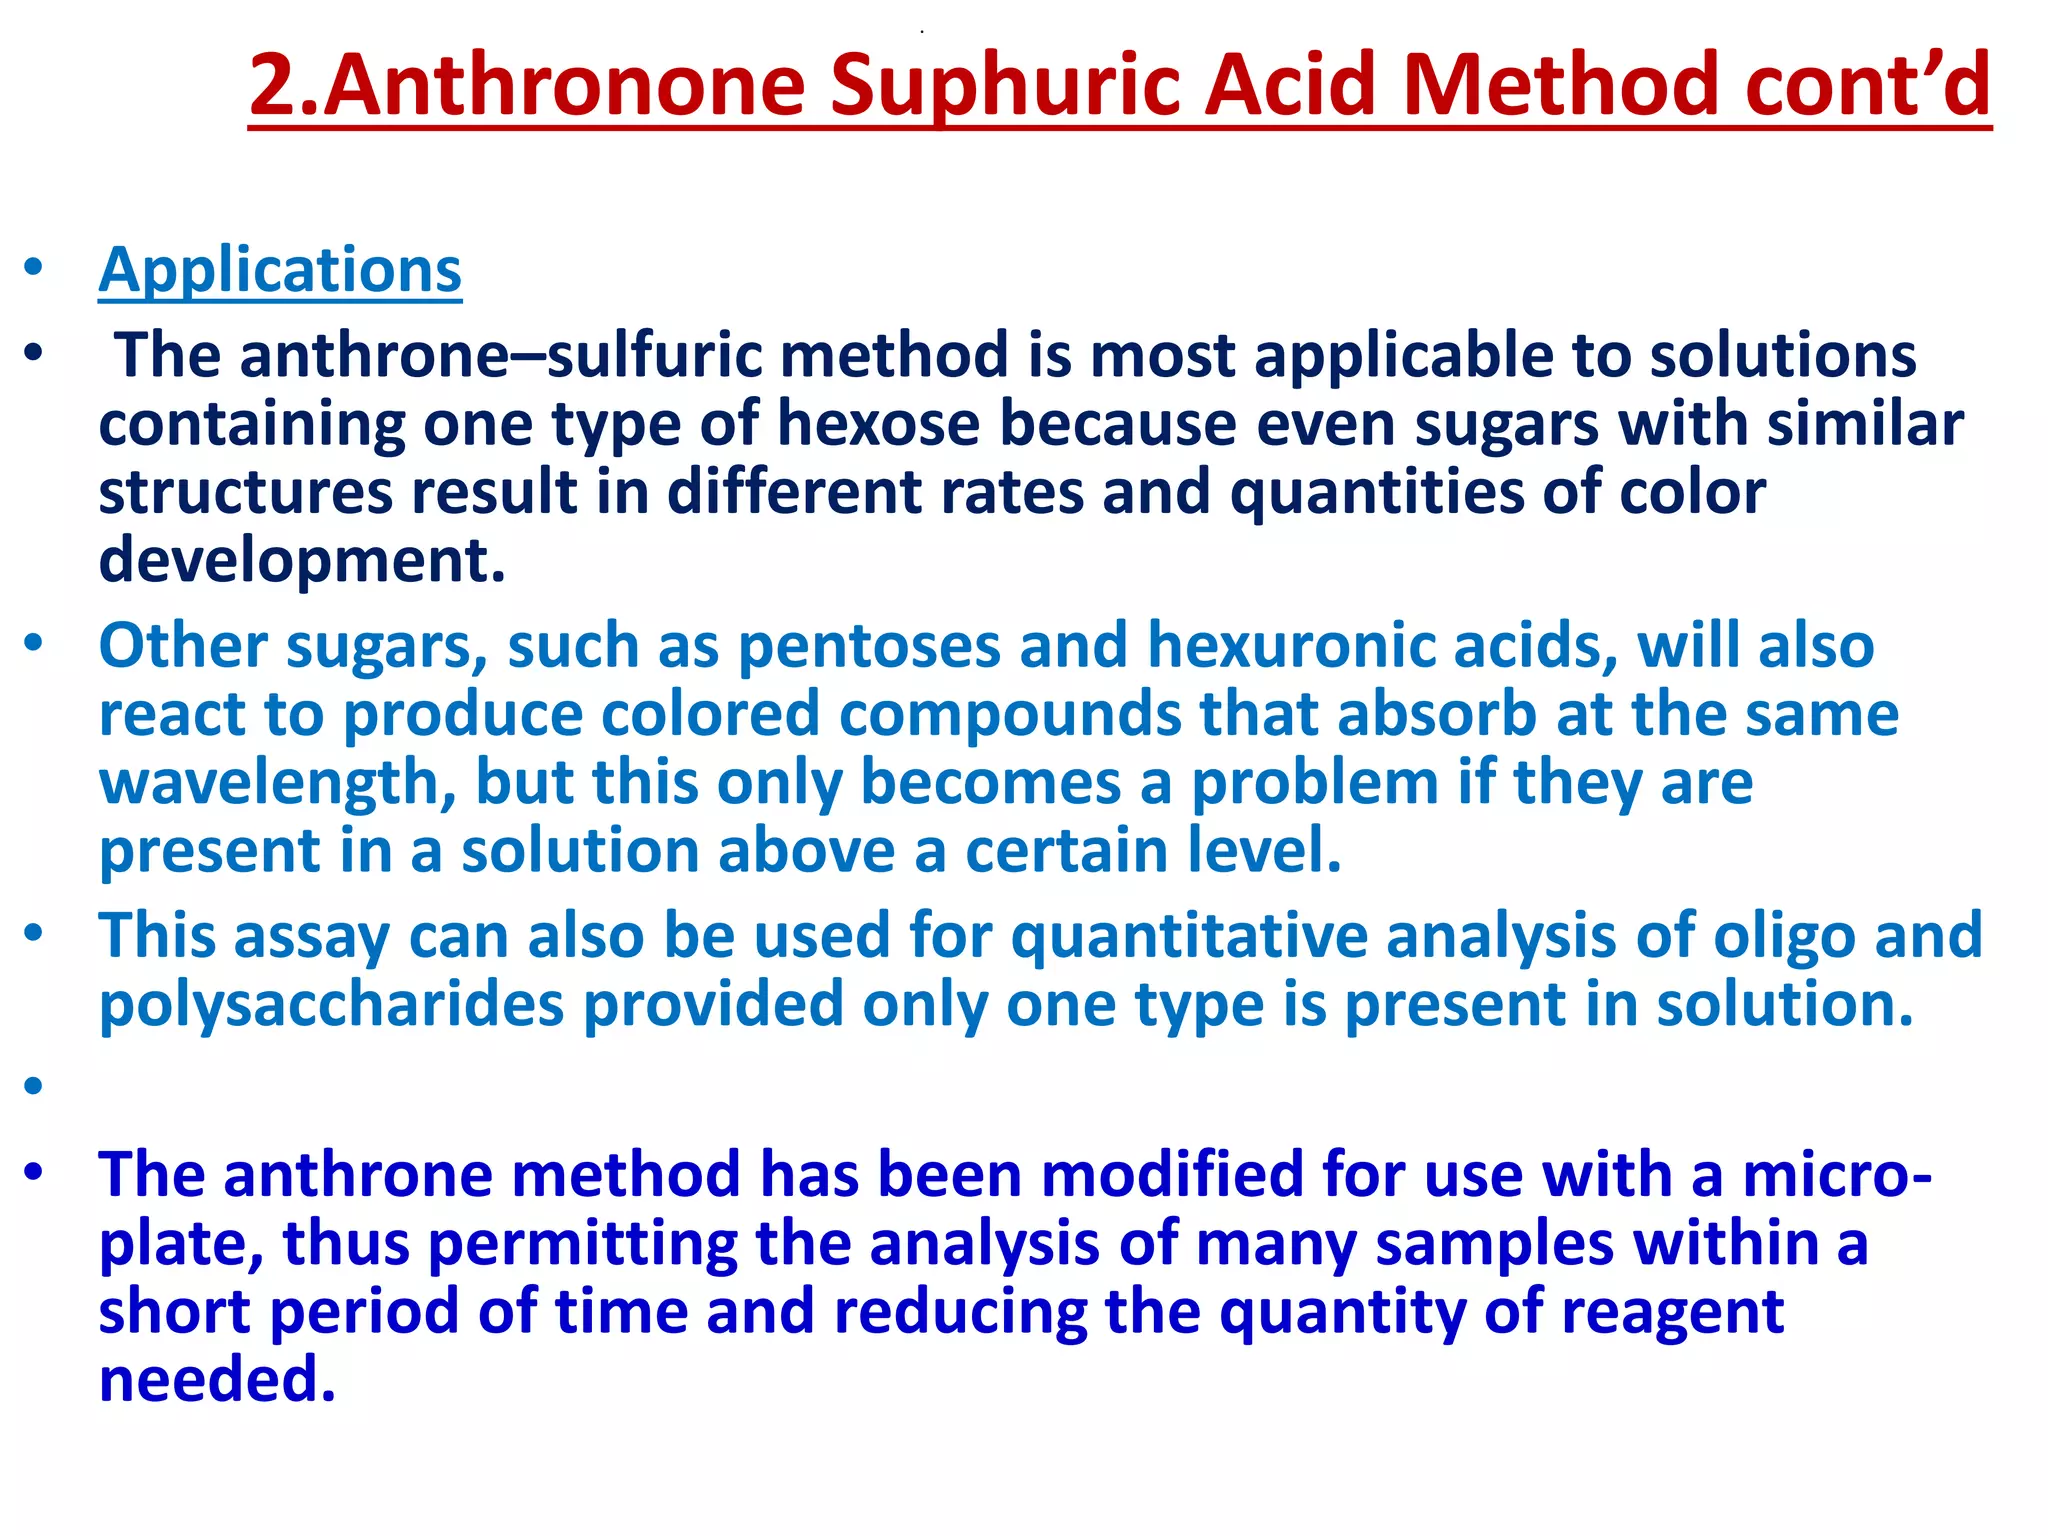
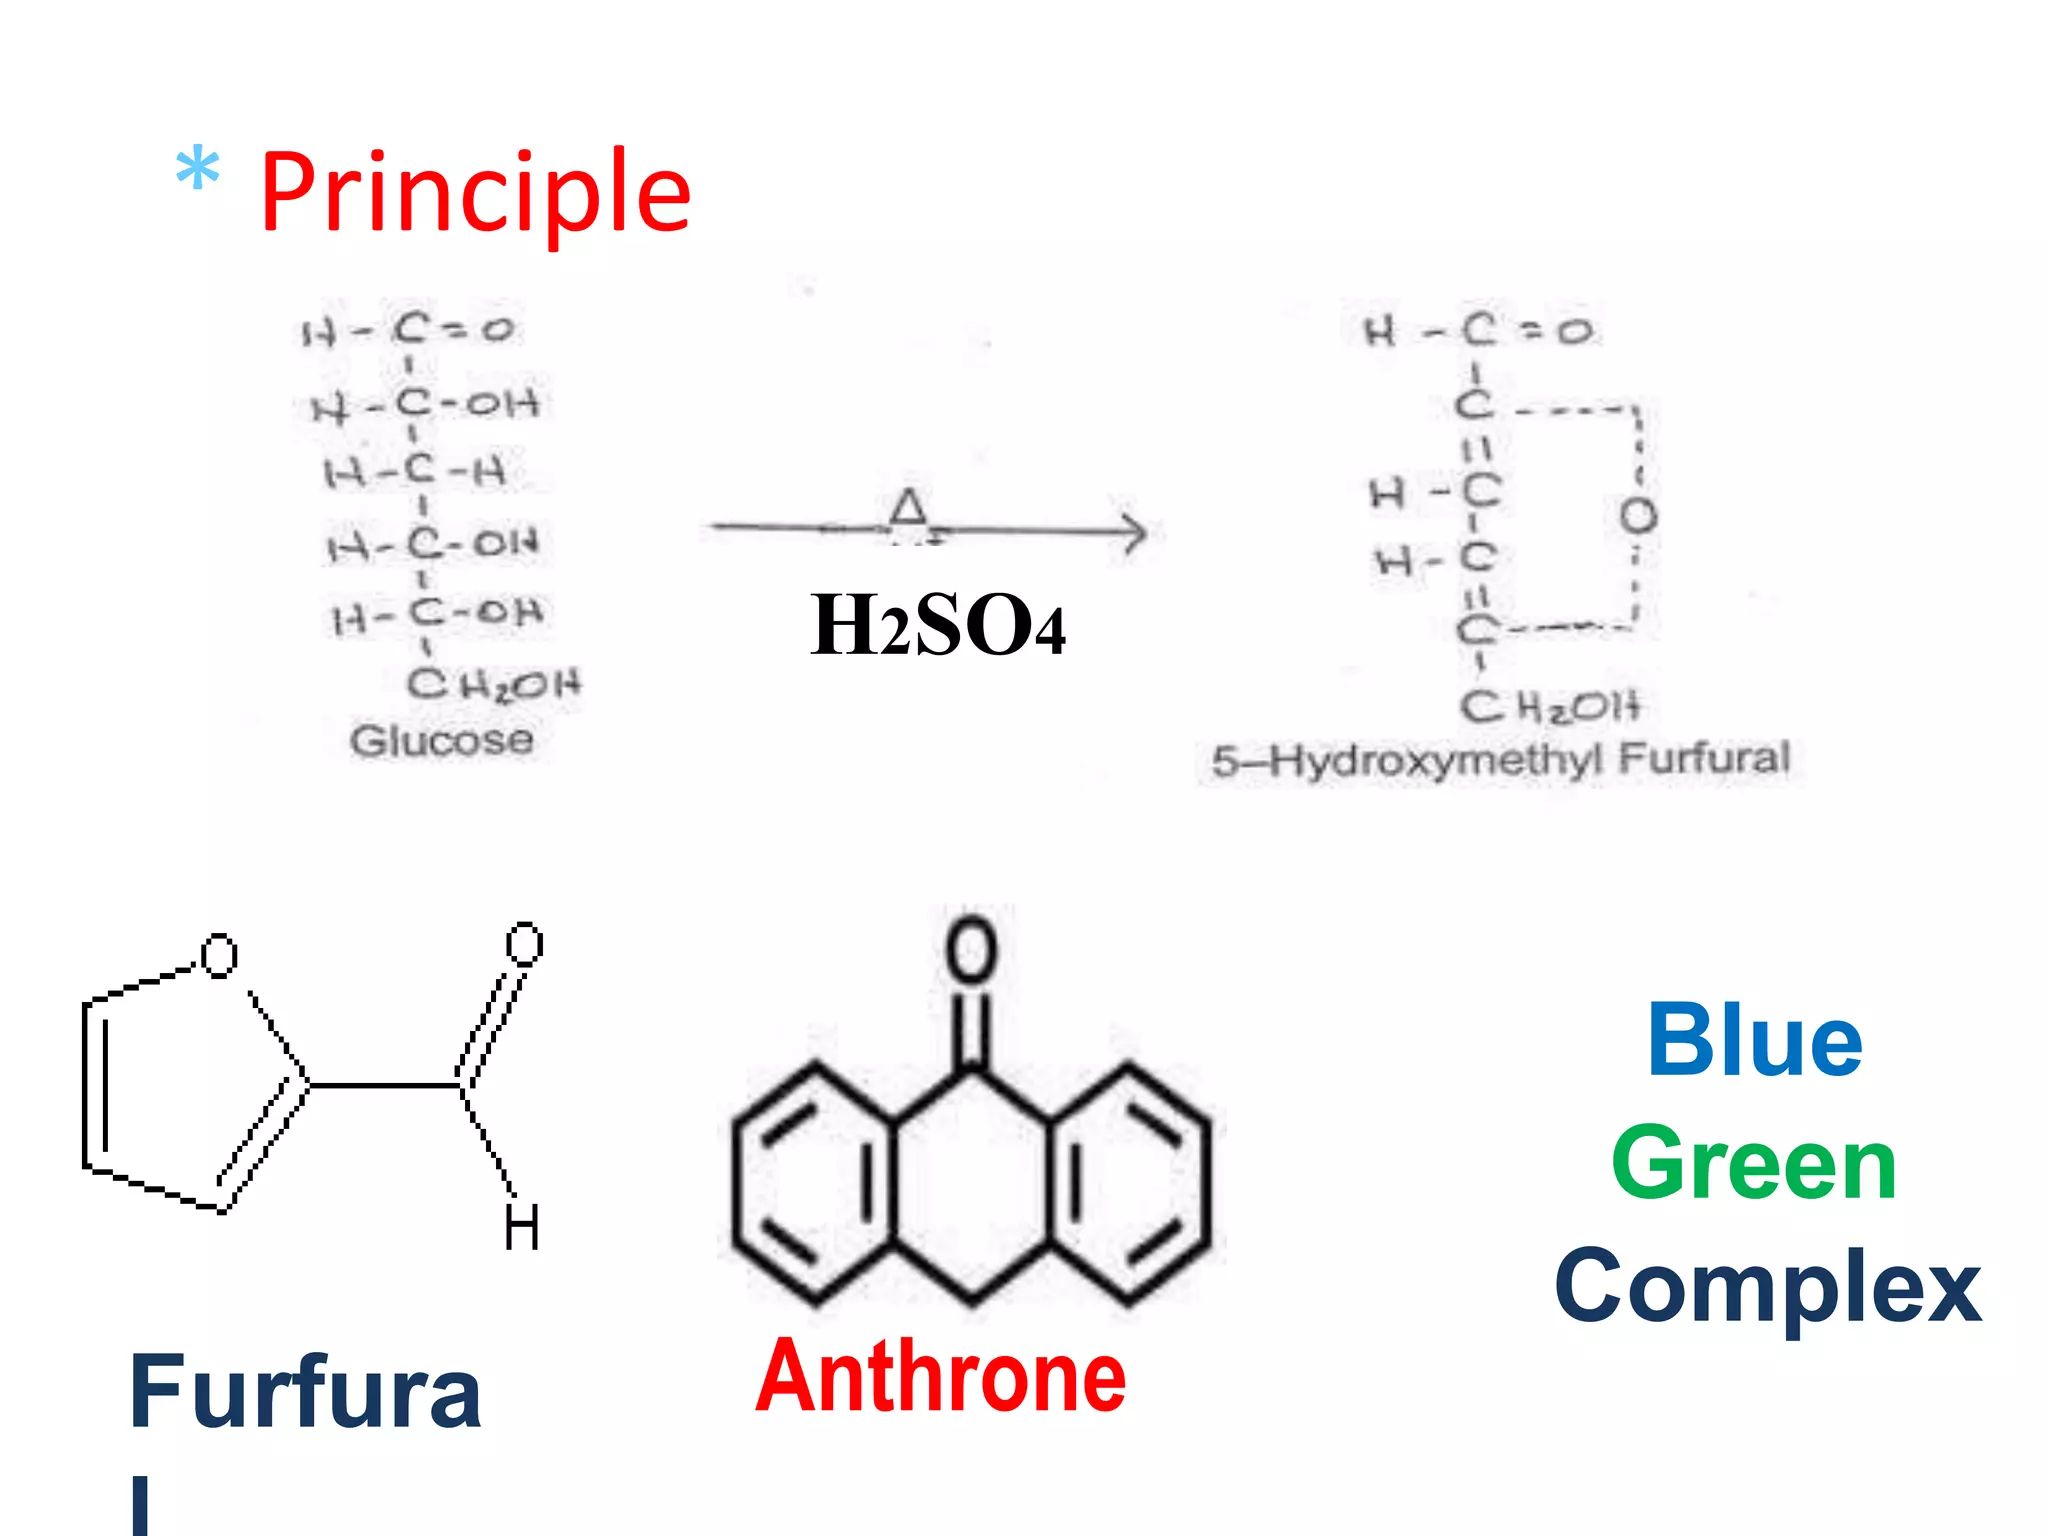
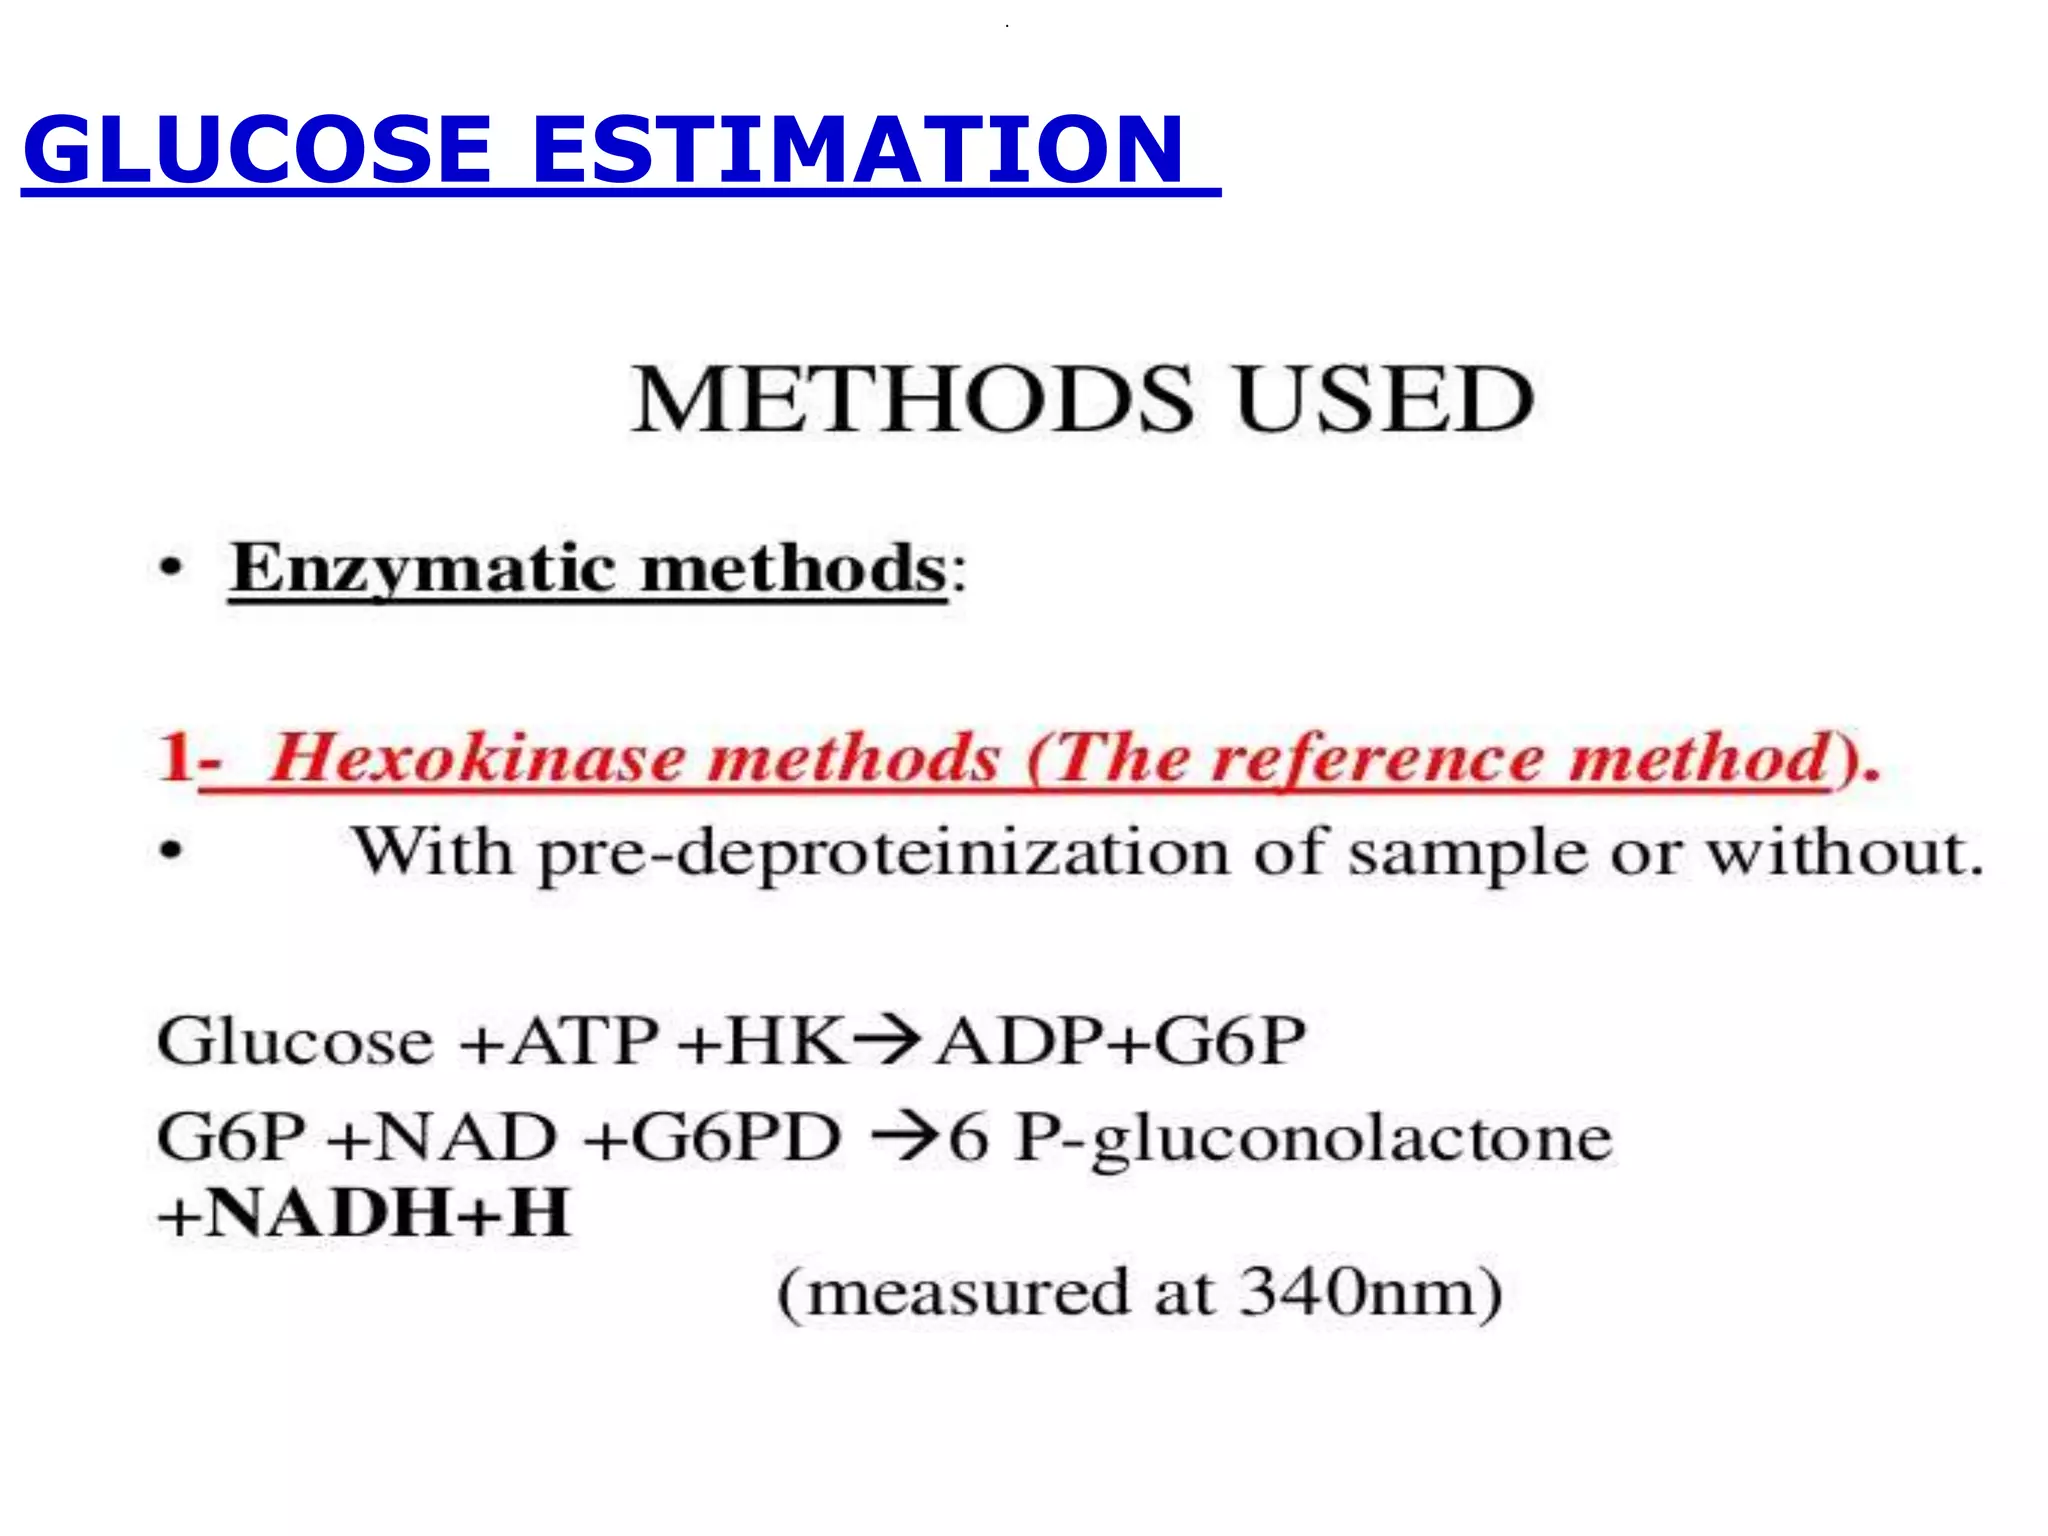
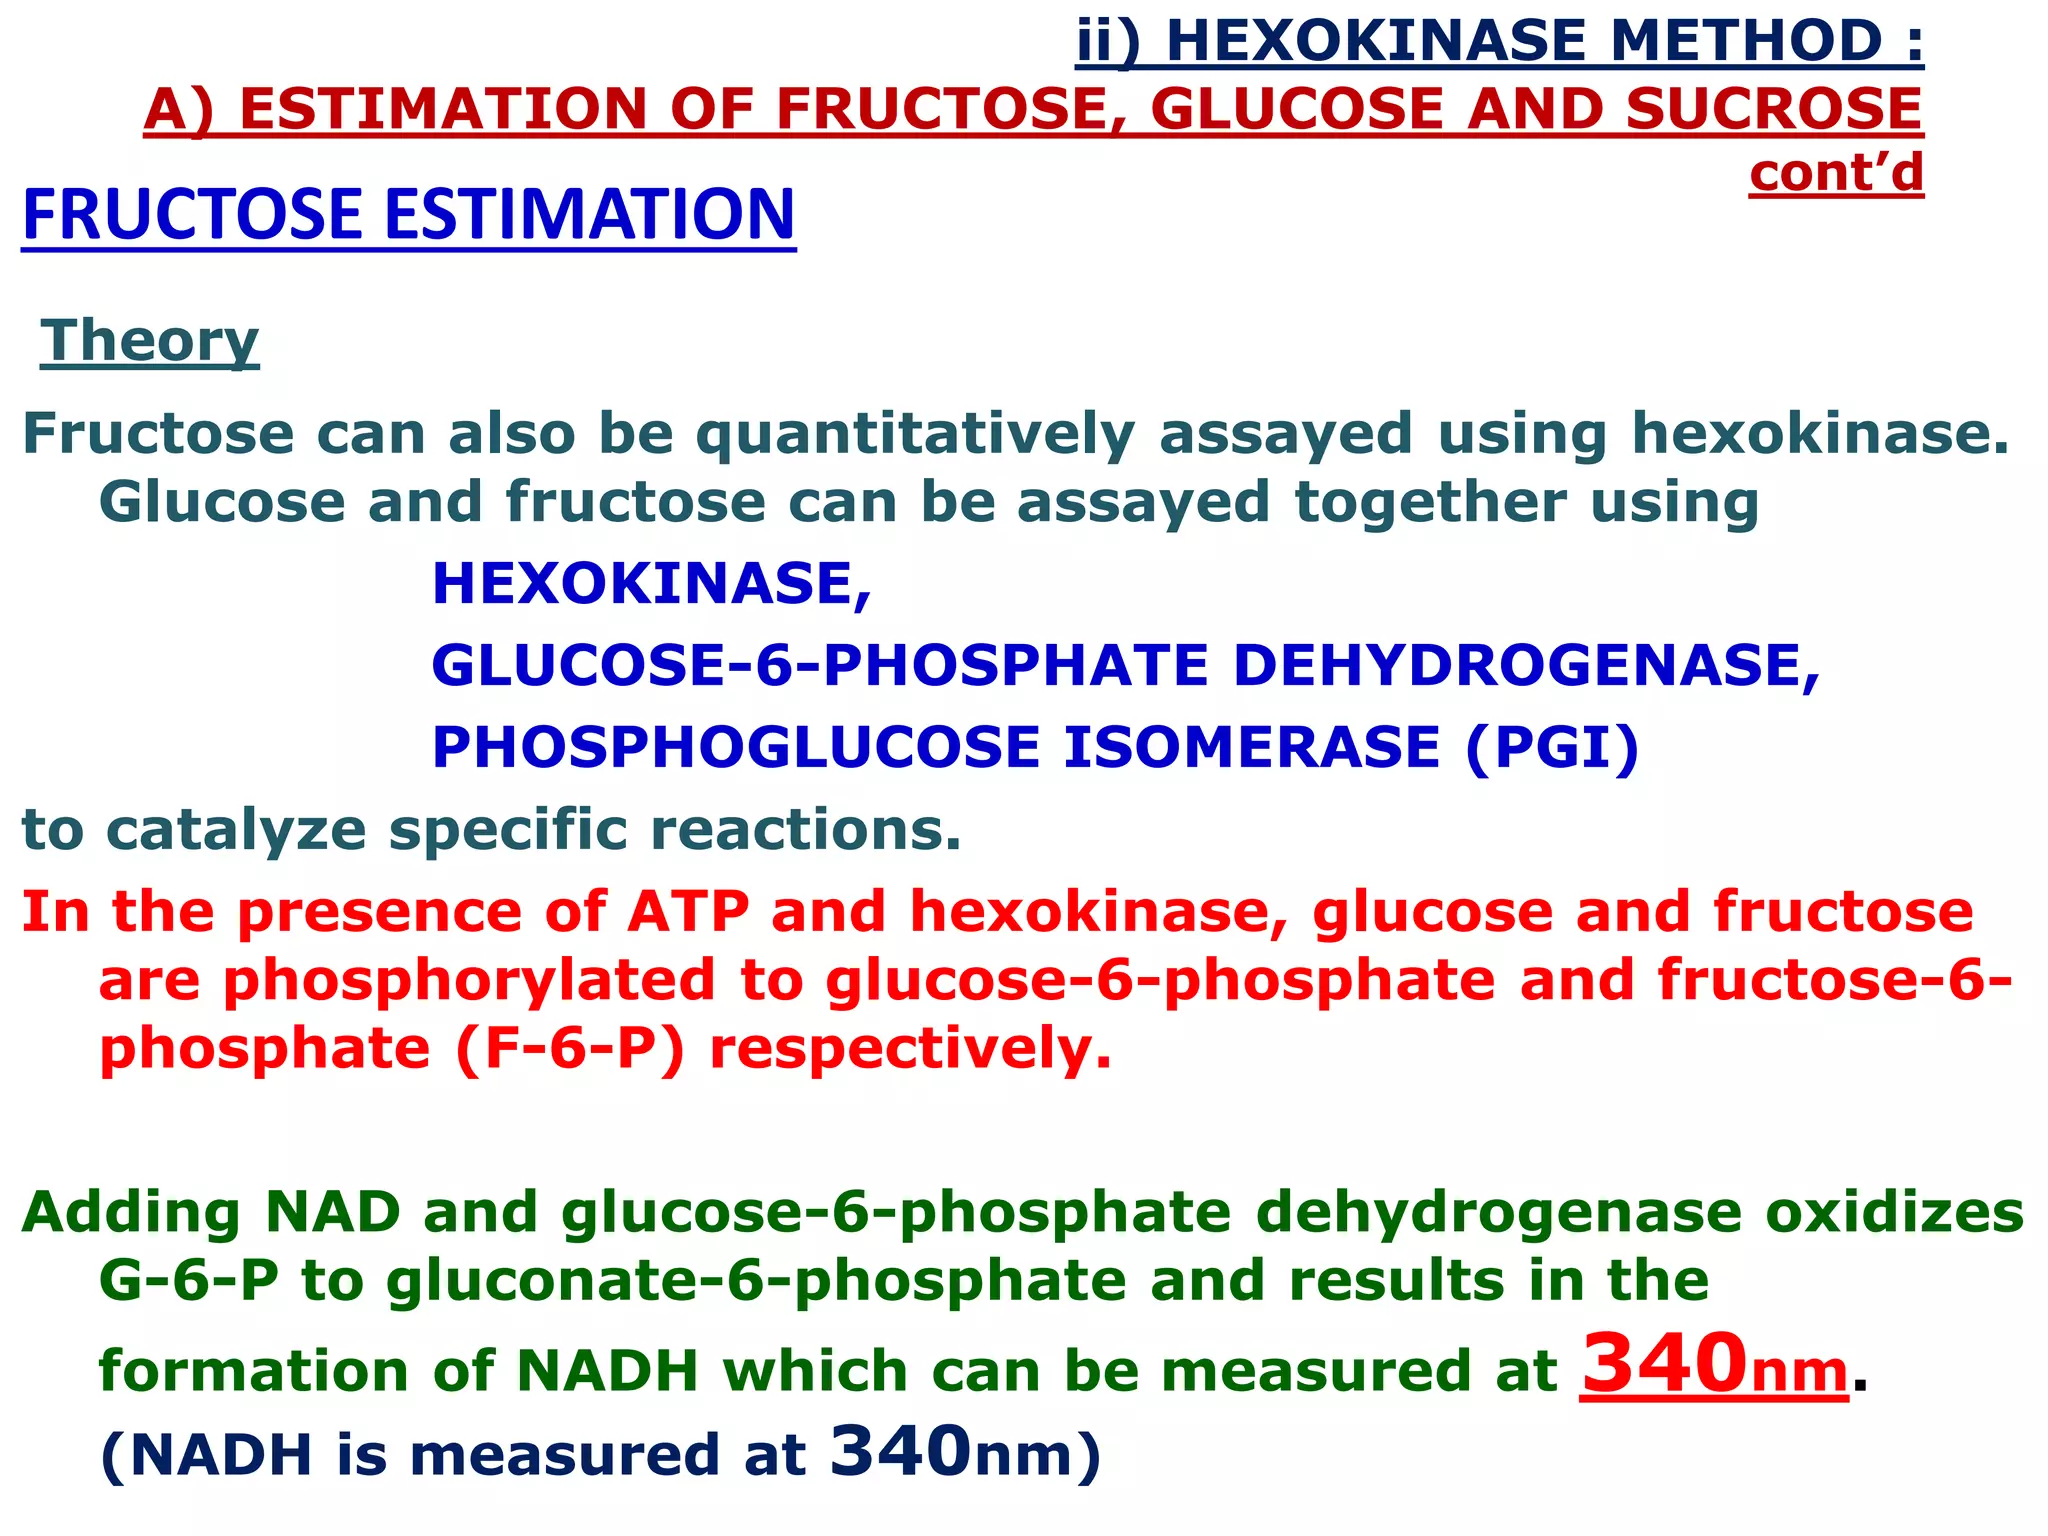
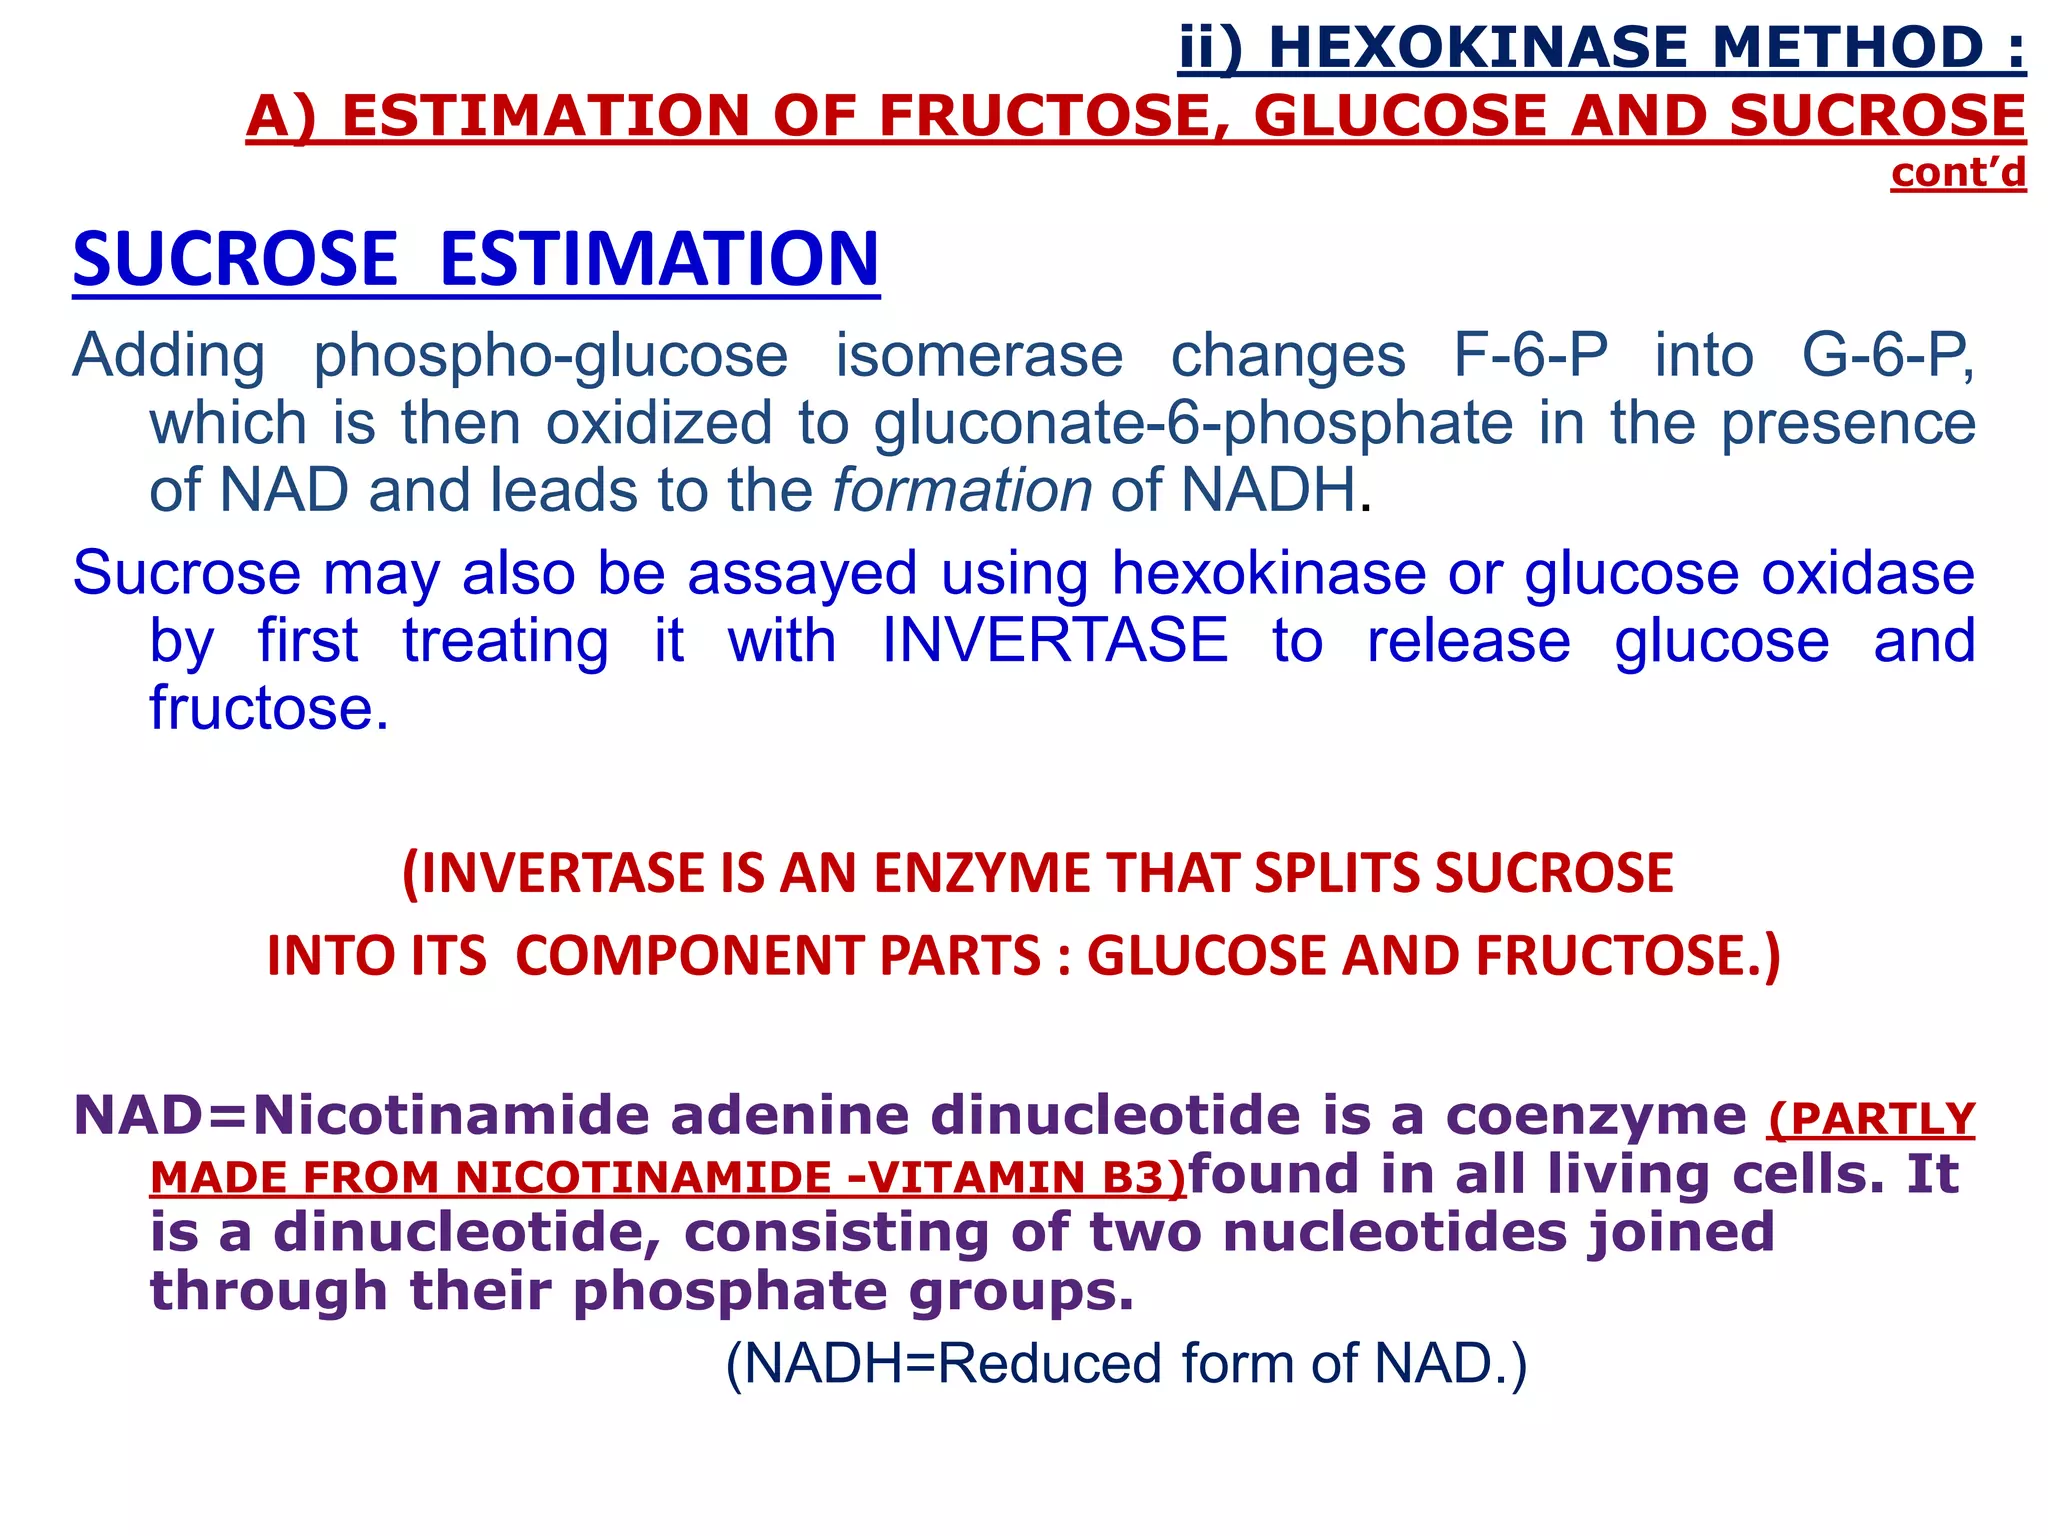
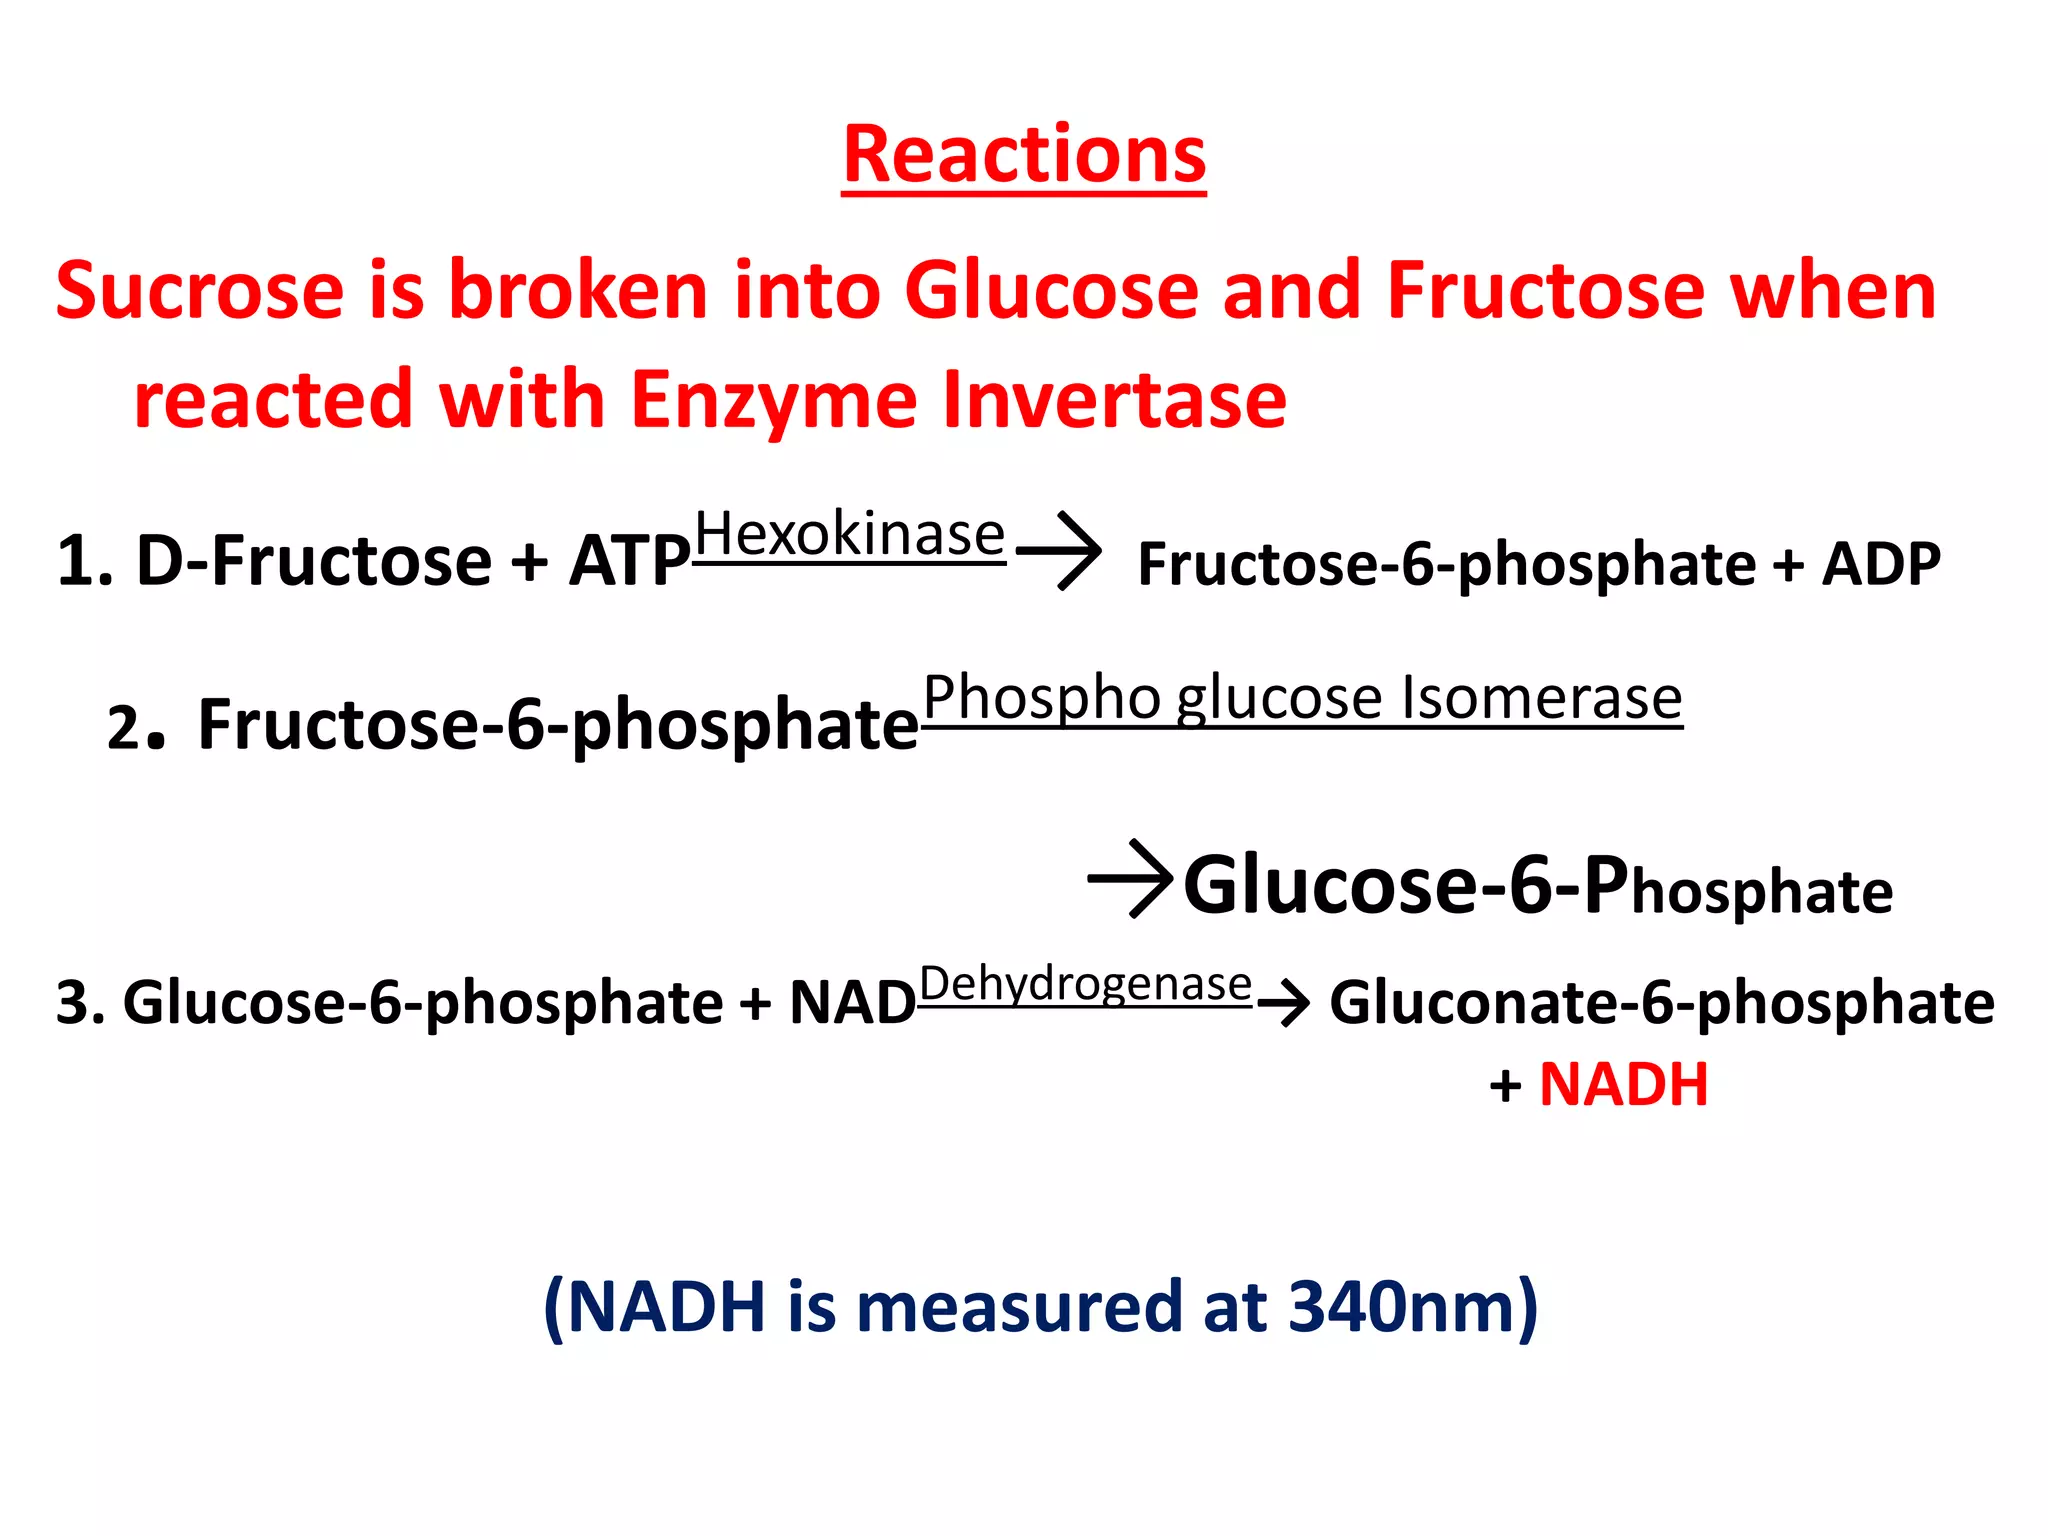
This document provides an overview of general methods for analyzing food carbohydrates. It discusses five categories of analytical methods: chromatographic and electrophoretic methods, chemical methods, enzymatic methods, physical methods, and immunoassays. It also describes various techniques for sample preparation prior to analysis, such as extraction, filtration, hydrolysis, and derivatization. The document indicates that food carbohydrates can be analyzed based on four categories: total sugar analysis, mono- and disaccharide analysis, oligo- and polysaccharide analysis, and dietary fiber analysis. Specific analytical techniques are discussed for each category.


![Coded Agents – with UiPath SDK + LangGraph [Virtual Hands-on Workshop]](https://cdn.slidesharecdn.com/ss_thumbnails/codedagentsdeck-251215155422-5497c599-thumbnail.jpg?width=640&height=640&fit=bounds)


