Downloaded 22 times


![PRACTICAL APPLICATION
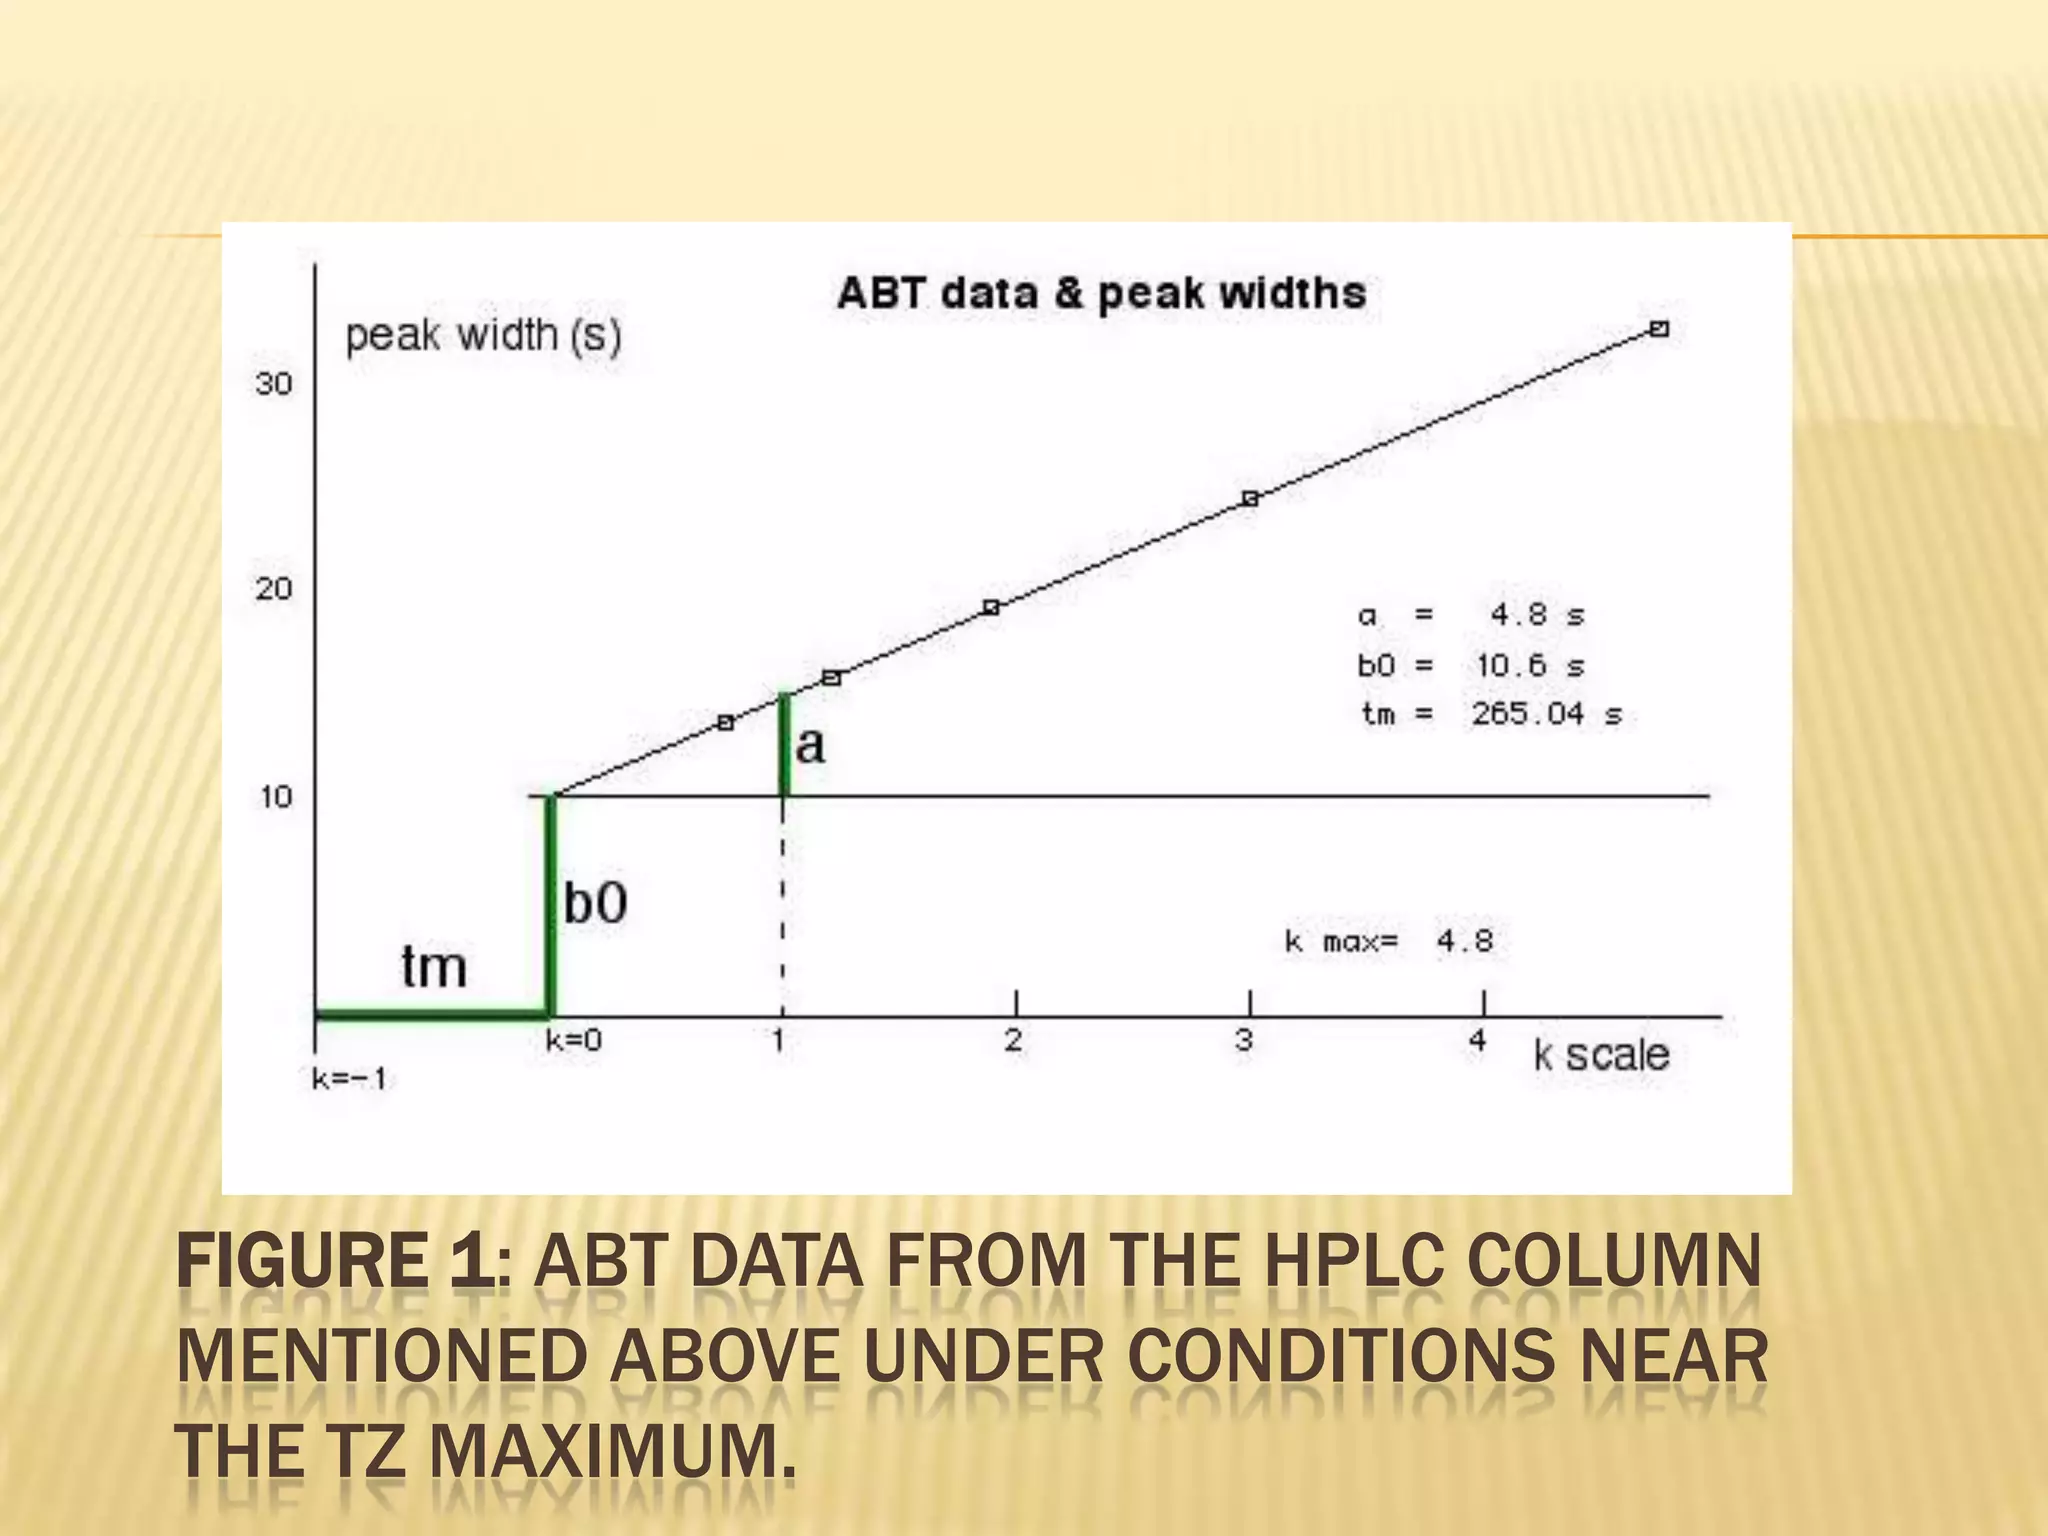
OF “A”, “B0”, “TM”:
Any not adjusted retention time value tms can be
transferred into k-values.
The peak width b05 of any peak with known tms
value can be pre calculated:
b05 (at tms) = b0 + a * (tms - tm) / tm = b0 + a * k.
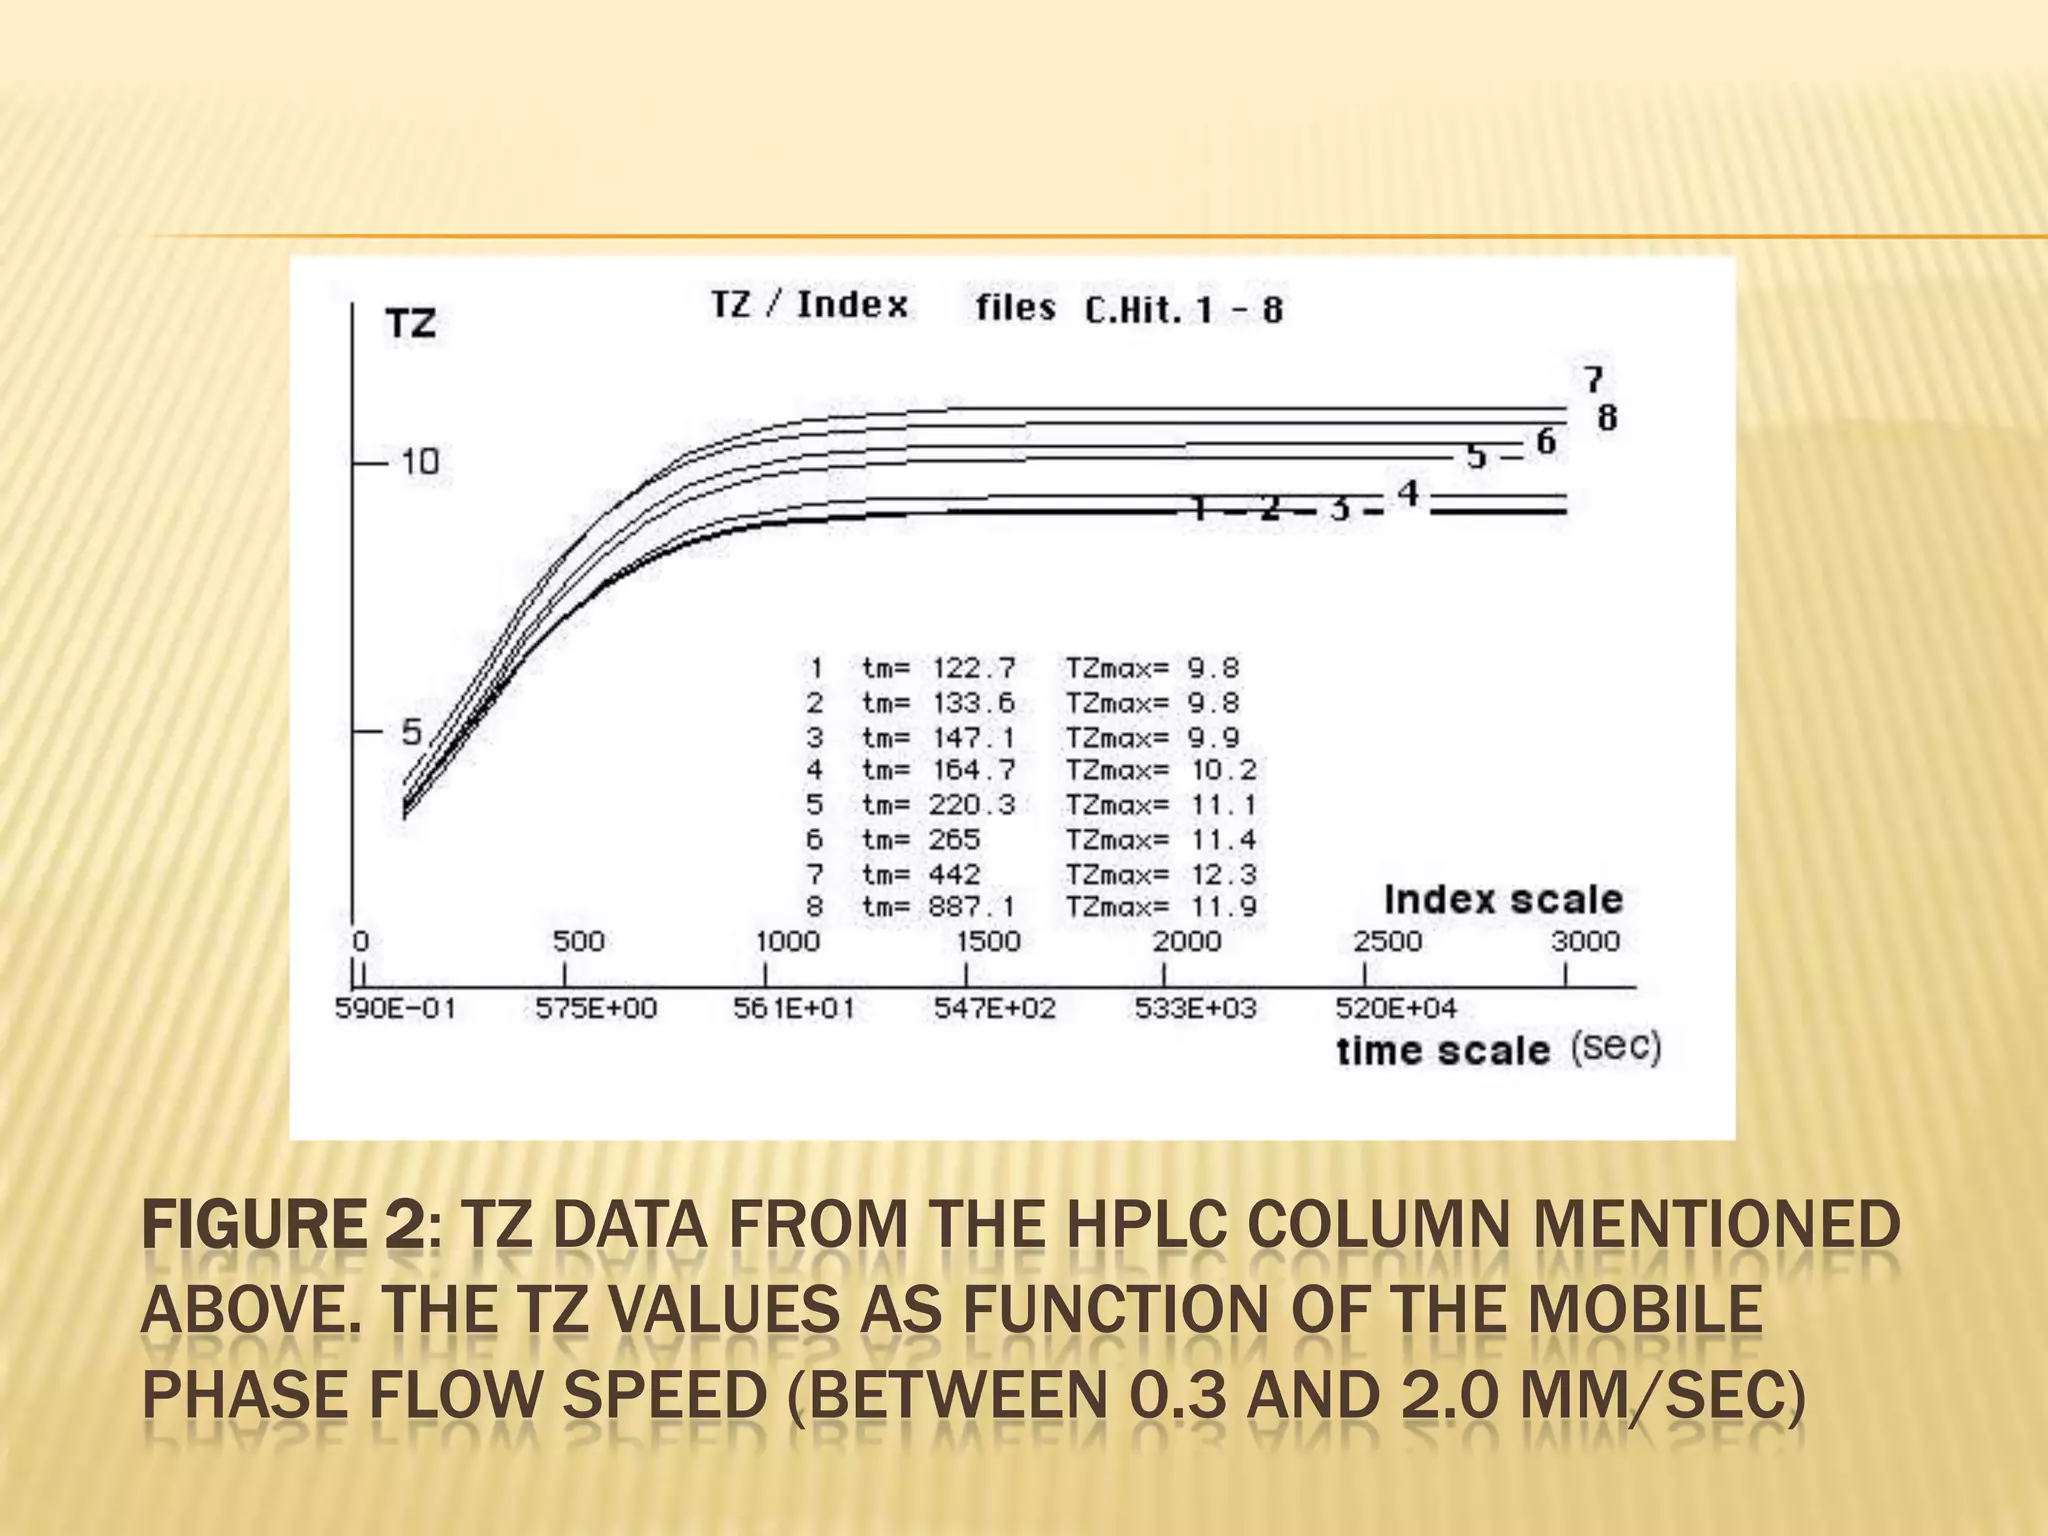
The Trennzahl for any time region can be pre
calculated, see figure 2:
TZ = [tms homol.(N) - tms homol.(N-1)] / [b05
homol.(N) + b05 homol.(N-1)] + 1
The peak capacity “PC”](https://image.slidesharecdn.com/qualitativeerrorsinhplc1-121128113842-phpapp02/75/Qualitative-errors-in-hplc-1-13-2048.jpg)
![ The ABT theory works with the theoretical
plate height “h” or “HETP” respective the
theoretical plate number n to describe the
separation capacity of a column packing or
the separation power or packing quality of the
column as such.
n = 5.545 * (tms / b05)2 = 5.545 * ((ts + tm) /
(b0 + a*(ts / tm))2
HETP = L / n [mm]](https://image.slidesharecdn.com/qualitativeerrorsinhplc1-121128113842-phpapp02/75/Qualitative-errors-in-hplc-1-14-2048.jpg)


The document discusses qualitative errors that can occur in high performance liquid chromatography (HPLC). It describes several sources of qualitative errors such as poor separation power, substances being strongly adsorbed to the stationary phase, and changes in stationary phase selectivity from impurities in the mobile phase. It also discusses reasons to use error control techniques in qualitative HPLC, such as checking separation power and using two columns in series. The document introduces the ABT concept for evaluating column quality using retention time and peak width values of separated homologues under isocratic conditions. Plots of ABT data and theoretical plate numbers from an example HPLC column are also presented.


