This document provides a summary of quality control tools and applications, including:
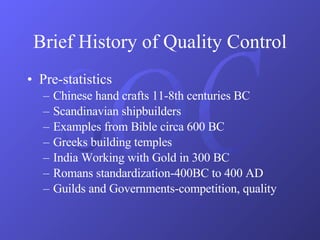
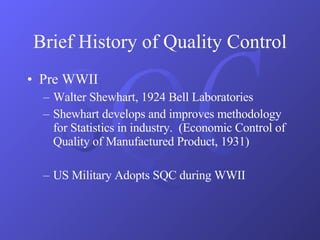
- A brief history of quality control from ancient times to the modern development of statistical quality control methods.
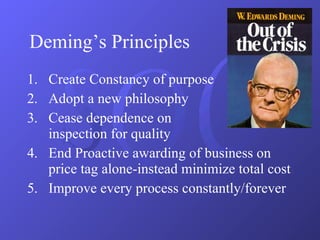
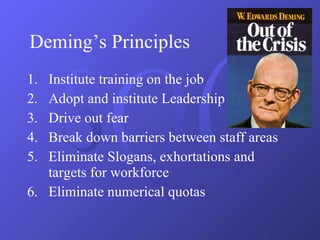
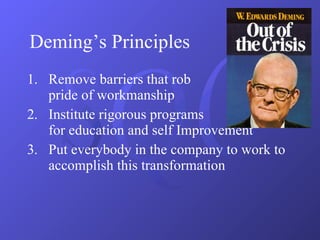
- An overview of W. Edwards Deming's 14 principles for transforming quality management.
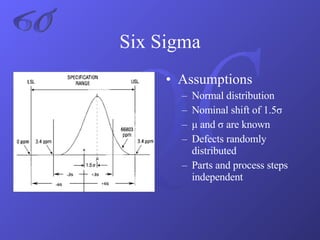
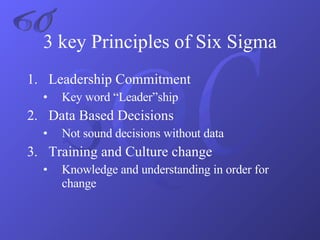
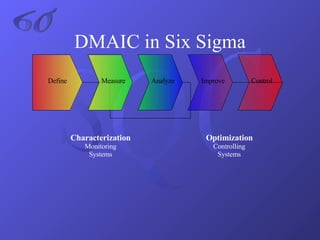
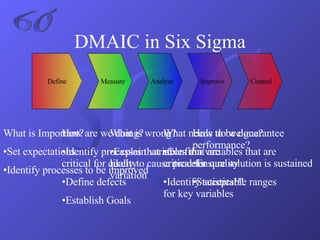
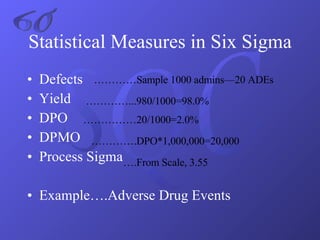
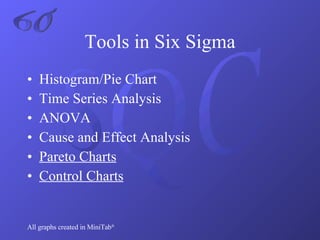
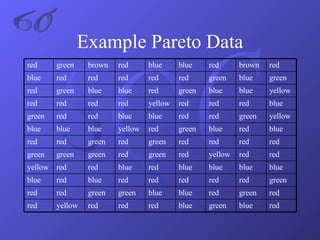
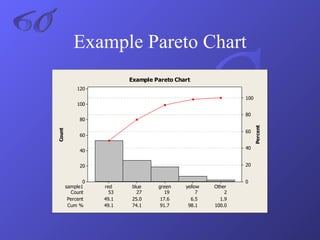
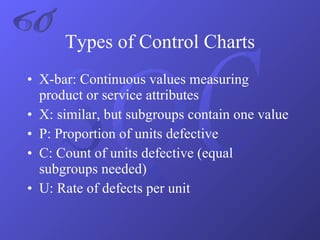
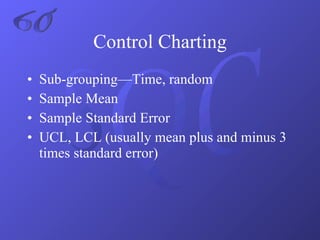
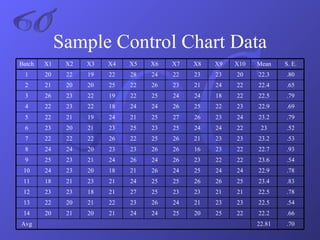
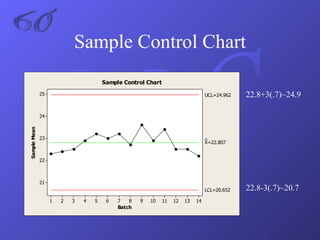
- An explanation of Six Sigma methodology and associated statistical measures and tools like DMAIC, control charts, and Pareto charts.
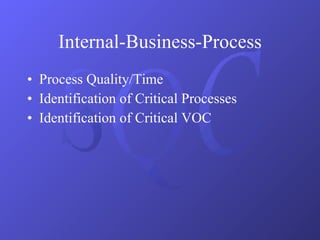
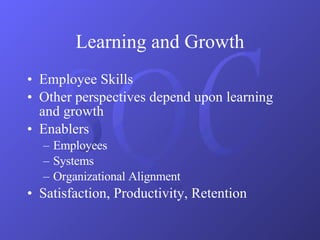
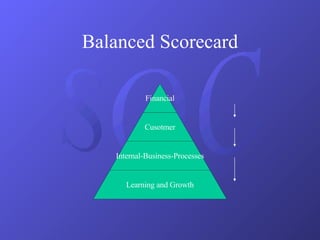
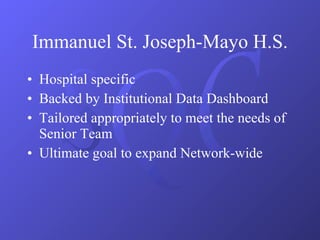
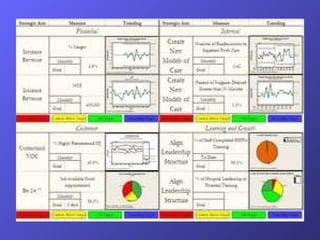
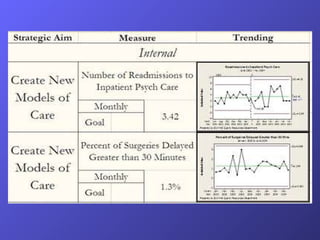
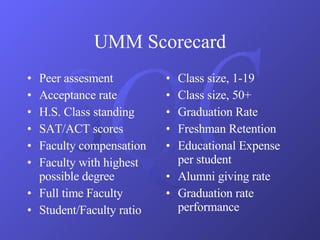
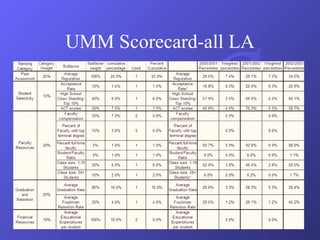
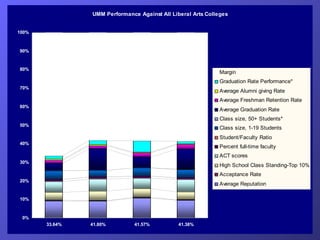
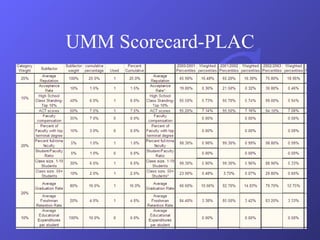
- A discussion of how balanced scorecards can be used to communicate strategy and align organizational goals across financial, customer, internal processes, and learning/growth perspectives.
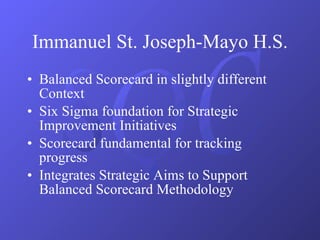
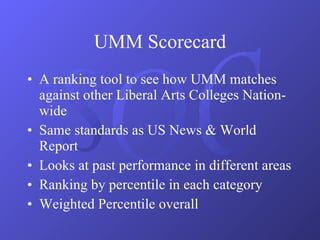
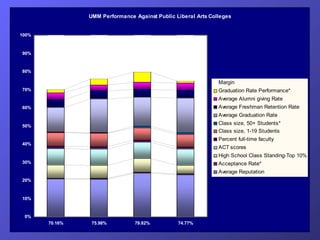
- Examples of balanced scorecards implemented at a healthcare organization and the University of Minnesota Morris campus.


![Process Capability[1]](https://cdn.slidesharecdn.com/ss_thumbnails/processcapability1-1226090261326164-9-thumbnail.jpg?width=640&height=640&fit=bounds)


