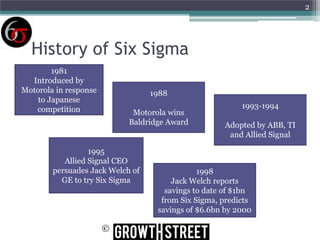
1

Introduction to Six
Sigma

Trainers: Priyank Tewari and Shashank Sharma
2

History of Six Sigma
1981
Introduced by
Motorola in response
to Japanese
competition

1988
Motorola wins
Baldridge Award

1995
Allied Signal CEO
persuades Jack Welch of
GE to try Six Sigma

©

1993-1994
Adopted by ABB, TI
and Allied Signal

1998
Jack Welch reports
savings to date of $1bn
from Six Sigma, predicts
savings of $6.6bn by 2000
3

Six Sigma
• There is a cause and effect in all processes and
transactions -India, 2000 BC
• Systems and Transactions exhibit a certain amount of
inherent variability no matter how well they are
designed. This follows the normal distribution
- Germany, 18th Century
• Inherent variability is worsened by causes that are
discoverable – Dr. Shewhart , Deming etc
©
4

What is Six Sigma
Six Sigma is a highly disciplined process that helps focus
on developing and delivering near- perfect products and
services
Why “Sigma”?
• The word is a statistical term that measures how far a
given process deviates from perfection. The central idea
behind Six Sigma is that if you can measure how
“defects” you have in a process, you can systematically
figure out how to eliminate them and get as close to
“zero defects” as possible
©
5

What is Six Sigma?
• A Philosophy
• A Statistical Measurement-3.4 defects per million
opportunities
• A Business Strategy
• A Project Management Framework- DMAIC Approach

©
6

Where should we focus ? Defects in
Products or Processes?
• Defects can be present in the processes or products
or both. Can you think of an example?
• What should we be targeting?- Process or Product
Process

Product

• 6 Sigma deals with processes and not productswhether the process is consistent and predictable is
the what we look at in six sigma analysis.
©
7

Variation is the spice of life and the
enemy of quality
• More the variation in the process, more is the
inconsistency
leading to lower predictability

Process
Capability

Variation
©
8

Six Sigma Vs Traditional Business Excellence
Traditional

Six Sigma

Quality Program

Business Strategy

Mainly involve quality department

Involves everyone, including
management

Focus on defects in products

Focusses on processes which
create defects

Driven by Cost of Quality

Driven by Voice of Customer

Focus on training

Focus on application
– project oriented

©
9

Understanding the difference

©
10

If previous comparison is not clear
Why isn’t 99.9% (4.6 sigma)already GOOD
ENOUGH in our daily lives
It would mean:
• 4000 wrong medical prescriptions each year
• More than 3000 new borns accidently falling
from the hands of nurses or doctors each year

• 400 letters per hour would never arrive at their
destination
©
11

Which sigma should an organisation go for?
This depends upon:
• Criticality of the Industry: Hospitals , Aviation ,
Aerospace need more sigma than a bag maker
• Voice of the Customers: Customers buying look
alikes of Nike, Samsonite etc. don’t expect their product
to be absolutely defect free. They are ready to accept
few defects as the price paid for the product is low
• Volume of the Products: Higher the volume, higher
should be the sigma so that less and less number of
products are produced
©
12

Six Sigma Approach
Business Problem

Statistical Problem

Business Solution

Statistical Solution

©
13

Six Sigma Terms and Definitions
1)

Customer: Anyone who receives a product, service or information from an
operation or a process. Customer can be internal or external.

2)

CTQ: Critical to Quality Characteristics. It is a characteristic of a product,
service or information which is important to the customer. CTQs must be
measurable in either quantitative (time, quantity) or qualitative manner (
correct , incorrect).

3)

Opportunity: Any event which generates an output (product, service or
information)

4)

Unit: A discrete item (lamp, invoice etc) which possesses one or more
CTQ

©
14

Six Sigma Terms and Definitions
5) DPMO: Defects per million opportunities- the number of defects
counted, divided by the actual number of opportunities to generate that
defect, multiplied by one million. This is a better measure than DPU and is
used extensively in Six Sigma.
6)Cost of Quality: Costs in an industry can be of 3 typesa)Appraisal Cost: Cost of detecting defects (testing, inspection)
b)Prevention Cost: Cost incurred in preventing defects from happening
c)Failure Cost or Cost of Poor Quality(COP): Cost to fix the defects
Adding all three gives the Cost of Quality(COQ). COQ is an investment to
increase quality but it should not go more than 15-18% of the cost of
production.
Six Sigma gives a lot of stress on Prevention Cost through things such as
Trainings and Process Improvements.
©
15

Six Sigma Terms and Definitions
7) KPIV (Key Process INPUT Variable): an independent material or
element, with descriptive characteristics, which has a significant effect
on the output of the process
8)KPOV (Key Process OUTPUT Variables): a dependant material or
element, with descriptive characteristics, which is the result of a
process and affects the customer CTQs

©
16

Dynamics of Execution Strategy:
The Funnel Effect

©
17

Define Phase
• It is the first phase of a SIX SIGMA project.As the name suggests,
this phase largely involves defining the Business Problem and giving
shape to the project
What does this phase involve?
1) Identify the problems/ opportunity
2) Collect Voice of the Customer(VOC)
3) Identify CTQs from VOC
4) Prioritize the CTQs
5) Define the Project Charter
6) Study the SIPOC, As-Is process map.

©
18

Gathering VOC and translating it into CTQs
Gather Verbatim
VOC & Determine
Service Quality
Issue

Identify Customer
Segments that
need to be targeted

Translate to
needs statement
& develop a CTQ

Translating VOC to CTQ: Example

Verbatim
•
•

Specific Needs
•
•

You take too much time in getting
back to me
These forms are too cumbersome

©

Quick Response
User Friendly Forms

CTQS
•
•

Process turn around time not more
than 10 mins
Form less than 2 pages
19

Logical Metrics Architecture
Critical to Business

Critical to
Quality

Processes

Sub
Processes

Sub
Processes
©

Critical to
Quality

Processes

Processes

Sub
Processes

Sub
Processes
20

Prioritize the CTQs: KANO Model
Innovation

Competitive Priority

Critical Priority

©
21

Logical Metrics Architecture
• It is a flow down from CTBs to the Sub Processes
• In order to take care of CTBs we need to look at the CTQs.
Both are generally derived from VOC.
• CTQs can be controlled by controlling the Processes , which
can further be controlled by controlling the Sub Processes
Activity: There are long queues at the Gurgaon Toll Plaza, which
is huge problem for the commuters. Can you draw a LMA to
identify the CTBs, CTQs and the processes

©
22

Process Mapping and Benefits

The deeper you go in the processes better will be your understanding about the real problems.
So don’t stop at the first level, do a deep dive into the processes and the sub processes .
There should be feedbacks from Customers and the Process Owners to the previous steps
which will act as CTQs

©
23

Six Sigma Project Charter

©
24

Last step in the define phase: GRPI
The last step in the define phase is the GRPI
1) Goals: How clear are we on the mission and goals of
our team/ projects?
2) Roles: How well do we understand and agree on, and
fulfil the roles and responsibilities for our team
3) Processes: To what degree do we understand and agree
on the way we will approach our project
4) Interpersonal: Are the relationships on our team
working well so far?
Ratings on this have to be given throughout the project to
evaluate the clarity on each issue.
©
25

Great Project: An Introspection at
each step of the project
• Be clearly bound with defined goals
• Be aligned with critical business issues and
initiatives
• Be felt by the customer
• Synergy: Work with other projects for combined
effect
• Show improvement that is locally actionable but
is felt else where also
• Relate to your day job
©
26

The Measure Phase
Measure Phase of Lean Six Sigma Project is the second
phase. Following are the key goals of this phase:
• Identify all possible causes for the problem we are trying
to solve
• Validate Measurement System, Data Collection
processes & Sampling

©
27

Cause and Effect Analysis
• In the measure phase of a Lean Six Sigma Project, the team brainstorms to
identify all possible causes or reasons for the occurrence of the problem.
Thus, there is a direct linkage between a project charter and this
deliverable.
• Fish-bone diagram also called the Ishikawa Diagram is a structured
brainstorming method used to carry out this activity.
• After completing this brainstorming, the team applies the 5-why technique
to further explore the underlying causes for all the reasons identified in the
fish-bone diagram.
• At the end of these two activities, the team has an exhaustive list of possible
causes for the problem. Usually there are around 50~100 possible causes
for the problem. It is the responsibility of Six Sigma Green Belt to facilitate
these activities.
©
28

Cause and Effect Analysis

©
29

Cause and Effect Analysis
• Fishbone diagram when combined with the 5 Why analysis leads us
to the root cause of the problem

• 5 Why Analysis: Get to the root of every Major Cause identified for a
particular problem. Be inquisitive and think with an open mind. Try
to point as many causes as possible
Lets solve the Age Old Traffic Problem on the Indian Roads

©
30

Cause and Effect
How should we carry it out?
• Brainstorming without any prior preparation as the methodology

• Be sure that everyone in the team agrees on the problem statement
• Bring down the problem statement to a level more in detail as
compared to the statement in the Project Charter
• Follow the principle of 5Whys, keep asking “Why” till the group
arrives at a logical end to the chain of causes.

©
31

Data Collection Plan: Metrics Definition Document
Creating the Metrics Definition Document: This document is very similar to
the Project Charter in the Define Phase
Why Collect
Data?
The purpose
of the Data
Collection
Exercise

What to
collect?

• Identify the
measures
• Define
Operational
Definitions
• What Data to
be collected

©

How to collect
?
• Formulate Data
Collection Plan
• Sampling
Strategy

Ensure
Consistency
and Stability
Develop
Measurement
System Analysis
and check for
1)Accuracy
2)Repeatability
3)Reproducibility
32

Data Collection Plan: a snapshot
Measure Operational Definition Target Method/Source Unit of Measure

Any transaction getting
Number of
GAMX Rejection
rejected in Misc Step 0.10%
Rejections
Report
Processing

Nos

Sample
No Sampling.
Entire
Population
Data
Collected

Sampling
Reporting plan
Collection Frequency Sample Size Reported On Reporting to Time Frame

Daily

6803

Every Monday Manager

1 month

What should a measure be?
• Metrics of CTQs and Metrics of Sub Processes
• Measure should be defined in a layman language and operational definition created
• Measures should be quantitative. How much? Numbers, Volumes etc.
• Measures should be written according to the targets
©
33

Sampling
What is sampling all about?
• Sampling is a process of collection a portion or a sub-set of the total
data available. The sample so drawn up from the population should
help us to draw conclusions about the population.

When is sampling done?
• Collecting all the data is impractical
• Time availability
• High cost implications due to population study
• When data collection is a destructive exercise
When not to sample?
• Population is homogenous
©
34

Types of Sampling
Types of Sampling

Random/ Probability
All items in the population have an
equal chance of getting selected

• Cycle tyres being
produced in the assembly
line have a random check
on a daily basis

©

Non Random/
Judgemental
The groups knowledge and opinions are
used to identify items from the population

• Every third tyre used in
an aircraft is inspected
• Based on criterions:
Only those people will be
selected who are wearing
blue
35

Approaches for Sampling

Process
Sampling

Population
Sampling

1)Systematic Sampling: Measurement of AC
Room Temperature. Collect one data point
every one hour for the entire day

1)Random Sampling : Survey across our
organisation to know what percentage of our
employees have visited the intranet in last 7
days

2)Rational Sub Grouping: While studying the
arrival rates of documents as dispatched by the
customer. The entire day is split up into
quadrants, rational being the arrival rate is
similar within each quadrant and different
between quadrants

2)Stratified Random Sampling: Average Cycle
Time for Ration Card issuance in different
countries. Each country is a strata(segment).
Collect random data from each strata.

©
36

Measurement System Analysis (MSA)
MSA is used to measure the correctness of the data. This is important
before we proceed for the final analysis.

What factors do we look for during MSA?
1)Accuracy: Measures the differences between observed average
measurement against the standard.
2)Repeatability: Measures the variation when one Operator repeatedly
takes the measurements of the same unit with the same measuring
equipment.
3)Reproducibility: Measures variation when various Operators
measure the same unit with the same equipment

©
37

What kind of variable types do you measure?
Data Types

Discrete

•
•
•
•

Continous

Nominal: Names, Colours which do not
•
have a relationship between each other
Ordinal: Extremely Satisfied, Not Satisfied
Binary: 0,1 ; yes, no.
Count: number of people, defects
•

©

Interval Data : A interval variable is a
measurement where the difference
between two values is meaningful. The
difference between a temperature of 100
degrees and 90 degrees is the same
difference as between 90 degrees and 80
degrees.
Ratio variables: Are like Interval data but
have an absolute zero.
38

Exercise- Type of Data
1) Percent defective parts in hourly production

2) Percent Cream content in milk bottles
3) Amount of time it takes to respond to a request
4) Daily test of water acidity

5) Number of employees who had a baby
©
39

How good are our measuring
systems?... MSA continued
Tests conducted to examine the effectiveness of the measuring system:
1) Nominal variables :Fleiss Kappa Test done on Nominal variables.
Kappa value can go from -1 to +1.
If kappa value is greater than 0.9 then your measurement system is
good.
If 0.7<kappa<0.9 then system is questionable.
If kappa<0.7 then the measuring system is not good.
2) Ordinal Variables: Kendall’s coefficient of concordance. We get a p
value, which should be less that o.05 if the measurement systems are
good. For an ordinal variable we also have to do Fleiss Kappa test in
addition to the Kendall’s test.

©
40

How good are our measuring
systems?... MSA continued
3) Continuous Variables: Gauge R&R Test. We look for a value called
%SV.
If %SV<10% then measurement system is good
If 10%<SV<30% measurement system is questionable
If %SV>30% then measurement system is not good

©
41

Lets take few examples
Part
1
1
1
2
2
2
3
3
3

Tester Defect Type
1
Logic
2
Standard
3
Standard
1
Logic
2
Logic
3
Logic
1
Cosmetic
2
Cosmetic
3
Cosmetic

©

Part
1
1
1
2
2
2
3
3
3

Tester
1
2
3
1
2
3
1
2
3

Length
3
3.3
3.5
3.5
3.5
3.1
3.2
3.2
3.5
42

Hypothesis Testing
Testing our Hypothesis
• We start with what we call as the Null Hypothesis
• Null Hypothesis is the hypothesis is what we want to
test
• We also have an alternate hypothesis
• p value helps us to accept or reject the Null
Hypothesis
• p value <0.05 then Null Hypothesis is rejected

©
43

Example of Hypothesis testing
• Lets check whether our data follows normal
distribution or not
• There is test called the Anderson Darlington
Normality Test
• Null Hypothesis is always a statement of equality
• Whats the Null Hypothesis here?
-That the data is= normal
-if p value of the test is >0.05 then the data is
normal
©
44

Analyse Phase
Third phase of the Lean Six Sigma Project is the Analyse
Phase. This phase deals with :
• Data Collection in depth, Study the processes and their
stability in depth. Calculate the current sigma at which
the organisation is operating
• Statistically validate root causes: establish the
relationship between CTQs and causes identified. Also
establish relationships between CTBs and CTQs.
• Control & Impact Matrix: Attack the causes that can be
tackled with minimal effort and cost
©
45

Process Stability

Cp is not enough, we need more metrics to measure the stability of
the process. Can you think why? Can we draw more graphs?
Cpk is another measure.
©
46

Run Charts

How are they useful??
©
47

Rolled Throughput Yield
Rework
(10)

Rework
(10)
90

100

Rework
(10)
70

80

Step 1

Step 2

Step 3

Scrap
(10)

Scrap
(10)

Scrap
(10)

What is the efficiency of the process??

©
48

Sigma Calculation and DPMO
• Sigma calculation of the process is done using the Sigma Table and
the observed Defects per Million Opportunities(DPMO).

• DPMO= Number of Defects*1000000/(Number of units*Number of
Opportunities of defect per unit)
• DPMO value can be looked up in the SIGMA Table

Q) Number of defects in a lot of 1000 bottles 4. Each bottle goes
through 5 different stages of inspection, each stage looking for a
possible defect. Calculate the Sigma of the process.

©
49

Further deep dive into the root causes
• A Pareto chart is drawn between the causes of a fault and the
number of times they occur.
• Typically we look into the causes that cause the maximum
damage. Most common Pareto numbers being 20% of the
causes being able to tackle 80% of the faults.
• Revisit the Process Map (SIPOC) and figure out which
processes cause the majority of the faults. Fixing them is
important.

©
50

Work value Analysis
All activities in an organisation can be divided into :
1) Value Added Work: Steps that are essential for the process and
the customer is willing to pay for them e.g. R&D, Process
Improvement
2) Non value Added Work: Repetitive in nature, non essential for the
process and the customer is not willing to pay for them
3) Value Enabling Work: Essential for the process. Even if the
customer is not willing to pay for them we do it. E.g. Trainings,
Audits
Large number of loops in a Process map suggest that there are a lot of
Non Value Added Activities in the process and one needs to get rid of
them.
©
51

Cycle Time Analysis

Experts say that 66% of the time spent in a process can be targeted for
reduction which is usually spent in activities like:
• Movement
• Storage
• Waiting Time
Idea is to get rid of Non Value Added Activities which are adding to the
Cycle Time without contributing to the process.
©
52

Regression to establish relationship
between the cause and the effect
• Regression Analysis between CTQs and the Sub Process
Parameters is performed to establish the relationship
between them.
• Sub Processes and the parameters which are able to
explain the CTQs are prioritised.
• Also regression analysis between CTQs and CTBs is
performed to see how much of CTBs can be explained by
the CTQs that we have.
©
53

Linear Regression Parameters
• p value: This has to be < 0.05

• Adjusted Rsquare > 80%
• p value of individual variables <0.05
• VIF <10

©
54

Control Impact Matrix
High

Impact

The Difficult
Piece… Use Change
management
Strategy

Target them
now!!!
Do a Cost benefit
analysis and then
decide

Low

Low

High
In our control

When we know the possible root causes, can we attack all???

©

Session 5

  • 1.
    1 Introduction to Six Sigma Trainers:Priyank Tewari and Shashank Sharma
  • 2.
    2 History of SixSigma 1981 Introduced by Motorola in response to Japanese competition 1988 Motorola wins Baldridge Award 1995 Allied Signal CEO persuades Jack Welch of GE to try Six Sigma © 1993-1994 Adopted by ABB, TI and Allied Signal 1998 Jack Welch reports savings to date of $1bn from Six Sigma, predicts savings of $6.6bn by 2000
  • 3.
    3 Six Sigma • Thereis a cause and effect in all processes and transactions -India, 2000 BC • Systems and Transactions exhibit a certain amount of inherent variability no matter how well they are designed. This follows the normal distribution - Germany, 18th Century • Inherent variability is worsened by causes that are discoverable – Dr. Shewhart , Deming etc ©
  • 4.
    4 What is SixSigma Six Sigma is a highly disciplined process that helps focus on developing and delivering near- perfect products and services Why “Sigma”? • The word is a statistical term that measures how far a given process deviates from perfection. The central idea behind Six Sigma is that if you can measure how “defects” you have in a process, you can systematically figure out how to eliminate them and get as close to “zero defects” as possible ©
  • 5.
    5 What is SixSigma? • A Philosophy • A Statistical Measurement-3.4 defects per million opportunities • A Business Strategy • A Project Management Framework- DMAIC Approach ©
  • 6.
    6 Where should wefocus ? Defects in Products or Processes? • Defects can be present in the processes or products or both. Can you think of an example? • What should we be targeting?- Process or Product Process Product • 6 Sigma deals with processes and not productswhether the process is consistent and predictable is the what we look at in six sigma analysis. ©
  • 7.
    7 Variation is thespice of life and the enemy of quality • More the variation in the process, more is the inconsistency leading to lower predictability Process Capability Variation ©
  • 8.
    8 Six Sigma VsTraditional Business Excellence Traditional Six Sigma Quality Program Business Strategy Mainly involve quality department Involves everyone, including management Focus on defects in products Focusses on processes which create defects Driven by Cost of Quality Driven by Voice of Customer Focus on training Focus on application – project oriented ©
  • 9.
  • 10.
    10 If previous comparisonis not clear Why isn’t 99.9% (4.6 sigma)already GOOD ENOUGH in our daily lives It would mean: • 4000 wrong medical prescriptions each year • More than 3000 new borns accidently falling from the hands of nurses or doctors each year • 400 letters per hour would never arrive at their destination ©
  • 11.
    11 Which sigma shouldan organisation go for? This depends upon: • Criticality of the Industry: Hospitals , Aviation , Aerospace need more sigma than a bag maker • Voice of the Customers: Customers buying look alikes of Nike, Samsonite etc. don’t expect their product to be absolutely defect free. They are ready to accept few defects as the price paid for the product is low • Volume of the Products: Higher the volume, higher should be the sigma so that less and less number of products are produced ©
  • 12.
    12 Six Sigma Approach BusinessProblem Statistical Problem Business Solution Statistical Solution ©
  • 13.
    13 Six Sigma Termsand Definitions 1) Customer: Anyone who receives a product, service or information from an operation or a process. Customer can be internal or external. 2) CTQ: Critical to Quality Characteristics. It is a characteristic of a product, service or information which is important to the customer. CTQs must be measurable in either quantitative (time, quantity) or qualitative manner ( correct , incorrect). 3) Opportunity: Any event which generates an output (product, service or information) 4) Unit: A discrete item (lamp, invoice etc) which possesses one or more CTQ ©
  • 14.
    14 Six Sigma Termsand Definitions 5) DPMO: Defects per million opportunities- the number of defects counted, divided by the actual number of opportunities to generate that defect, multiplied by one million. This is a better measure than DPU and is used extensively in Six Sigma. 6)Cost of Quality: Costs in an industry can be of 3 typesa)Appraisal Cost: Cost of detecting defects (testing, inspection) b)Prevention Cost: Cost incurred in preventing defects from happening c)Failure Cost or Cost of Poor Quality(COP): Cost to fix the defects Adding all three gives the Cost of Quality(COQ). COQ is an investment to increase quality but it should not go more than 15-18% of the cost of production. Six Sigma gives a lot of stress on Prevention Cost through things such as Trainings and Process Improvements. ©
  • 15.
    15 Six Sigma Termsand Definitions 7) KPIV (Key Process INPUT Variable): an independent material or element, with descriptive characteristics, which has a significant effect on the output of the process 8)KPOV (Key Process OUTPUT Variables): a dependant material or element, with descriptive characteristics, which is the result of a process and affects the customer CTQs ©
  • 16.
    16 Dynamics of ExecutionStrategy: The Funnel Effect ©
  • 17.
    17 Define Phase • Itis the first phase of a SIX SIGMA project.As the name suggests, this phase largely involves defining the Business Problem and giving shape to the project What does this phase involve? 1) Identify the problems/ opportunity 2) Collect Voice of the Customer(VOC) 3) Identify CTQs from VOC 4) Prioritize the CTQs 5) Define the Project Charter 6) Study the SIPOC, As-Is process map. ©
  • 18.
    18 Gathering VOC andtranslating it into CTQs Gather Verbatim VOC & Determine Service Quality Issue Identify Customer Segments that need to be targeted Translate to needs statement & develop a CTQ Translating VOC to CTQ: Example Verbatim • • Specific Needs • • You take too much time in getting back to me These forms are too cumbersome © Quick Response User Friendly Forms CTQS • • Process turn around time not more than 10 mins Form less than 2 pages
  • 19.
    19 Logical Metrics Architecture Criticalto Business Critical to Quality Processes Sub Processes Sub Processes © Critical to Quality Processes Processes Sub Processes Sub Processes
  • 20.
    20 Prioritize the CTQs:KANO Model Innovation Competitive Priority Critical Priority ©
  • 21.
    21 Logical Metrics Architecture •It is a flow down from CTBs to the Sub Processes • In order to take care of CTBs we need to look at the CTQs. Both are generally derived from VOC. • CTQs can be controlled by controlling the Processes , which can further be controlled by controlling the Sub Processes Activity: There are long queues at the Gurgaon Toll Plaza, which is huge problem for the commuters. Can you draw a LMA to identify the CTBs, CTQs and the processes ©
  • 22.
    22 Process Mapping andBenefits The deeper you go in the processes better will be your understanding about the real problems. So don’t stop at the first level, do a deep dive into the processes and the sub processes . There should be feedbacks from Customers and the Process Owners to the previous steps which will act as CTQs ©
  • 23.
  • 24.
    24 Last step inthe define phase: GRPI The last step in the define phase is the GRPI 1) Goals: How clear are we on the mission and goals of our team/ projects? 2) Roles: How well do we understand and agree on, and fulfil the roles and responsibilities for our team 3) Processes: To what degree do we understand and agree on the way we will approach our project 4) Interpersonal: Are the relationships on our team working well so far? Ratings on this have to be given throughout the project to evaluate the clarity on each issue. ©
  • 25.
    25 Great Project: AnIntrospection at each step of the project • Be clearly bound with defined goals • Be aligned with critical business issues and initiatives • Be felt by the customer • Synergy: Work with other projects for combined effect • Show improvement that is locally actionable but is felt else where also • Relate to your day job ©
  • 26.
    26 The Measure Phase MeasurePhase of Lean Six Sigma Project is the second phase. Following are the key goals of this phase: • Identify all possible causes for the problem we are trying to solve • Validate Measurement System, Data Collection processes & Sampling ©
  • 27.
    27 Cause and EffectAnalysis • In the measure phase of a Lean Six Sigma Project, the team brainstorms to identify all possible causes or reasons for the occurrence of the problem. Thus, there is a direct linkage between a project charter and this deliverable. • Fish-bone diagram also called the Ishikawa Diagram is a structured brainstorming method used to carry out this activity. • After completing this brainstorming, the team applies the 5-why technique to further explore the underlying causes for all the reasons identified in the fish-bone diagram. • At the end of these two activities, the team has an exhaustive list of possible causes for the problem. Usually there are around 50~100 possible causes for the problem. It is the responsibility of Six Sigma Green Belt to facilitate these activities. ©
  • 28.
  • 29.
    29 Cause and EffectAnalysis • Fishbone diagram when combined with the 5 Why analysis leads us to the root cause of the problem • 5 Why Analysis: Get to the root of every Major Cause identified for a particular problem. Be inquisitive and think with an open mind. Try to point as many causes as possible Lets solve the Age Old Traffic Problem on the Indian Roads ©
  • 30.
    30 Cause and Effect Howshould we carry it out? • Brainstorming without any prior preparation as the methodology • Be sure that everyone in the team agrees on the problem statement • Bring down the problem statement to a level more in detail as compared to the statement in the Project Charter • Follow the principle of 5Whys, keep asking “Why” till the group arrives at a logical end to the chain of causes. ©
  • 31.
    31 Data Collection Plan:Metrics Definition Document Creating the Metrics Definition Document: This document is very similar to the Project Charter in the Define Phase Why Collect Data? The purpose of the Data Collection Exercise What to collect? • Identify the measures • Define Operational Definitions • What Data to be collected © How to collect ? • Formulate Data Collection Plan • Sampling Strategy Ensure Consistency and Stability Develop Measurement System Analysis and check for 1)Accuracy 2)Repeatability 3)Reproducibility
  • 32.
    32 Data Collection Plan:a snapshot Measure Operational Definition Target Method/Source Unit of Measure Any transaction getting Number of GAMX Rejection rejected in Misc Step 0.10% Rejections Report Processing Nos Sample No Sampling. Entire Population Data Collected Sampling Reporting plan Collection Frequency Sample Size Reported On Reporting to Time Frame Daily 6803 Every Monday Manager 1 month What should a measure be? • Metrics of CTQs and Metrics of Sub Processes • Measure should be defined in a layman language and operational definition created • Measures should be quantitative. How much? Numbers, Volumes etc. • Measures should be written according to the targets ©
  • 33.
    33 Sampling What is samplingall about? • Sampling is a process of collection a portion or a sub-set of the total data available. The sample so drawn up from the population should help us to draw conclusions about the population. When is sampling done? • Collecting all the data is impractical • Time availability • High cost implications due to population study • When data collection is a destructive exercise When not to sample? • Population is homogenous ©
  • 34.
    34 Types of Sampling Typesof Sampling Random/ Probability All items in the population have an equal chance of getting selected • Cycle tyres being produced in the assembly line have a random check on a daily basis © Non Random/ Judgemental The groups knowledge and opinions are used to identify items from the population • Every third tyre used in an aircraft is inspected • Based on criterions: Only those people will be selected who are wearing blue
  • 35.
    35 Approaches for Sampling Approachesfor Sampling Process Sampling Population Sampling 1)Systematic Sampling: Measurement of AC Room Temperature. Collect one data point every one hour for the entire day 1)Random Sampling : Survey across our organisation to know what percentage of our employees have visited the intranet in last 7 days 2)Rational Sub Grouping: While studying the arrival rates of documents as dispatched by the customer. The entire day is split up into quadrants, rational being the arrival rate is similar within each quadrant and different between quadrants 2)Stratified Random Sampling: Average Cycle Time for Ration Card issuance in different countries. Each country is a strata(segment). Collect random data from each strata. ©
  • 36.
    36 Measurement System Analysis(MSA) MSA is used to measure the correctness of the data. This is important before we proceed for the final analysis. What factors do we look for during MSA? 1)Accuracy: Measures the differences between observed average measurement against the standard. 2)Repeatability: Measures the variation when one Operator repeatedly takes the measurements of the same unit with the same measuring equipment. 3)Reproducibility: Measures variation when various Operators measure the same unit with the same equipment ©
  • 37.
    37 What kind ofvariable types do you measure? Data Types Discrete • • • • Continous Nominal: Names, Colours which do not • have a relationship between each other Ordinal: Extremely Satisfied, Not Satisfied Binary: 0,1 ; yes, no. Count: number of people, defects • © Interval Data : A interval variable is a measurement where the difference between two values is meaningful. The difference between a temperature of 100 degrees and 90 degrees is the same difference as between 90 degrees and 80 degrees. Ratio variables: Are like Interval data but have an absolute zero.
  • 38.
    38 Exercise- Type ofData 1) Percent defective parts in hourly production 2) Percent Cream content in milk bottles 3) Amount of time it takes to respond to a request 4) Daily test of water acidity 5) Number of employees who had a baby ©
  • 39.
    39 How good areour measuring systems?... MSA continued Tests conducted to examine the effectiveness of the measuring system: 1) Nominal variables :Fleiss Kappa Test done on Nominal variables. Kappa value can go from -1 to +1. If kappa value is greater than 0.9 then your measurement system is good. If 0.7<kappa<0.9 then system is questionable. If kappa<0.7 then the measuring system is not good. 2) Ordinal Variables: Kendall’s coefficient of concordance. We get a p value, which should be less that o.05 if the measurement systems are good. For an ordinal variable we also have to do Fleiss Kappa test in addition to the Kendall’s test. ©
  • 40.
    40 How good areour measuring systems?... MSA continued 3) Continuous Variables: Gauge R&R Test. We look for a value called %SV. If %SV<10% then measurement system is good If 10%<SV<30% measurement system is questionable If %SV>30% then measurement system is not good ©
  • 41.
    41 Lets take fewexamples Part 1 1 1 2 2 2 3 3 3 Tester Defect Type 1 Logic 2 Standard 3 Standard 1 Logic 2 Logic 3 Logic 1 Cosmetic 2 Cosmetic 3 Cosmetic © Part 1 1 1 2 2 2 3 3 3 Tester 1 2 3 1 2 3 1 2 3 Length 3 3.3 3.5 3.5 3.5 3.1 3.2 3.2 3.5
  • 42.
    42 Hypothesis Testing Testing ourHypothesis • We start with what we call as the Null Hypothesis • Null Hypothesis is the hypothesis is what we want to test • We also have an alternate hypothesis • p value helps us to accept or reject the Null Hypothesis • p value <0.05 then Null Hypothesis is rejected ©
  • 43.
    43 Example of Hypothesistesting • Lets check whether our data follows normal distribution or not • There is test called the Anderson Darlington Normality Test • Null Hypothesis is always a statement of equality • Whats the Null Hypothesis here? -That the data is= normal -if p value of the test is >0.05 then the data is normal ©
  • 44.
    44 Analyse Phase Third phaseof the Lean Six Sigma Project is the Analyse Phase. This phase deals with : • Data Collection in depth, Study the processes and their stability in depth. Calculate the current sigma at which the organisation is operating • Statistically validate root causes: establish the relationship between CTQs and causes identified. Also establish relationships between CTBs and CTQs. • Control & Impact Matrix: Attack the causes that can be tackled with minimal effort and cost ©
  • 45.
    45 Process Stability Cp isnot enough, we need more metrics to measure the stability of the process. Can you think why? Can we draw more graphs? Cpk is another measure. ©
  • 46.
    46 Run Charts How arethey useful?? ©
  • 47.
    47 Rolled Throughput Yield Rework (10) Rework (10) 90 100 Rework (10) 70 80 Step1 Step 2 Step 3 Scrap (10) Scrap (10) Scrap (10) What is the efficiency of the process?? ©
  • 48.
    48 Sigma Calculation andDPMO • Sigma calculation of the process is done using the Sigma Table and the observed Defects per Million Opportunities(DPMO). • DPMO= Number of Defects*1000000/(Number of units*Number of Opportunities of defect per unit) • DPMO value can be looked up in the SIGMA Table Q) Number of defects in a lot of 1000 bottles 4. Each bottle goes through 5 different stages of inspection, each stage looking for a possible defect. Calculate the Sigma of the process. ©
  • 49.
    49 Further deep diveinto the root causes • A Pareto chart is drawn between the causes of a fault and the number of times they occur. • Typically we look into the causes that cause the maximum damage. Most common Pareto numbers being 20% of the causes being able to tackle 80% of the faults. • Revisit the Process Map (SIPOC) and figure out which processes cause the majority of the faults. Fixing them is important. ©
  • 50.
    50 Work value Analysis Allactivities in an organisation can be divided into : 1) Value Added Work: Steps that are essential for the process and the customer is willing to pay for them e.g. R&D, Process Improvement 2) Non value Added Work: Repetitive in nature, non essential for the process and the customer is not willing to pay for them 3) Value Enabling Work: Essential for the process. Even if the customer is not willing to pay for them we do it. E.g. Trainings, Audits Large number of loops in a Process map suggest that there are a lot of Non Value Added Activities in the process and one needs to get rid of them. ©
  • 51.
    51 Cycle Time Analysis Expertssay that 66% of the time spent in a process can be targeted for reduction which is usually spent in activities like: • Movement • Storage • Waiting Time Idea is to get rid of Non Value Added Activities which are adding to the Cycle Time without contributing to the process. ©
  • 52.
    52 Regression to establishrelationship between the cause and the effect • Regression Analysis between CTQs and the Sub Process Parameters is performed to establish the relationship between them. • Sub Processes and the parameters which are able to explain the CTQs are prioritised. • Also regression analysis between CTQs and CTBs is performed to see how much of CTBs can be explained by the CTQs that we have. ©
  • 53.
    53 Linear Regression Parameters •p value: This has to be < 0.05 • Adjusted Rsquare > 80% • p value of individual variables <0.05 • VIF <10 ©
  • 54.
    54 Control Impact Matrix High Impact TheDifficult Piece… Use Change management Strategy Target them now!!! Do a Cost benefit analysis and then decide Low Low High In our control When we know the possible root causes, can we attack all??? ©