This document provides an overview of Six Sigma, including:
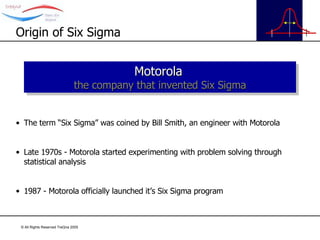
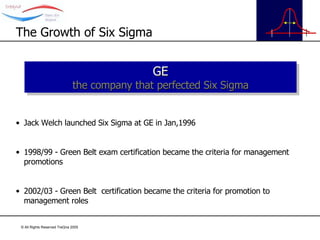
- What Six Sigma is and how it originated at Motorola and GE
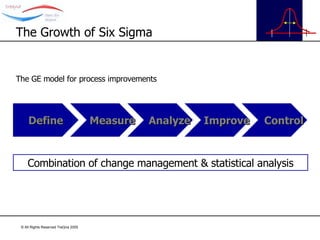
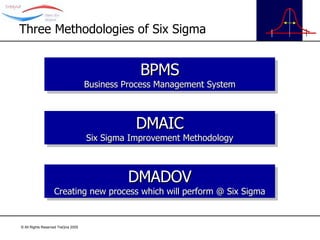
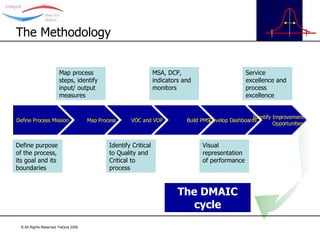
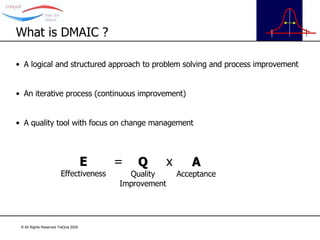
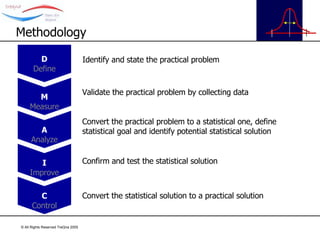
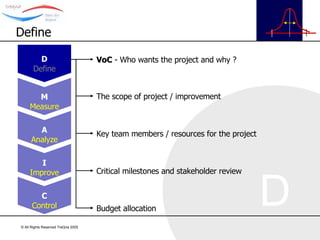
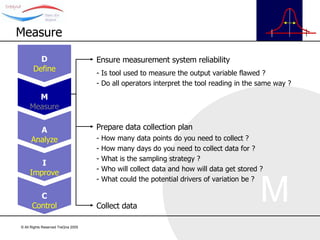
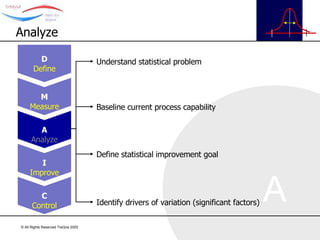
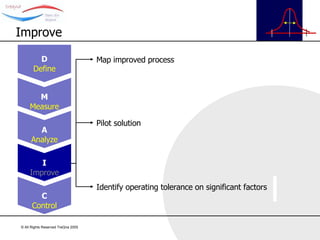
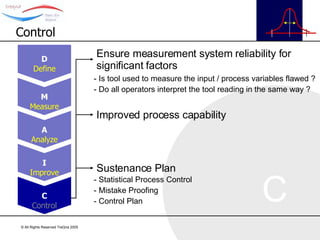
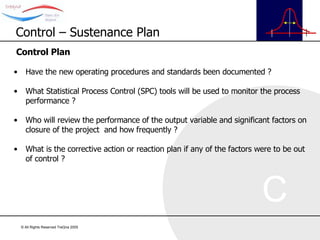
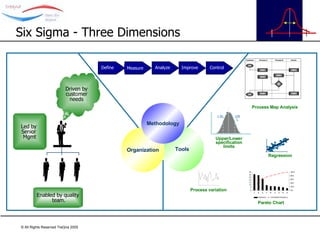
- The DMAIC methodology for process improvement and DMADOV for creating new processes
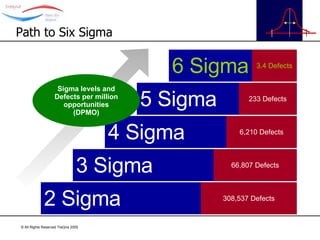
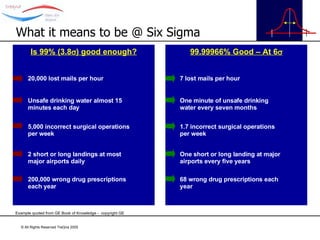
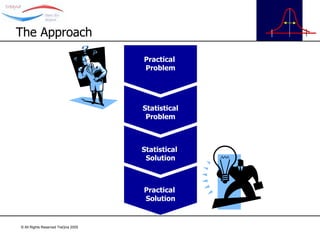
- How Six Sigma aims to reduce defects through statistical analysis and achieving 6 sigma capability
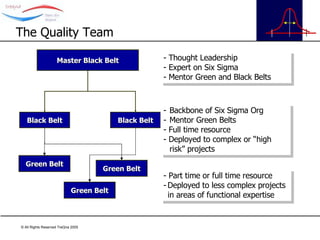
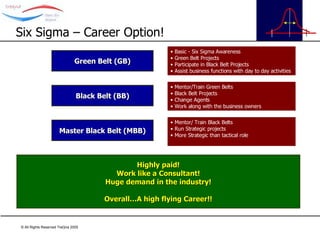
- Key roles in a Six Sigma organization such as Black Belts, Green Belts, and Master Black Belts