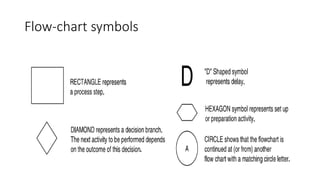
Process mapping and
documenting
Gift Ajay Sam
Lecturer-Quality Management
Department of Transfusion Medicine and Immunohaematology
CMC, Vellore
Overview
• Purpose
• About a process map
• Steps
• Common symbols
• Exercise
Roadmap to Quality2
• X1+X2+X3+Xn= Y
• X=Process variations
• Y= customer behaviour
• Phone calls at lab reception, clinician asking for results. Lab has 2
telephones at registration desk to address clinicians queries.
Define Measure Analyse Improve Control
Problem statement • Data collection plan
• Collect data
• Measure process
capability
• Process map
RCA
FMEA
CA/PA Measure the impact
Of CA/PA
Problem solving tools1
• Process mapping
• Check sheets
• Pareto analysis
• Cause and effect diagrams
• 7M tools
What is a process map?
• Companies are segmented into departments hence it is difficult for
the management to see the underlying process.
• Hence, process maps are a graphical representation of a process that
uses modified flow-chart symbols.
• The process map provides a picture of the work-flow within the
organization.
How to construct a process map?
1) Select a process to be mapped
2) Define the process: e.g. product development- concept to
prototype, Sales- prospect to order, Order fulfilment- order to
payment, Service- inquiry to resolution.
3) Map the primary process: Input-process-output
4) Map alternative paths
5) Identify inspection points
Flow-chart symbols
References
1) Thomas Pyzdek, The Six Sigma Handbook: Problem solving tools,
McGraw Hill- Companies, 252-255, 2003.
2) Thomas McCarty, Michael Bremer, The Six Sigma management
system: The Six Sigma Black Belt Handbook, McGraw Hill-
Companies, 21-24, 2004.

Problem solving tools: Process mapping

  • 1.
    Process mapping and documenting GiftAjay Sam Lecturer-Quality Management Department of Transfusion Medicine and Immunohaematology CMC, Vellore
  • 2.
    Overview • Purpose • Abouta process map • Steps • Common symbols • Exercise
  • 3.
    Roadmap to Quality2 •X1+X2+X3+Xn= Y • X=Process variations • Y= customer behaviour • Phone calls at lab reception, clinician asking for results. Lab has 2 telephones at registration desk to address clinicians queries.
  • 4.
    Define Measure AnalyseImprove Control Problem statement • Data collection plan • Collect data • Measure process capability • Process map RCA FMEA CA/PA Measure the impact Of CA/PA
  • 5.
    Problem solving tools1 •Process mapping • Check sheets • Pareto analysis • Cause and effect diagrams • 7M tools
  • 6.
    What is aprocess map? • Companies are segmented into departments hence it is difficult for the management to see the underlying process. • Hence, process maps are a graphical representation of a process that uses modified flow-chart symbols. • The process map provides a picture of the work-flow within the organization.
  • 7.
    How to constructa process map? 1) Select a process to be mapped 2) Define the process: e.g. product development- concept to prototype, Sales- prospect to order, Order fulfilment- order to payment, Service- inquiry to resolution. 3) Map the primary process: Input-process-output 4) Map alternative paths 5) Identify inspection points
  • 8.
  • 9.
    References 1) Thomas Pyzdek,The Six Sigma Handbook: Problem solving tools, McGraw Hill- Companies, 252-255, 2003. 2) Thomas McCarty, Michael Bremer, The Six Sigma management system: The Six Sigma Black Belt Handbook, McGraw Hill- Companies, 21-24, 2004.