Using CXL with AI
Applications
Memory Fabric Forum
Steve Scargall, Senior Product Manager
• CXL 1.1 Memory Expansion Form Factors
• Latency and Bandwidth Memory Placement Strategies
• RDBMS Investigation and Results
• Vector Database Investigation and Results
• Understanding Your Application Behavior
Agenda
2
CXL Memory Expansion Form Factors
3
E3.S Memory Modules
PCIe Add-In Cards (AICs)
DDR DIMMs
Add-in Card (AIC)
• Flexible capacity, up to 2 TB per card
• Higher bandwidth, up to x16 PCIe5 lanes
(~ 1x DDR5 channel)
E3.S Module
• Easy front loading, same as SSDs
• Fixed capacity – 128, 256, & 512 GB
• Lower bandwidth at x8 PCIe5 lanes
1. Configure CXL as ‘Special Purpose’ in the BIOS
2. The Linux Kernel creates a DEVDAX (/dev/daxX.Y)
3. Convert to a System-RAM namespace:
$ sudo daxctl reconfigure-device --mode=system-ram daxX.Y
4. CXL Memory appears as a new memory-only NUMA Node
Using CXL Type 3 Memory with Apps
4
# numactl -H
available: 3 nodes (0-2)
node 0 cpus: 0 1 2 3 4 5 6 7 8 9 10 11 …
node 0 size: 515714 MB
node 0 free: 2321 MB
node 1 cpus: 48 49 50 51 52 53 54 55 56 …
node 1 size: 516064 MB
node 1 free: 499038 MB
node 2 cpus:
node 2 size: 129023 MB  CXL Memory
node 2 free: 203 MB
node distances:
node 0 1 2
0: 10 21 14
1: 21 10 24
2: 14 24 10
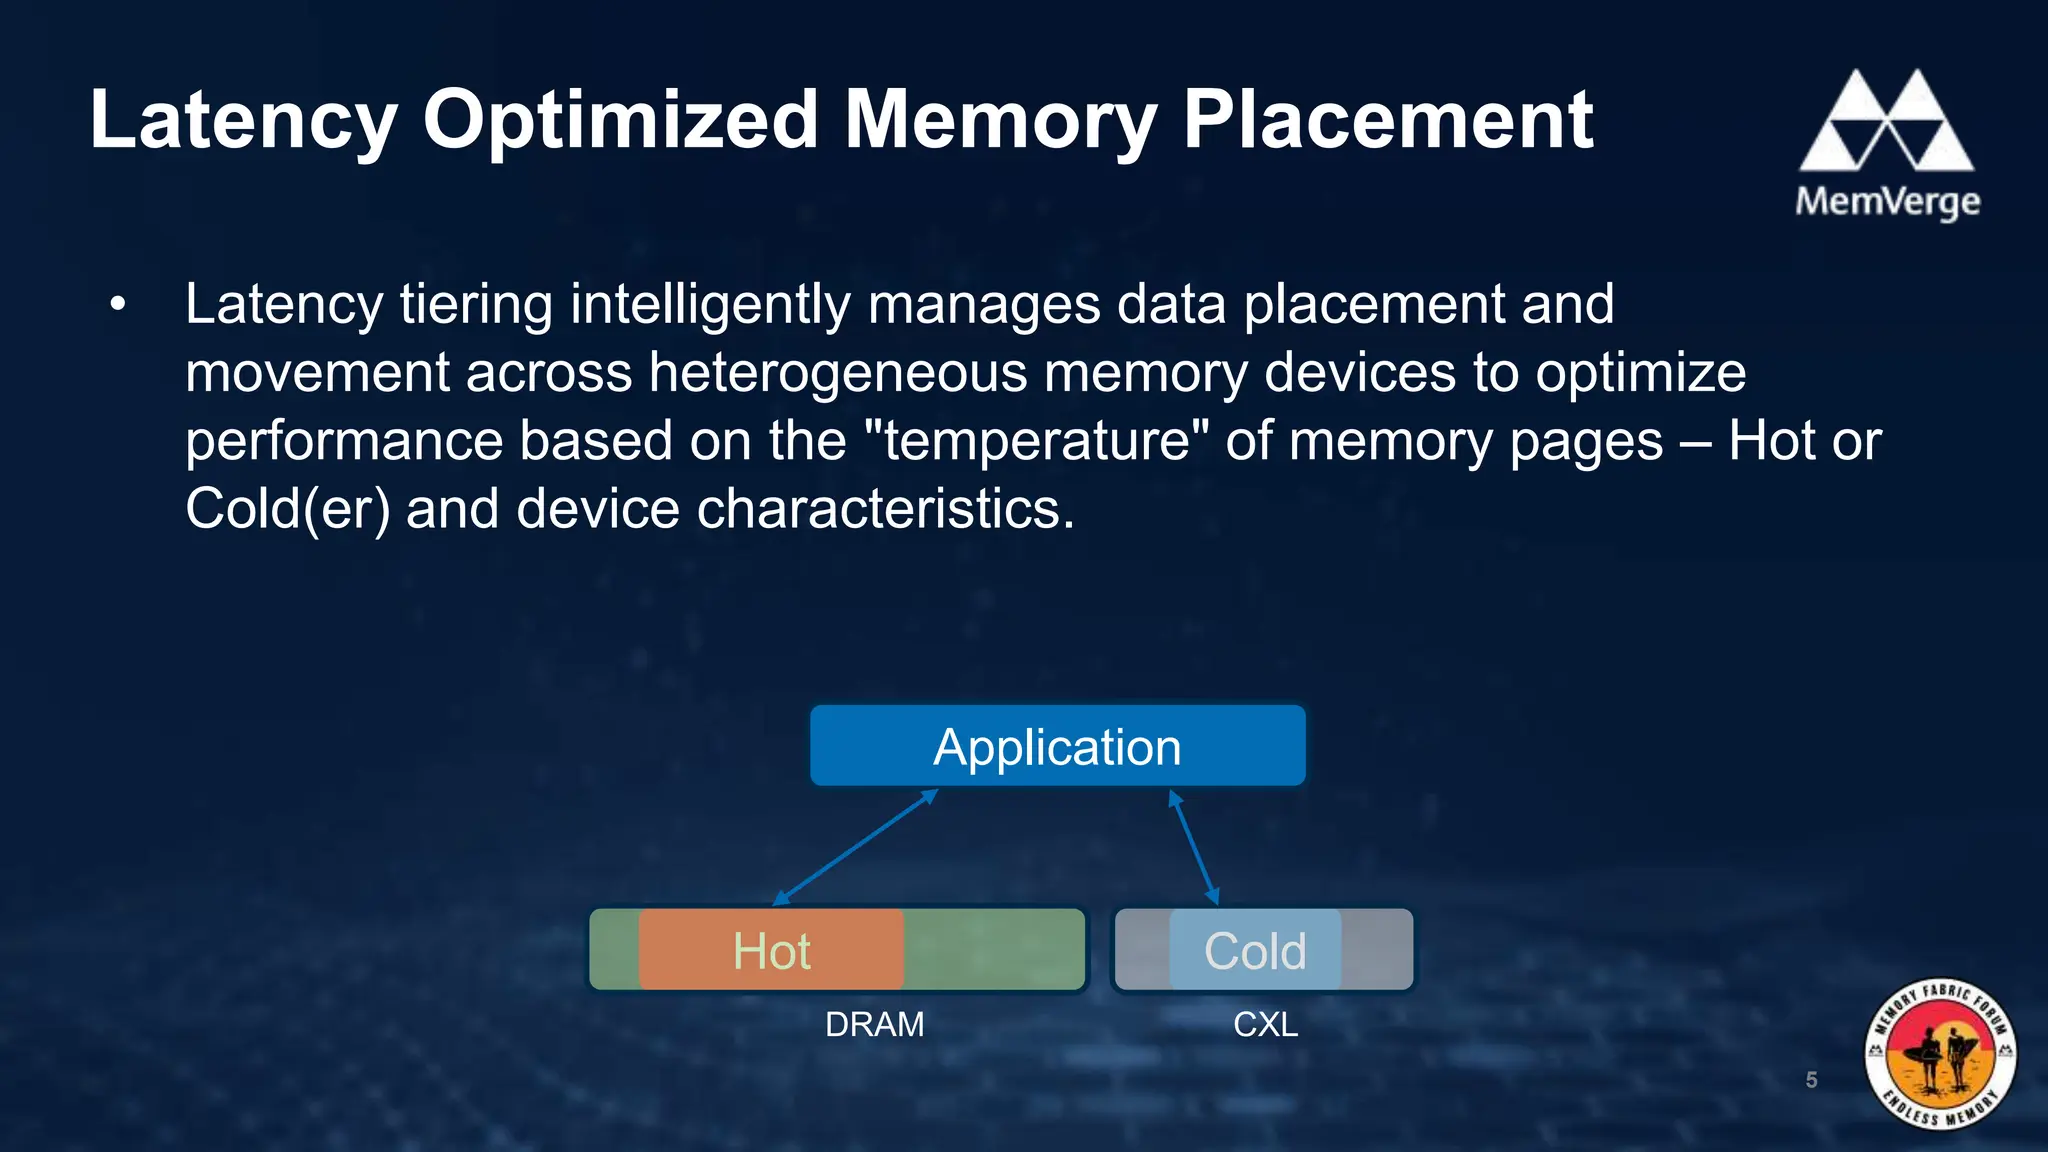
• Latency tiering intelligently manages data placement and
movement across heterogeneous memory devices to optimize
performance based on the "temperature" of memory pages – Hot or
Cold(er) and device characteristics.
Latency Optimized Memory Placement
5
Application
Hot Cold
DRAM CXL
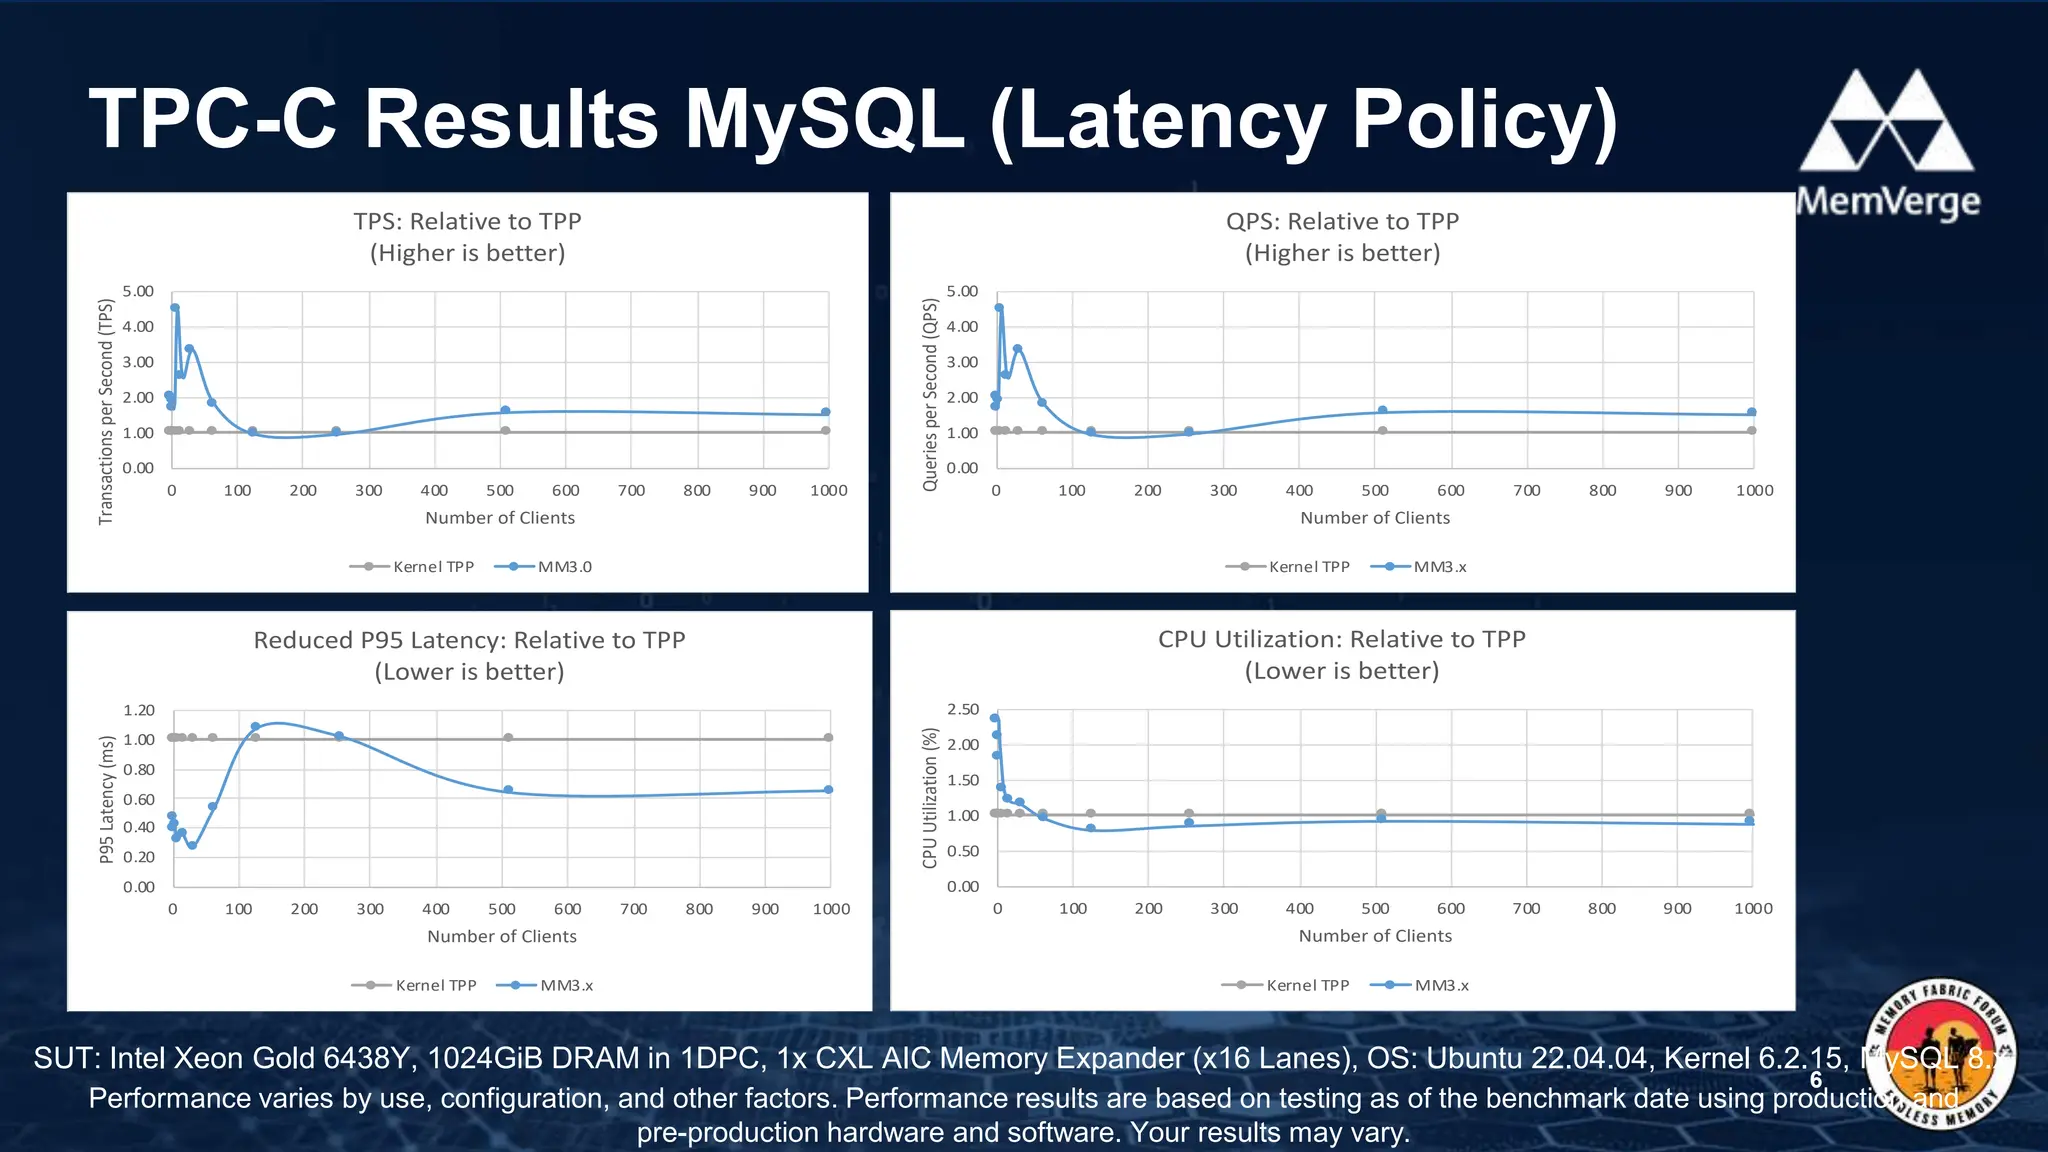
TPC-C Results MySQL (Latency Policy)
6
SUT: Intel Xeon Gold 6438Y, 1024GiB DRAM in 1DPC, 1x CXL AIC Memory Expander (x16 Lanes), OS: Ubuntu 22.04.04, Kernel 6.2.15, MySQL 8.x
Performance varies by use, configuration, and other factors. Performance results are based on testing as of the benchmark date using production and
pre-production hardware and software. Your results may vary.
0.00
1.00
2.00
3.00
4.00
5.00
0 100 200 300 400 500 600 700 800 900 1000
Transactions
per
Second
(TPS)
Number of Clients
TPS: Relative to TPP
(Higher is better)
Kernel TPP MM3.0
0.00
1.00
2.00
3.00
4.00
5.00
0 100 200 300 400 500 600 700 800 900 1000
Queries
per
Second
(QPS)
Number of Clients
QPS: Relative to TPP
(Higher is better)
Kernel TPP MM3.x
0.00
0.20
0.40
0.60
0.80
1.00
1.20
0 100 200 300 400 500 600 700 800 900 1000
P95
Latency
(ms)
Number of Clients
Reduced P95 Latency: Relative to TPP
(Lower is better)
Kernel TPP MM3.x
0.00
0.50
1.00
1.50
2.00
2.50
0 100 200 300 400 500 600 700 800 900 1000
CPU
Utilization
(%) Number of Clients
CPU Utilization: Relative to TPP
(Lower is better)
Kernel TPP MM3.x
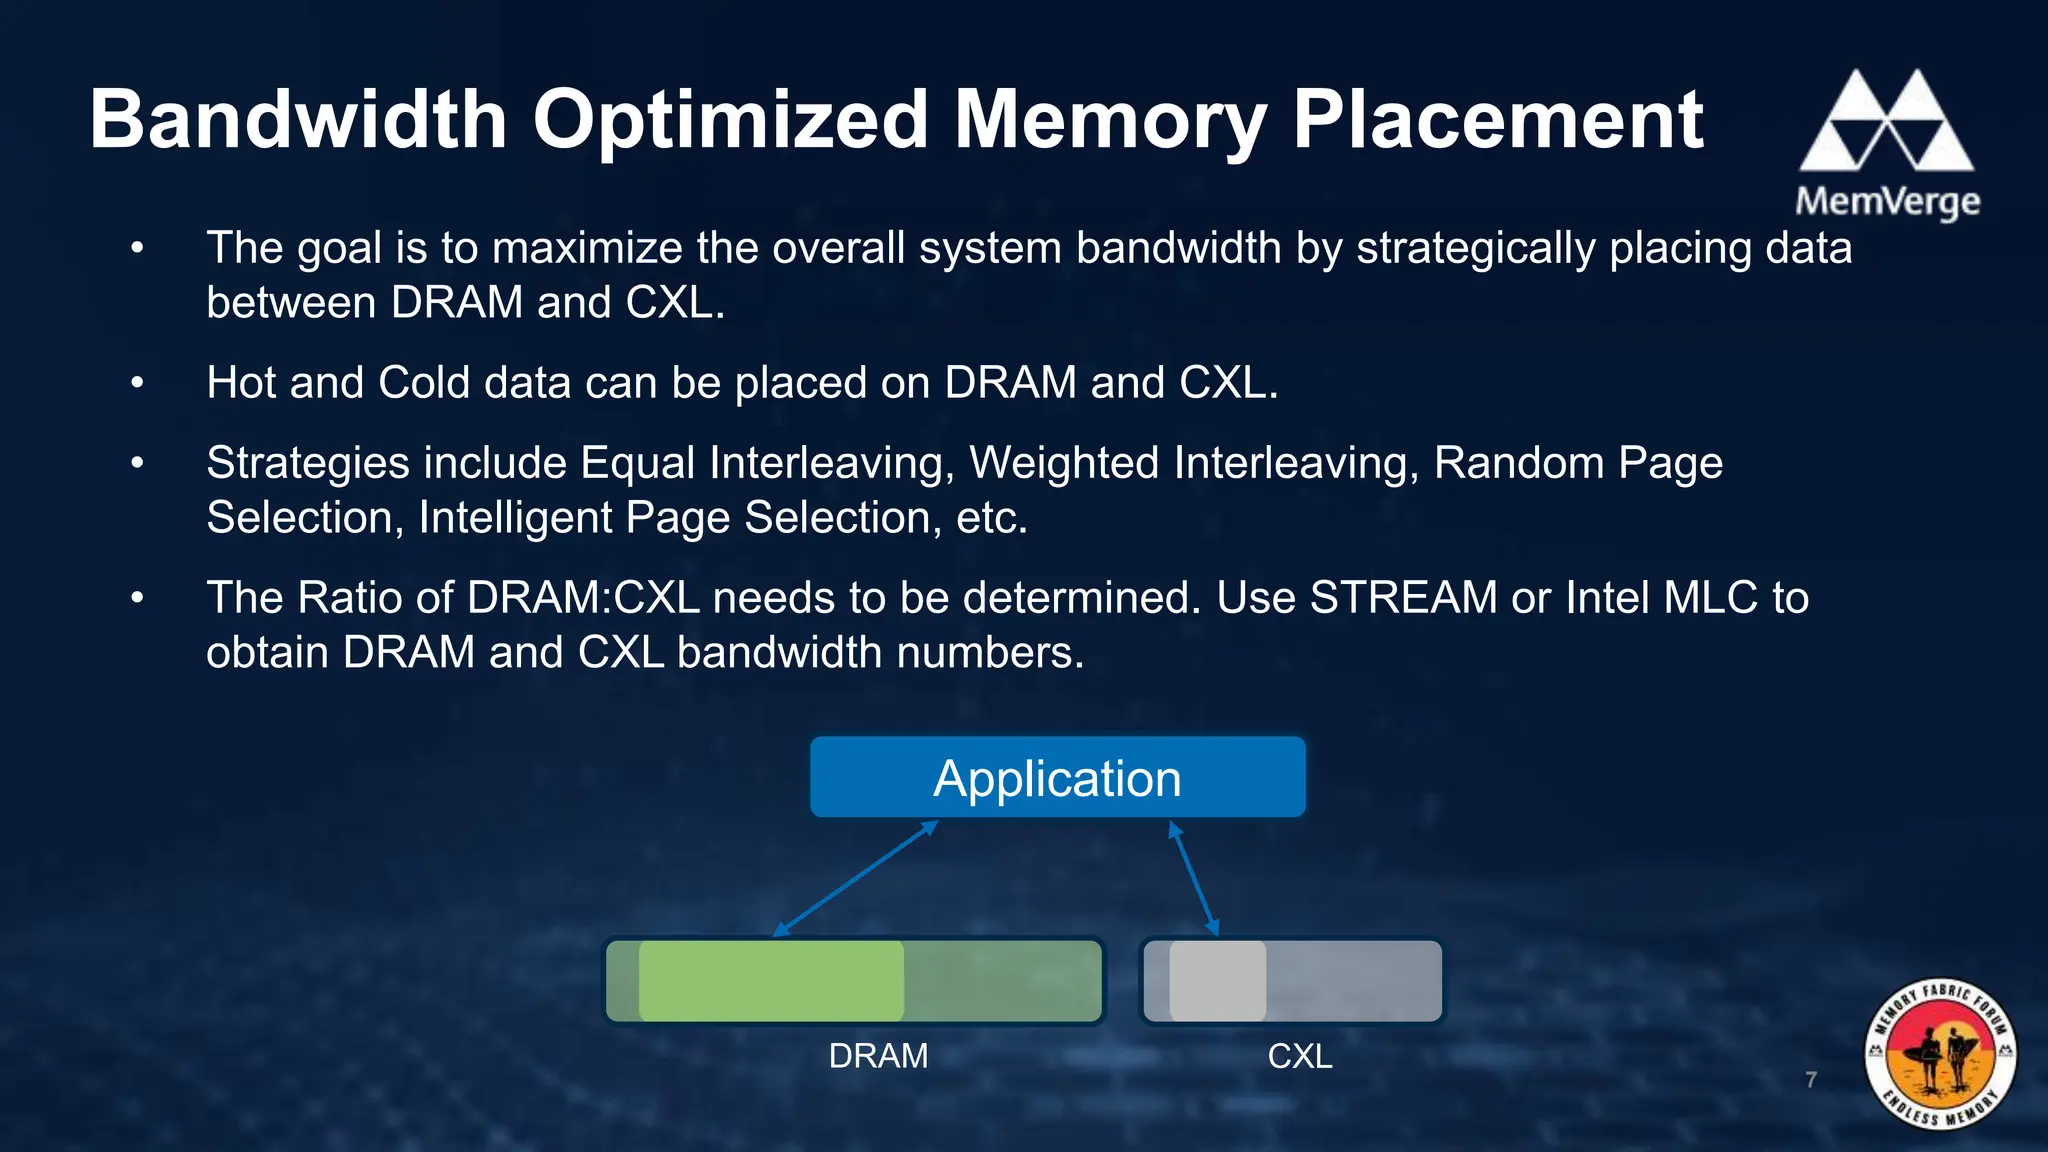
• The goal is to maximize the overall system bandwidth by strategically placing data
between DRAM and CXL.
• Hot and Cold data can be placed on DRAM and CXL.
• Strategies include Equal Interleaving, Weighted Interleaving, Random Page
Selection, Intelligent Page Selection, etc.
• The Ratio of DRAM:CXL needs to be determined. Use STREAM or Intel MLC to
obtain DRAM and CXL bandwidth numbers.
Bandwidth Optimized Memory Placement
7
Application
DRAM CXL
• The Ratio of DRAM:CXL needs to be determined. Use STREAM or Intel MLC to
obtain DRAM and CXL bandwidth numbers.
Example
• Per CPU Socket:
o DRAM: 8 x DDR5-4800 (1DPC) ~= 300 GB/s
o CXL: 1 x AIC (x16 lanes) ~= 60GB/s
o Bandwidth Ratio ~5:1 DRAM:CXL (20%)
Bandwidth Napkin Math
8
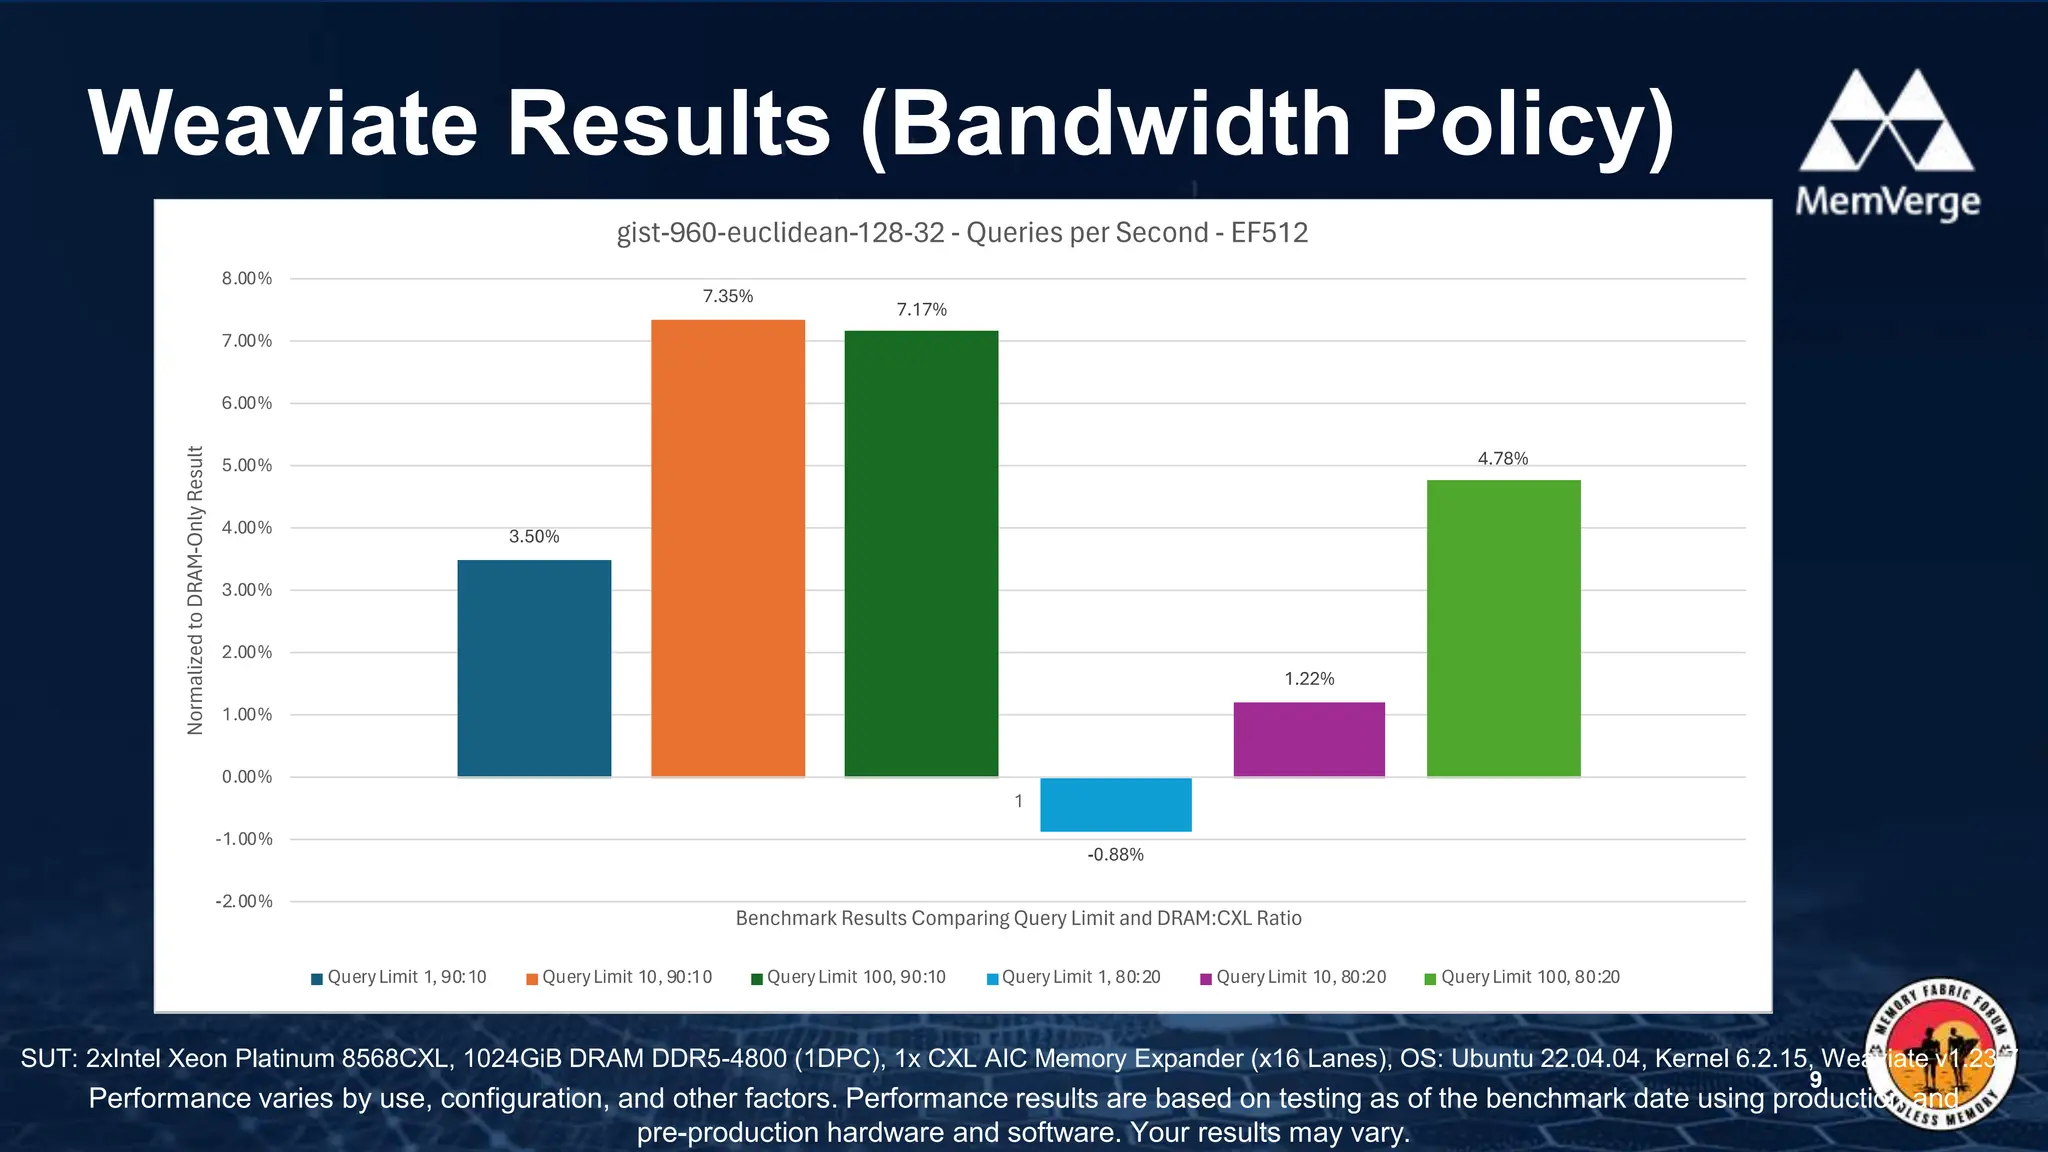
Weaviate Results (Bandwidth Policy)
9
Performance varies by use, configuration, and other factors. Performance results are based on testing as of the benchmark date using production and
pre-production hardware and software. Your results may vary.
SUT: 2xIntel Xeon Platinum 8568CXL, 1024GiB DRAM DDR5-4800 (1DPC), 1x CXL AIC Memory Expander (x16 Lanes), OS: Ubuntu 22.04.04, Kernel 6.2.15, Weaviate v1.23.7
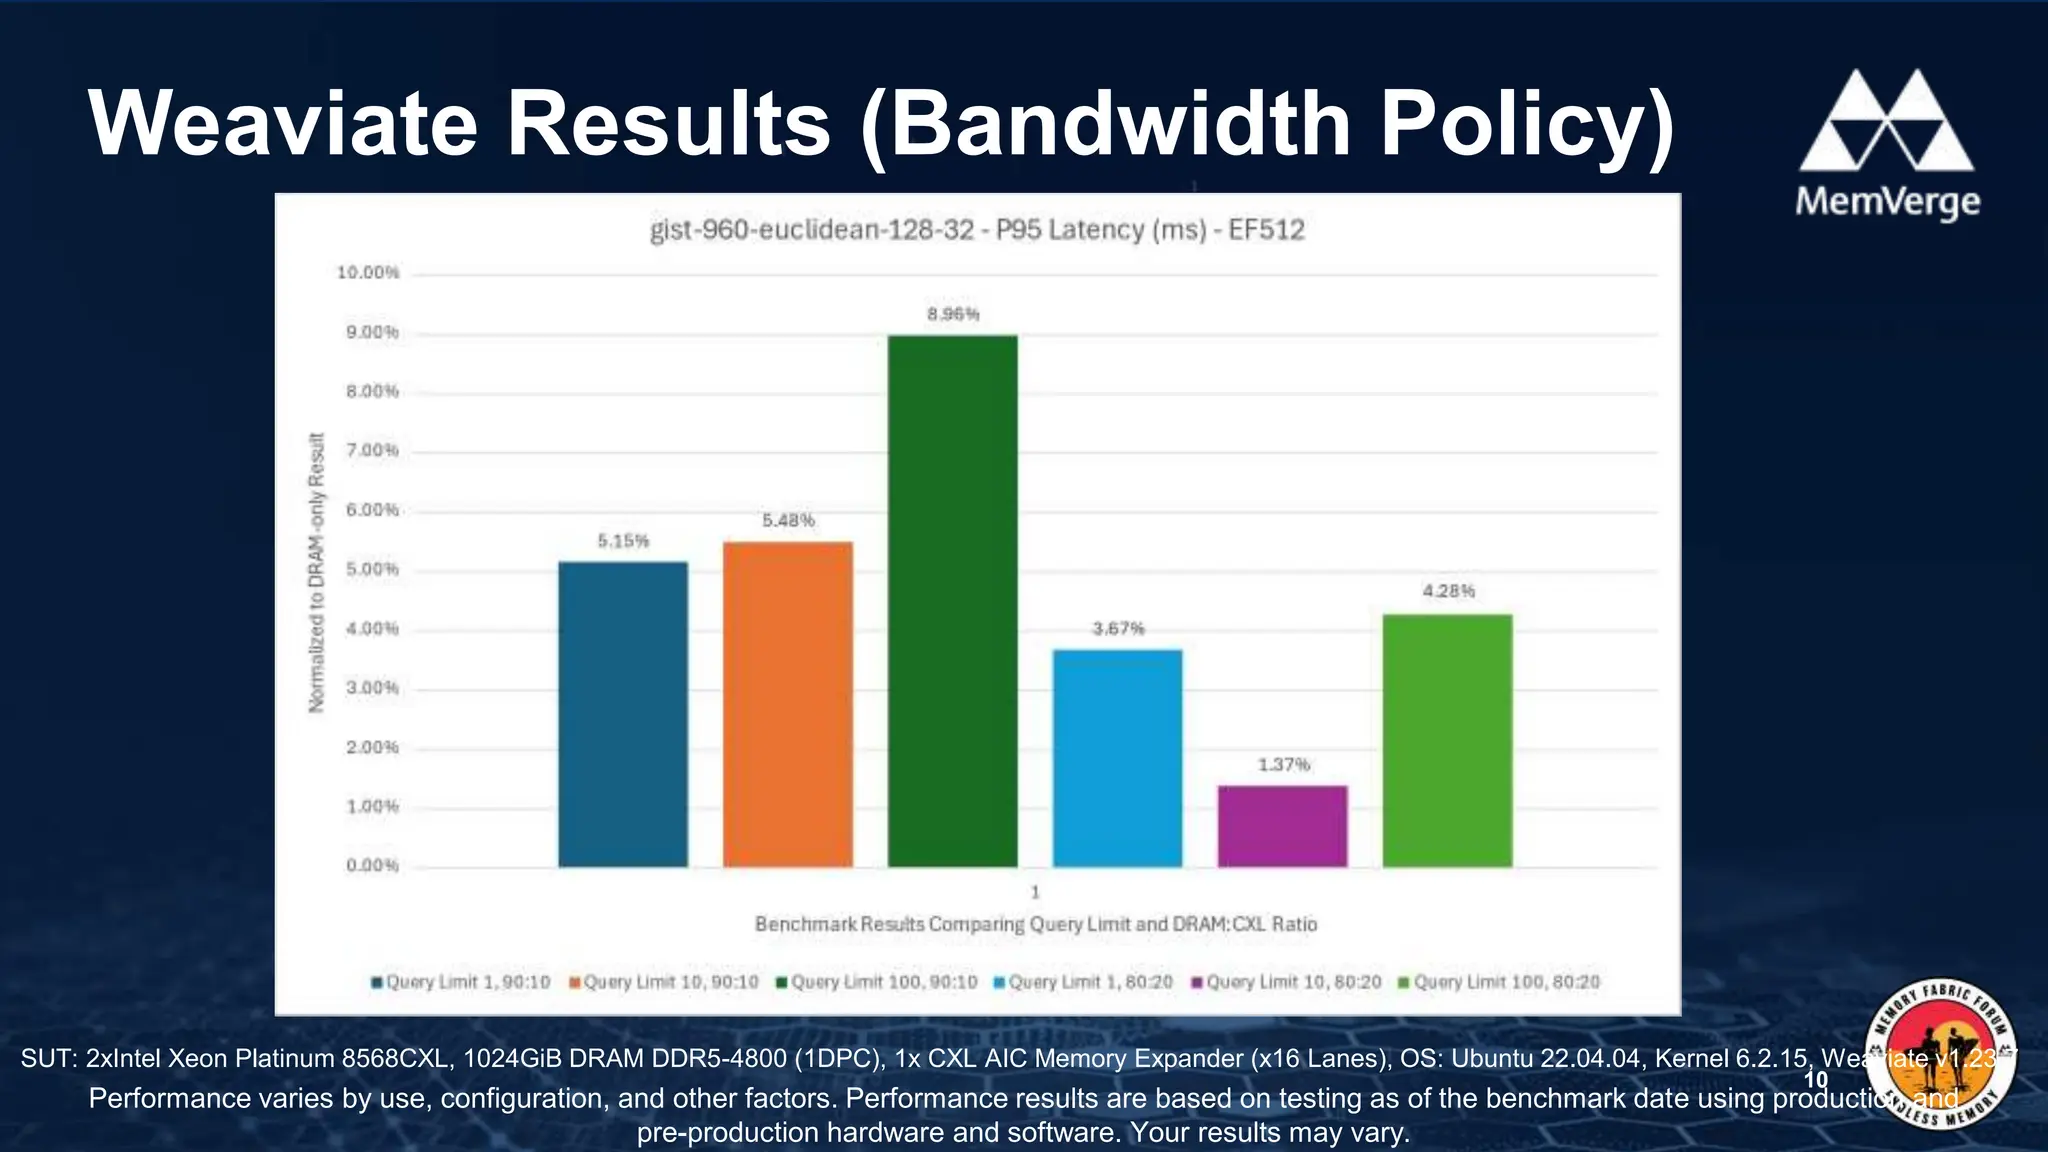
Weaviate Results (Bandwidth Policy)
10
SUT: 2xIntel Xeon Platinum 8568CXL, 1024GiB DRAM DDR5-4800 (1DPC), 1x CXL AIC Memory Expander (x16 Lanes), OS: Ubuntu 22.04.04, Kernel 6.2.15, Weaviate v1.23.7
Performance varies by use, configuration, and other factors. Performance results are based on testing as of the benchmark date using production and
pre-production hardware and software. Your results may vary.
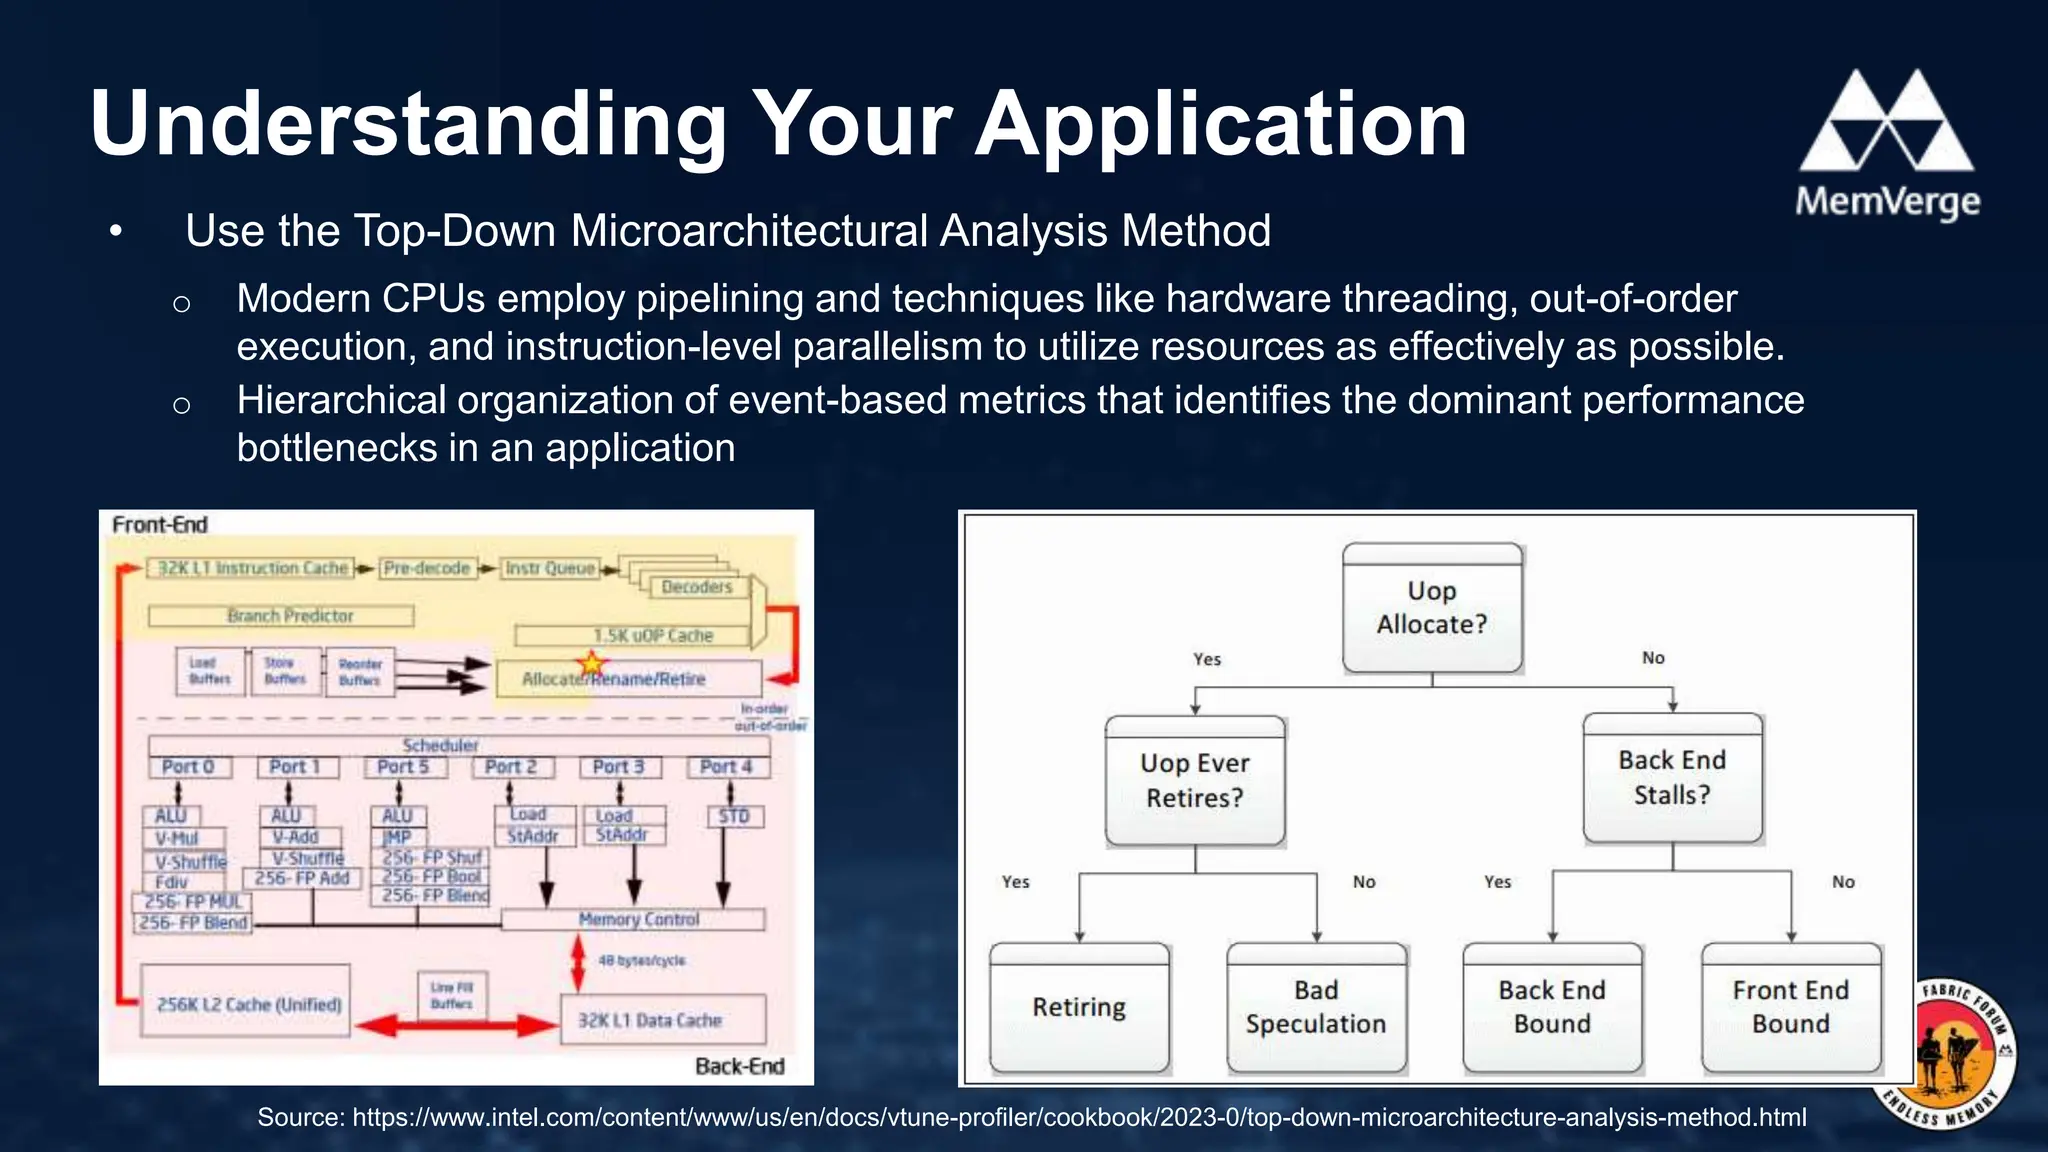
• Use the Top-Down Microarchitectural Analysis Method
o Modern CPUs employ pipelining and techniques like hardware threading, out-of-order
execution, and instruction-level parallelism to utilize resources as effectively as possible.
o Hierarchical organization of event-based metrics that identifies the dominant performance
bottlenecks in an application
Understanding Your Application
11
Source: https://www.intel.com/content/www/us/en/docs/vtune-profiler/cookbook/2023-0/top-down-microarchitecture-analysis-method.html
• Intel VTune Profiler and toplev are great tools to use
Understanding Your Application
12
$ toplev -l2 --nodes '!+Memory_Bound*/3,+Backend_Bound,+MUX' stream_c.exe --ntimes 1000 
--ntimes 1000 --array-size 40M –malloc
<.... Generated application output ... >
# 4.7-full on Intel(R) Xeon(R) Gold 6438Y+ [spr/sapphire_rapids]
BE Backend_Bound % Slots 88.6 [20.0%]
BE/Mem Backend_Bound.Memory_Bound % Slots 62.1 [20.0%]<==
This metric represents fraction of slots the Memory
subsystem within the Backend was a bottleneck...
warning: 5 nodes had zero counts: DRAM_Bound L1_Bound L2_Bound L3_Bound Store_
Bound
Run toplev --describe Memory_Bound^ to get more information on bottleneck
Add --run-sample to find locations
• Website: https://memoryfabricforum.com/
• YouTube: https://www.youtube.com/@MemoryFabricForum
• Slide Share: https://www.slideshare.net/cxladmin
• LinkedIn: https://www.linkedin.com/groups/14324322/
• Discord: https://discord.gg/crKjfp3xCf
Call to Action
13

Q1 Memory Fabric Forum: Using CXL with AI Applications - Steve Scargall.pptx

  • 1.
    Using CXL withAI Applications Memory Fabric Forum Steve Scargall, Senior Product Manager
  • 2.
    • CXL 1.1Memory Expansion Form Factors • Latency and Bandwidth Memory Placement Strategies • RDBMS Investigation and Results • Vector Database Investigation and Results • Understanding Your Application Behavior Agenda 2
  • 3.
    CXL Memory ExpansionForm Factors 3 E3.S Memory Modules PCIe Add-In Cards (AICs) DDR DIMMs Add-in Card (AIC) • Flexible capacity, up to 2 TB per card • Higher bandwidth, up to x16 PCIe5 lanes (~ 1x DDR5 channel) E3.S Module • Easy front loading, same as SSDs • Fixed capacity – 128, 256, & 512 GB • Lower bandwidth at x8 PCIe5 lanes
  • 4.
    1. Configure CXLas ‘Special Purpose’ in the BIOS 2. The Linux Kernel creates a DEVDAX (/dev/daxX.Y) 3. Convert to a System-RAM namespace: $ sudo daxctl reconfigure-device --mode=system-ram daxX.Y 4. CXL Memory appears as a new memory-only NUMA Node Using CXL Type 3 Memory with Apps 4 # numactl -H available: 3 nodes (0-2) node 0 cpus: 0 1 2 3 4 5 6 7 8 9 10 11 … node 0 size: 515714 MB node 0 free: 2321 MB node 1 cpus: 48 49 50 51 52 53 54 55 56 … node 1 size: 516064 MB node 1 free: 499038 MB node 2 cpus: node 2 size: 129023 MB  CXL Memory node 2 free: 203 MB node distances: node 0 1 2 0: 10 21 14 1: 21 10 24 2: 14 24 10
  • 5.
    • Latency tieringintelligently manages data placement and movement across heterogeneous memory devices to optimize performance based on the "temperature" of memory pages – Hot or Cold(er) and device characteristics. Latency Optimized Memory Placement 5 Application Hot Cold DRAM CXL
  • 6.
    TPC-C Results MySQL(Latency Policy) 6 SUT: Intel Xeon Gold 6438Y, 1024GiB DRAM in 1DPC, 1x CXL AIC Memory Expander (x16 Lanes), OS: Ubuntu 22.04.04, Kernel 6.2.15, MySQL 8.x Performance varies by use, configuration, and other factors. Performance results are based on testing as of the benchmark date using production and pre-production hardware and software. Your results may vary. 0.00 1.00 2.00 3.00 4.00 5.00 0 100 200 300 400 500 600 700 800 900 1000 Transactions per Second (TPS) Number of Clients TPS: Relative to TPP (Higher is better) Kernel TPP MM3.0 0.00 1.00 2.00 3.00 4.00 5.00 0 100 200 300 400 500 600 700 800 900 1000 Queries per Second (QPS) Number of Clients QPS: Relative to TPP (Higher is better) Kernel TPP MM3.x 0.00 0.20 0.40 0.60 0.80 1.00 1.20 0 100 200 300 400 500 600 700 800 900 1000 P95 Latency (ms) Number of Clients Reduced P95 Latency: Relative to TPP (Lower is better) Kernel TPP MM3.x 0.00 0.50 1.00 1.50 2.00 2.50 0 100 200 300 400 500 600 700 800 900 1000 CPU Utilization (%) Number of Clients CPU Utilization: Relative to TPP (Lower is better) Kernel TPP MM3.x
  • 7.
    • The goalis to maximize the overall system bandwidth by strategically placing data between DRAM and CXL. • Hot and Cold data can be placed on DRAM and CXL. • Strategies include Equal Interleaving, Weighted Interleaving, Random Page Selection, Intelligent Page Selection, etc. • The Ratio of DRAM:CXL needs to be determined. Use STREAM or Intel MLC to obtain DRAM and CXL bandwidth numbers. Bandwidth Optimized Memory Placement 7 Application DRAM CXL
  • 8.
    • The Ratioof DRAM:CXL needs to be determined. Use STREAM or Intel MLC to obtain DRAM and CXL bandwidth numbers. Example • Per CPU Socket: o DRAM: 8 x DDR5-4800 (1DPC) ~= 300 GB/s o CXL: 1 x AIC (x16 lanes) ~= 60GB/s o Bandwidth Ratio ~5:1 DRAM:CXL (20%) Bandwidth Napkin Math 8
  • 9.
    Weaviate Results (BandwidthPolicy) 9 Performance varies by use, configuration, and other factors. Performance results are based on testing as of the benchmark date using production and pre-production hardware and software. Your results may vary. SUT: 2xIntel Xeon Platinum 8568CXL, 1024GiB DRAM DDR5-4800 (1DPC), 1x CXL AIC Memory Expander (x16 Lanes), OS: Ubuntu 22.04.04, Kernel 6.2.15, Weaviate v1.23.7
  • 10.
    Weaviate Results (BandwidthPolicy) 10 SUT: 2xIntel Xeon Platinum 8568CXL, 1024GiB DRAM DDR5-4800 (1DPC), 1x CXL AIC Memory Expander (x16 Lanes), OS: Ubuntu 22.04.04, Kernel 6.2.15, Weaviate v1.23.7 Performance varies by use, configuration, and other factors. Performance results are based on testing as of the benchmark date using production and pre-production hardware and software. Your results may vary.
  • 11.
    • Use theTop-Down Microarchitectural Analysis Method o Modern CPUs employ pipelining and techniques like hardware threading, out-of-order execution, and instruction-level parallelism to utilize resources as effectively as possible. o Hierarchical organization of event-based metrics that identifies the dominant performance bottlenecks in an application Understanding Your Application 11 Source: https://www.intel.com/content/www/us/en/docs/vtune-profiler/cookbook/2023-0/top-down-microarchitecture-analysis-method.html
  • 12.
    • Intel VTuneProfiler and toplev are great tools to use Understanding Your Application 12 $ toplev -l2 --nodes '!+Memory_Bound*/3,+Backend_Bound,+MUX' stream_c.exe --ntimes 1000 --ntimes 1000 --array-size 40M –malloc <.... Generated application output ... > # 4.7-full on Intel(R) Xeon(R) Gold 6438Y+ [spr/sapphire_rapids] BE Backend_Bound % Slots 88.6 [20.0%] BE/Mem Backend_Bound.Memory_Bound % Slots 62.1 [20.0%]<== This metric represents fraction of slots the Memory subsystem within the Backend was a bottleneck... warning: 5 nodes had zero counts: DRAM_Bound L1_Bound L2_Bound L3_Bound Store_ Bound Run toplev --describe Memory_Bound^ to get more information on bottleneck Add --run-sample to find locations
  • 13.
    • Website: https://memoryfabricforum.com/ •YouTube: https://www.youtube.com/@MemoryFabricForum • Slide Share: https://www.slideshare.net/cxladmin • LinkedIn: https://www.linkedin.com/groups/14324322/ • Discord: https://discord.gg/crKjfp3xCf Call to Action 13