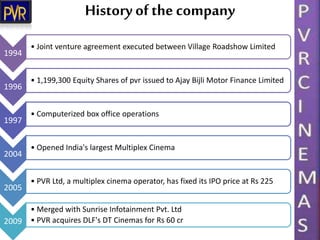
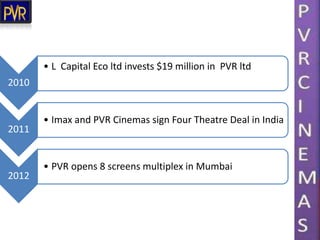
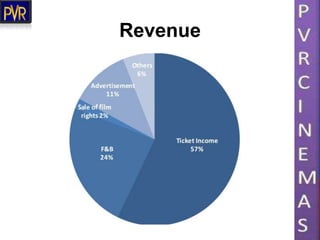
Experience the difference”
Group Members
Arpit Jain - 80
Zil Shah - 81
Khyati Patel - 82
Nikita Bhasin - 83
Deeviash Sharma - 84
Kalpesh Kerai - 85
Tableof Content
Vision of the company
Introduction
History of the company
Segmentation & Revenue
Competitive Analysis
Acquisitions and mergers
Financial Status
Ratio analysis
Conclusion
Vision of the Company
• The Company's long-term vision is to excel in
the retail entertainment domain to maintain
its leadership position in the cinema
exhibition business
Introduction
• Most premium film entertainment Company in India.
• Listed as the “Most Trusted Brand” in the Category of
Entertainment by the “Brand Trust Report, 2013”.
• Incorporated on April 26, 1995 under the Companies Act as
"Priya Village Roadshow Limited“.
• Certificate of commencement of business on December 4,
1995.
• On June 28, 2002 "Priya Village Roadshow Limited“ changed
to "PVR Limited" consequent to the exit of Village Roadshow
Limited from PVR.
History ofthe company
1994
• Joint venture agreement executed between Village Roadshow Limited
1996
• 1,199,300 Equity Shares of pvr issued to Ajay Bijli Motor Finance Limited
1997
• Computerized box office operations
2004
• Opened India's largest Multiplex Cinema
2005
• PVR Ltd, a multiplex cinema operator, has fixed its IPO price at Rs 225
2009
• Merged with Sunrise Infotainment Pvt. Ltd
• PVR acquires DLF's DT Cinemas for Rs 60 cr
2010
• L Capital Eco ltd invests $19 million in PVR ltd
2011
• Imax and PVR Cinemas sign Four Theatre Deal in India
2012
• PVR opens 8 screens multiplex in Mumbai
Segmentation
Revenue
Competitive Analysis
28%
20%
16%
5%
5%
3%
23%
Market share (%)
PVR
Inox
Big Cinemas
Cinepolis
Fun Cinemas
SRS cinemas
Others
Mergers , Acquisitions &
Expansion
• L Capital Eco ltd invests $19 million in PVR
ltd
• Acquisition of Cinemax – a master stroke
• Only player with aggressive Expansion plans
Financial Status
309
401
482
678
1285
0
200
400
600
800
1000
1200
1400
2010 2011 2012 2013 2014
TOTAL REVENUE
305
391
468
670
1271
0
200
400
600
800
1000
1200
1400
2010 2011 2012 2013 2014
INCOME FROM SALES
4
10
14
8
14
0
2
4
6
8
10
12
14
16
2010 2011 2012 2013 2014
OTHER INCOME
0.26
17
28
55
58
0
10
20
30
40
50
60
70
2010 2011 2012 2013 2014
PAT
276
339
398
565
1071
0
200
400
600
800
1000
1200
2010 2011 2012 2013 2014
EXPENDITURE
384
449 442
975
894
0
200
400
600
800
1000
1200
2010 2011 2012 2013 2014
TOTAL ASSETS
Ratio Analysis
• CURRENT RATIO = CURRENT ASSETS
• CURRENT LIABILITIES
1.4
2.4
1.59
1.31
0.99
0
0.5
1
1.5
2
2.5
3
2010 2011 2012 2013 2014
CURRENT RATIO
DEBT – EQUITY RATIO = DEBT (BORROWED FUNDS)
EQUITY (OWNERS FUNDS)
0.55
0.56 0.62
0.52
1.28
0
0.2
0.4
0.6
0.8
1
1.2
1.4
2010 2011 2012 2013 2014
DEBT-EQUITY RATIO
DEBTORS VELOCITY RATIO = ___365 DAYS__
DEBTORS TURNOVER RATIO
DEBTORS TUNROVER RATIO = ___CREDIT SALES___
AVG. DEBTORS + AVG. BILLS RECEIVABLES
25
29
25
30
37
0
5
10
15
20
25
30
35
40
2010 2011 2012 2013 2014
DEBTORS VELOCITY RATIO (DAYS)
TOTAL ASSETS TURNOVER RATIO = SALES
TOTAL ASSETS
TOTAL ASSETS = FIXED ASSETS + LONG TERM INVESTMENTS + CURRENT ASSETS
0.8
0.88
1.11
0.69
1.69
0
0.2
0.4
0.6
0.8
1
1.2
1.4
1.6
1.8
2010 2011 2012 2013 2014
TOTAL ASSETS TURNOVER RATIO
EARNING PER SHARE = NPAT – PREFERENCE DIVIDEND
NUMBER OF EQUITY SHARES
0.1
6.02
10.85
13.85
14.08
0
2
4
6
8
10
12
14
16
2010 2011 2012 2013 2014
EARNING PER SHARE (RS)
THANKYOU

PVR Ltd.