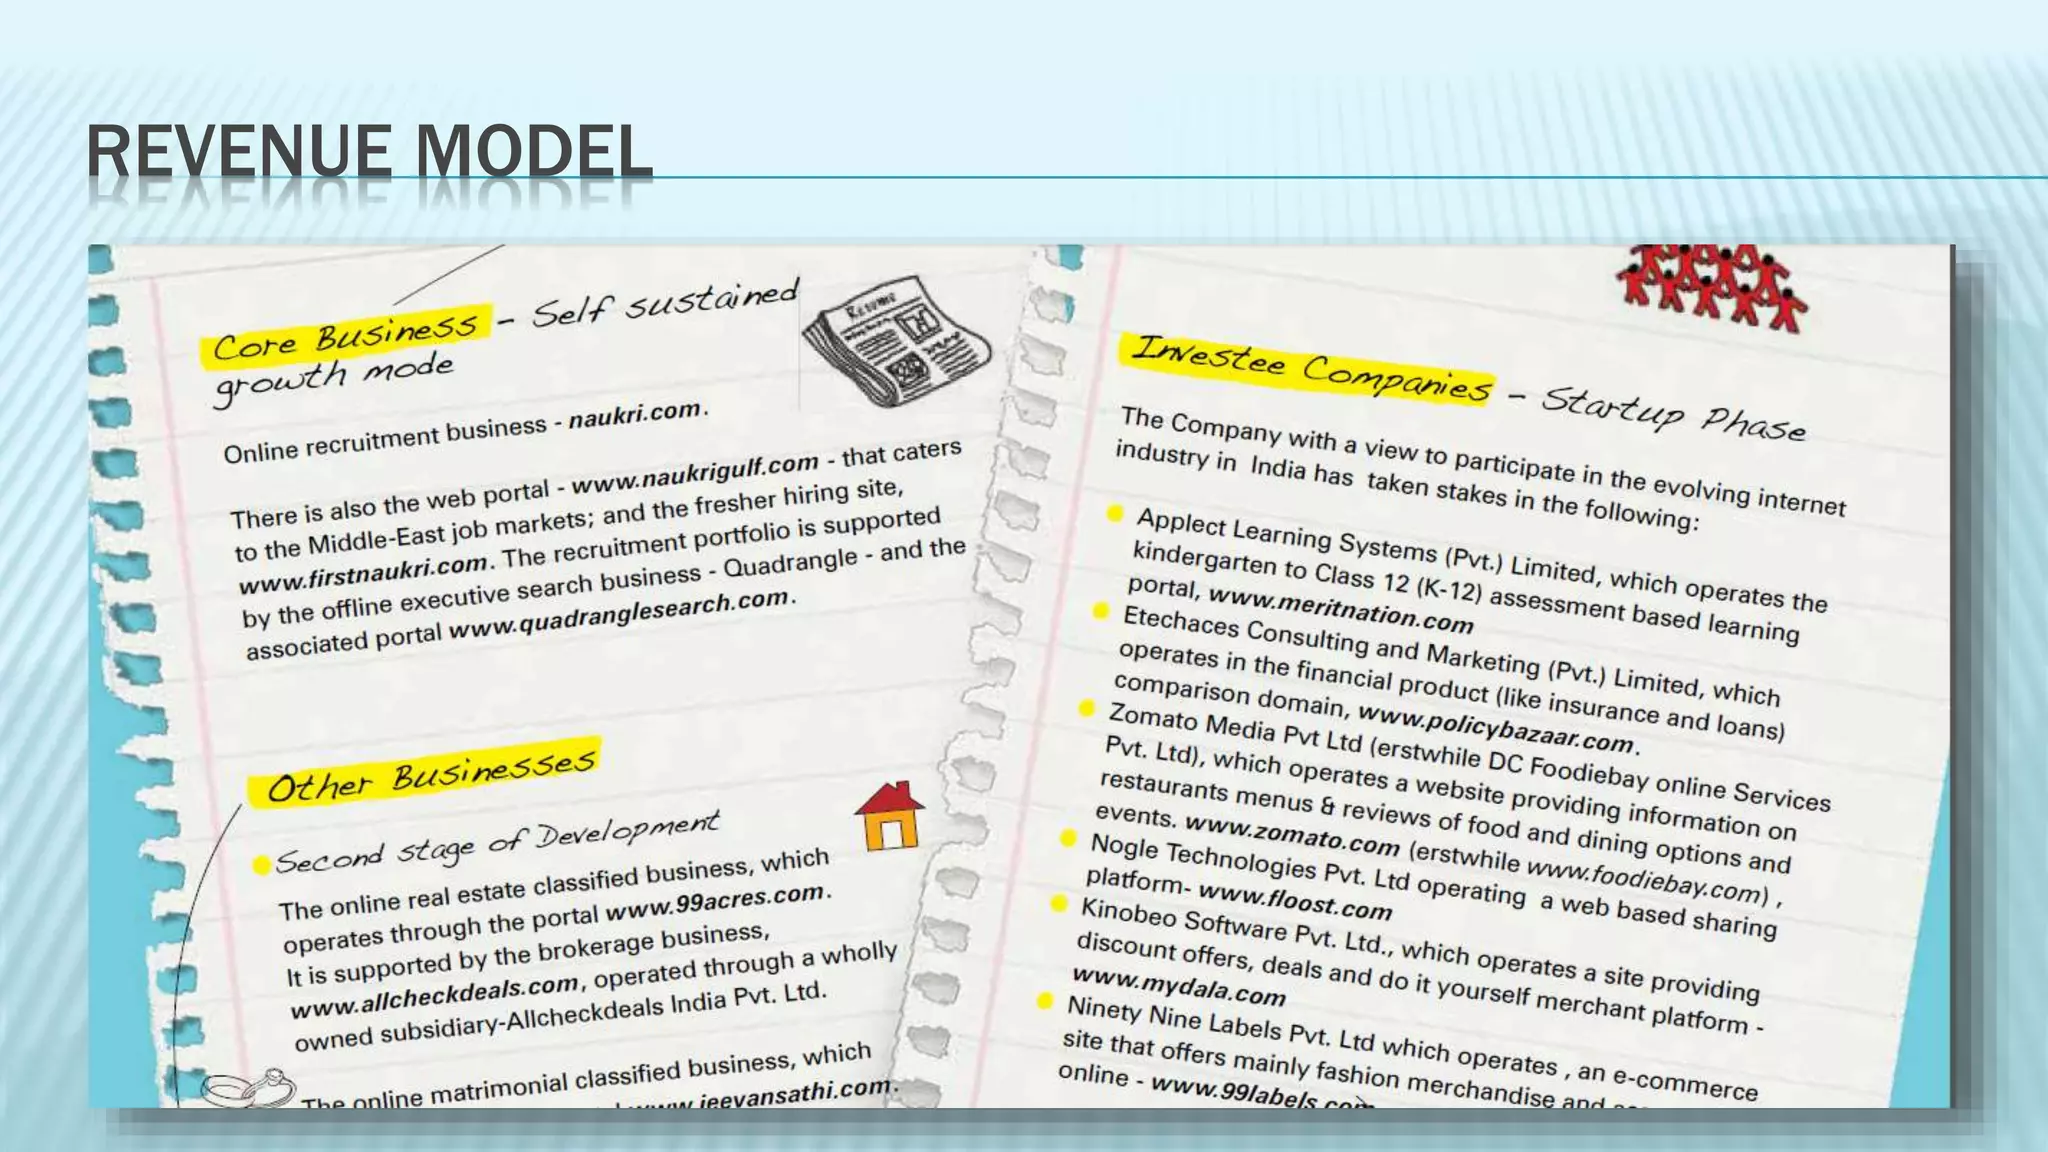
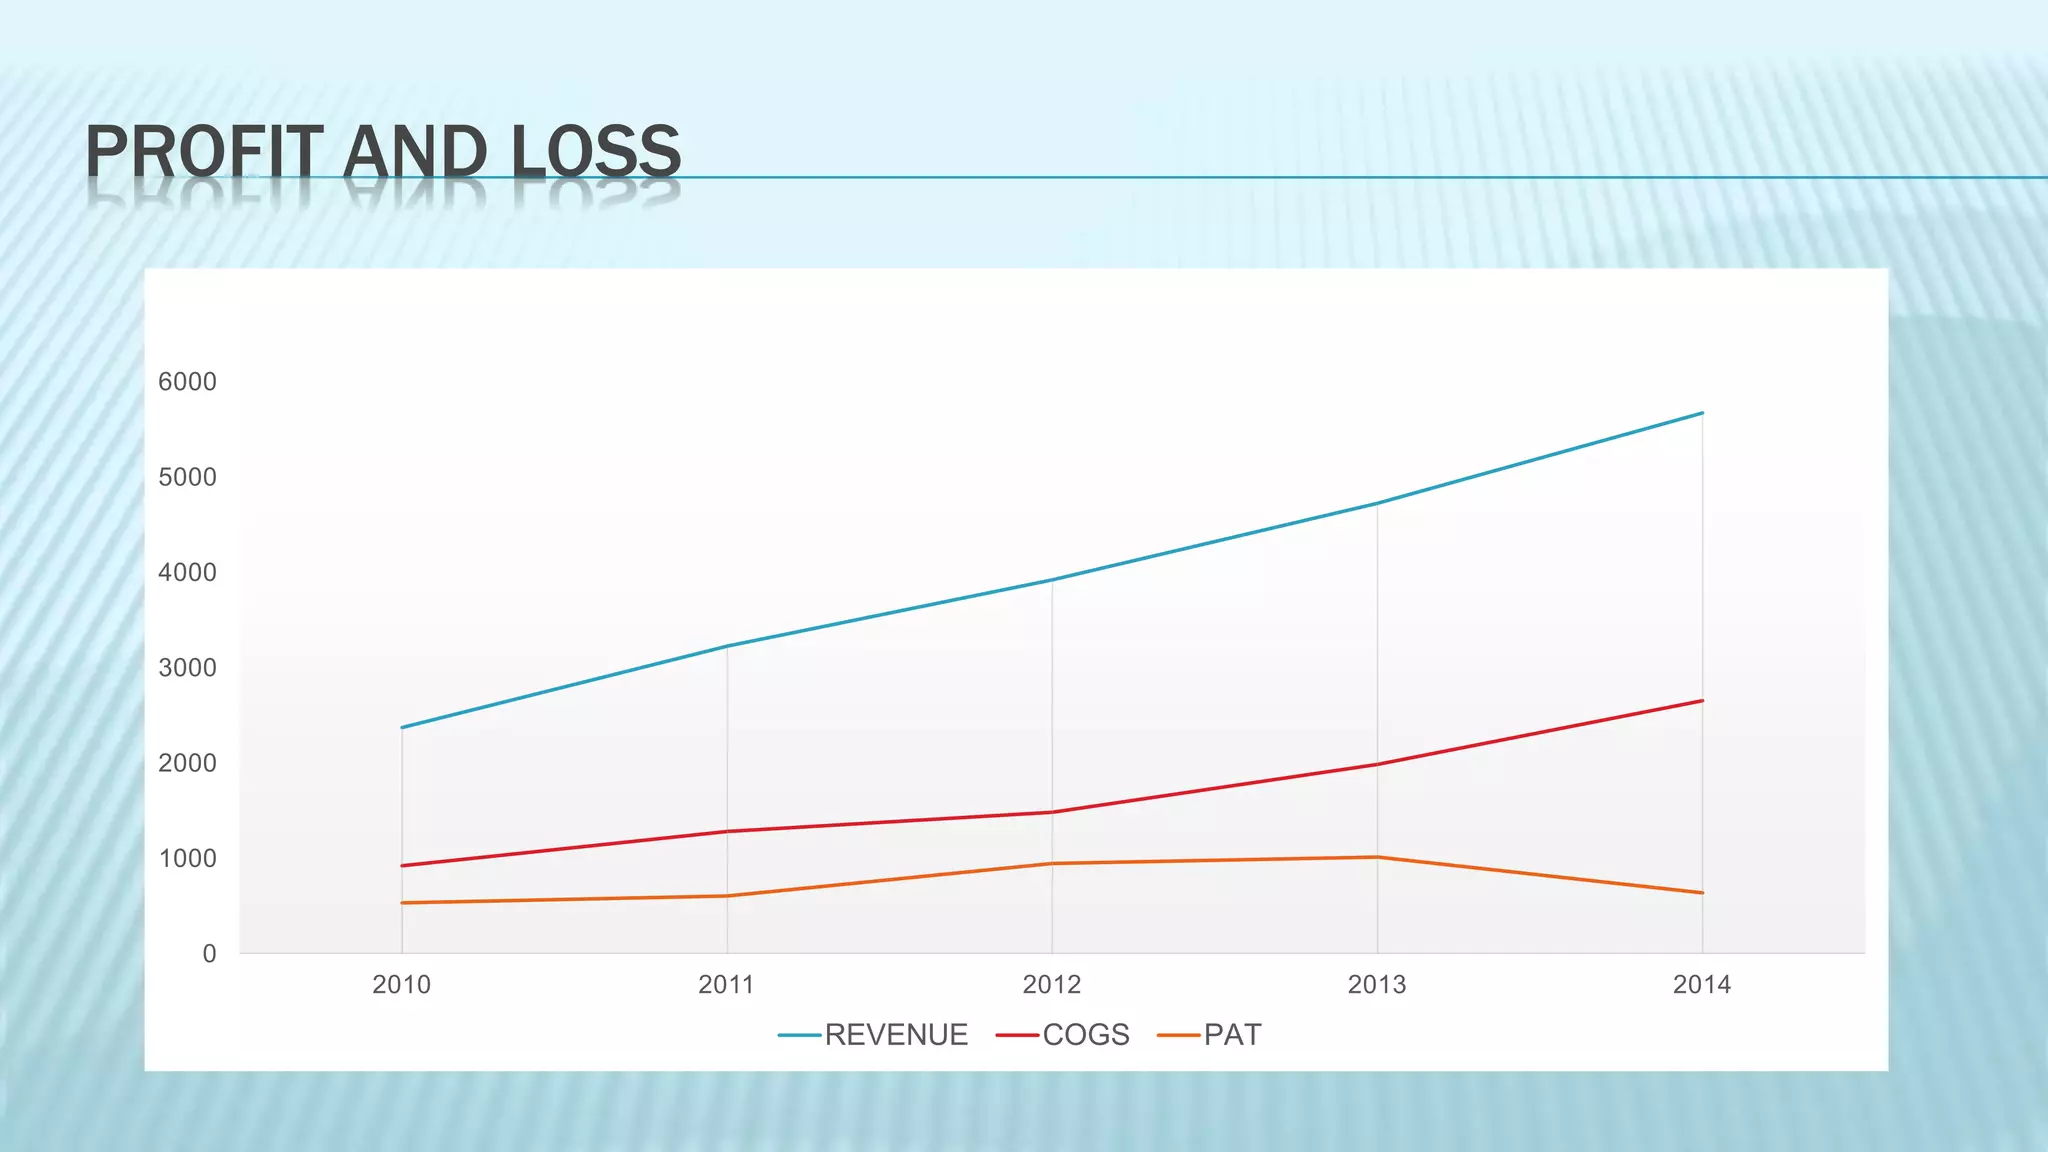
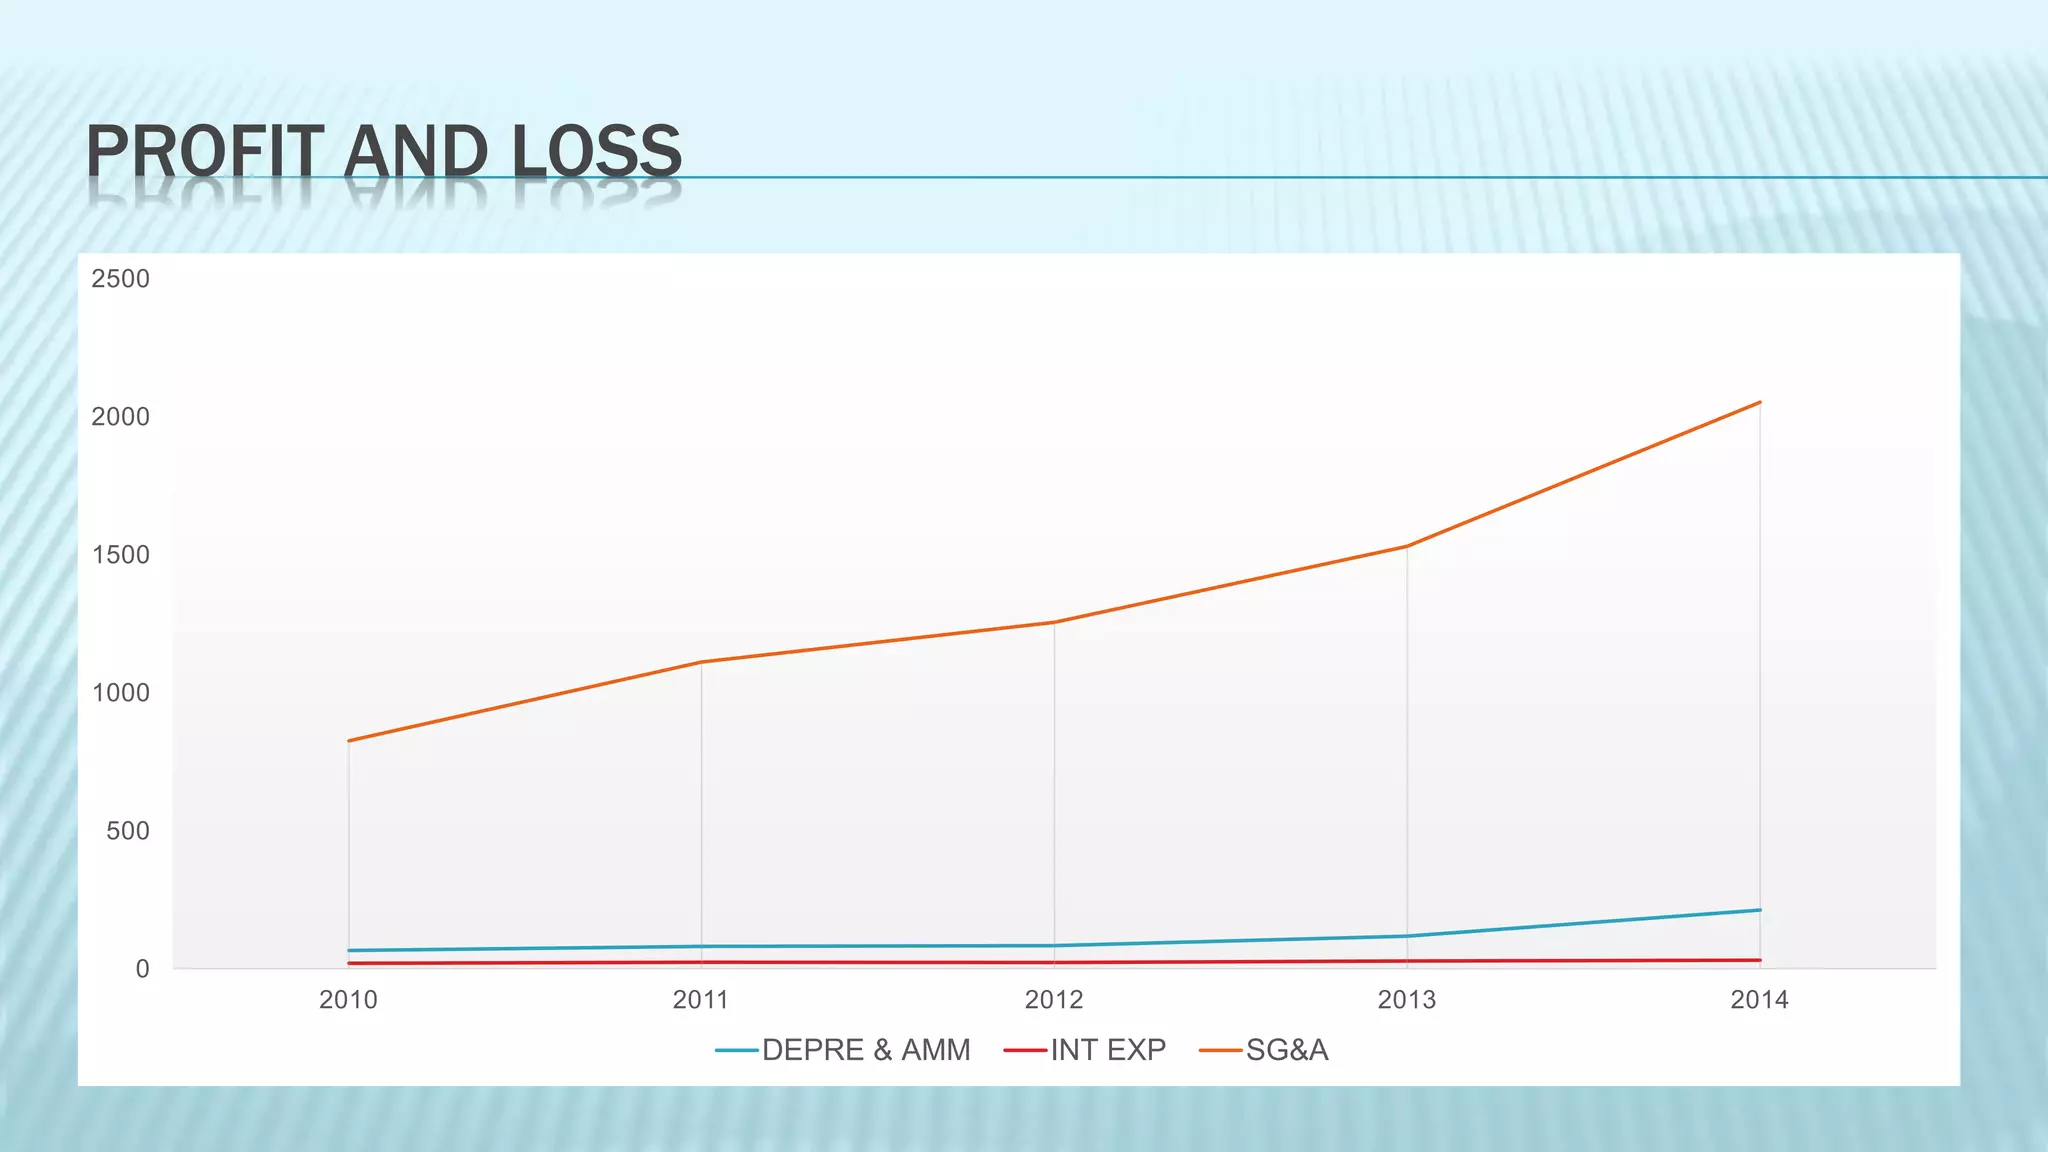
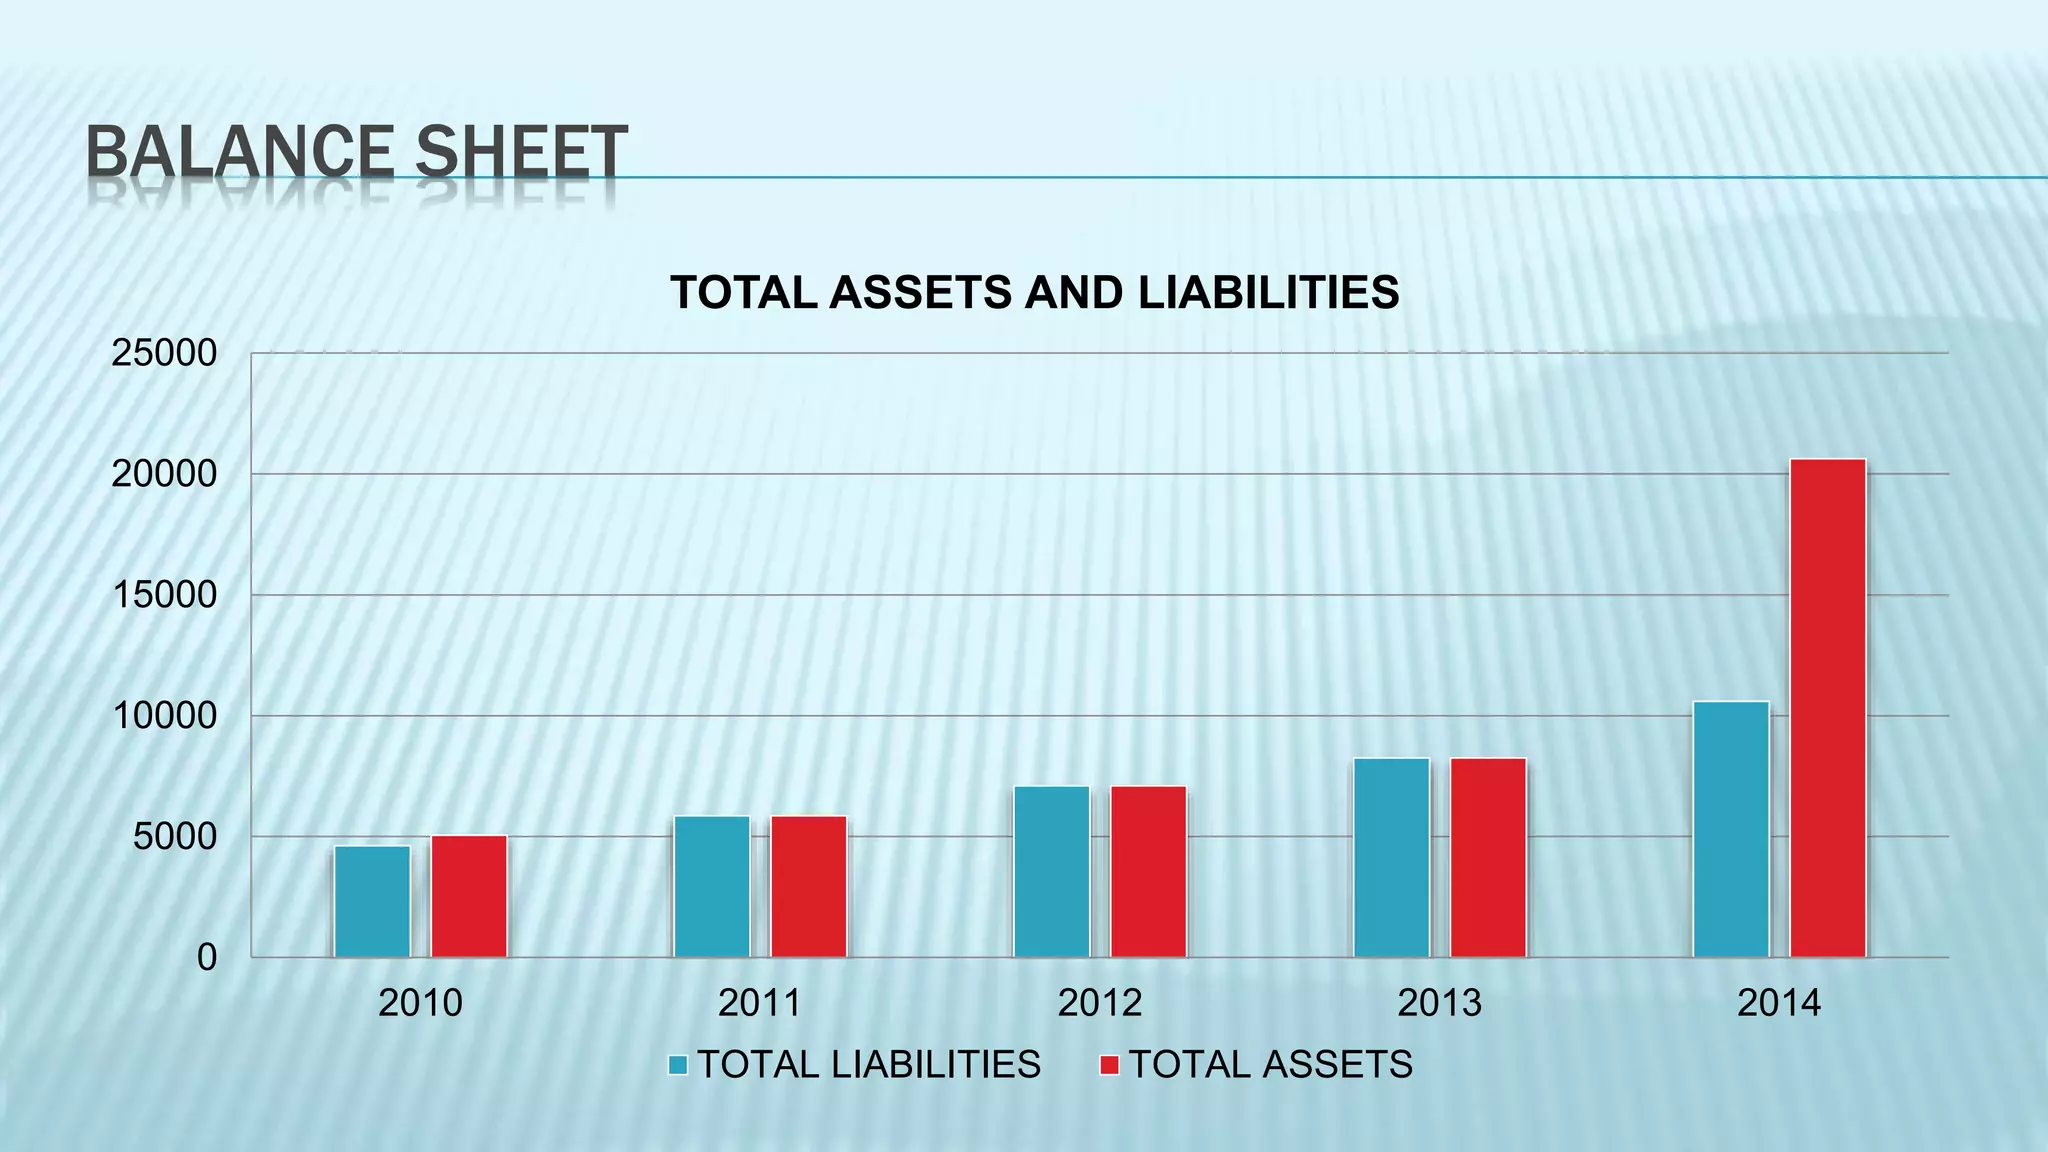
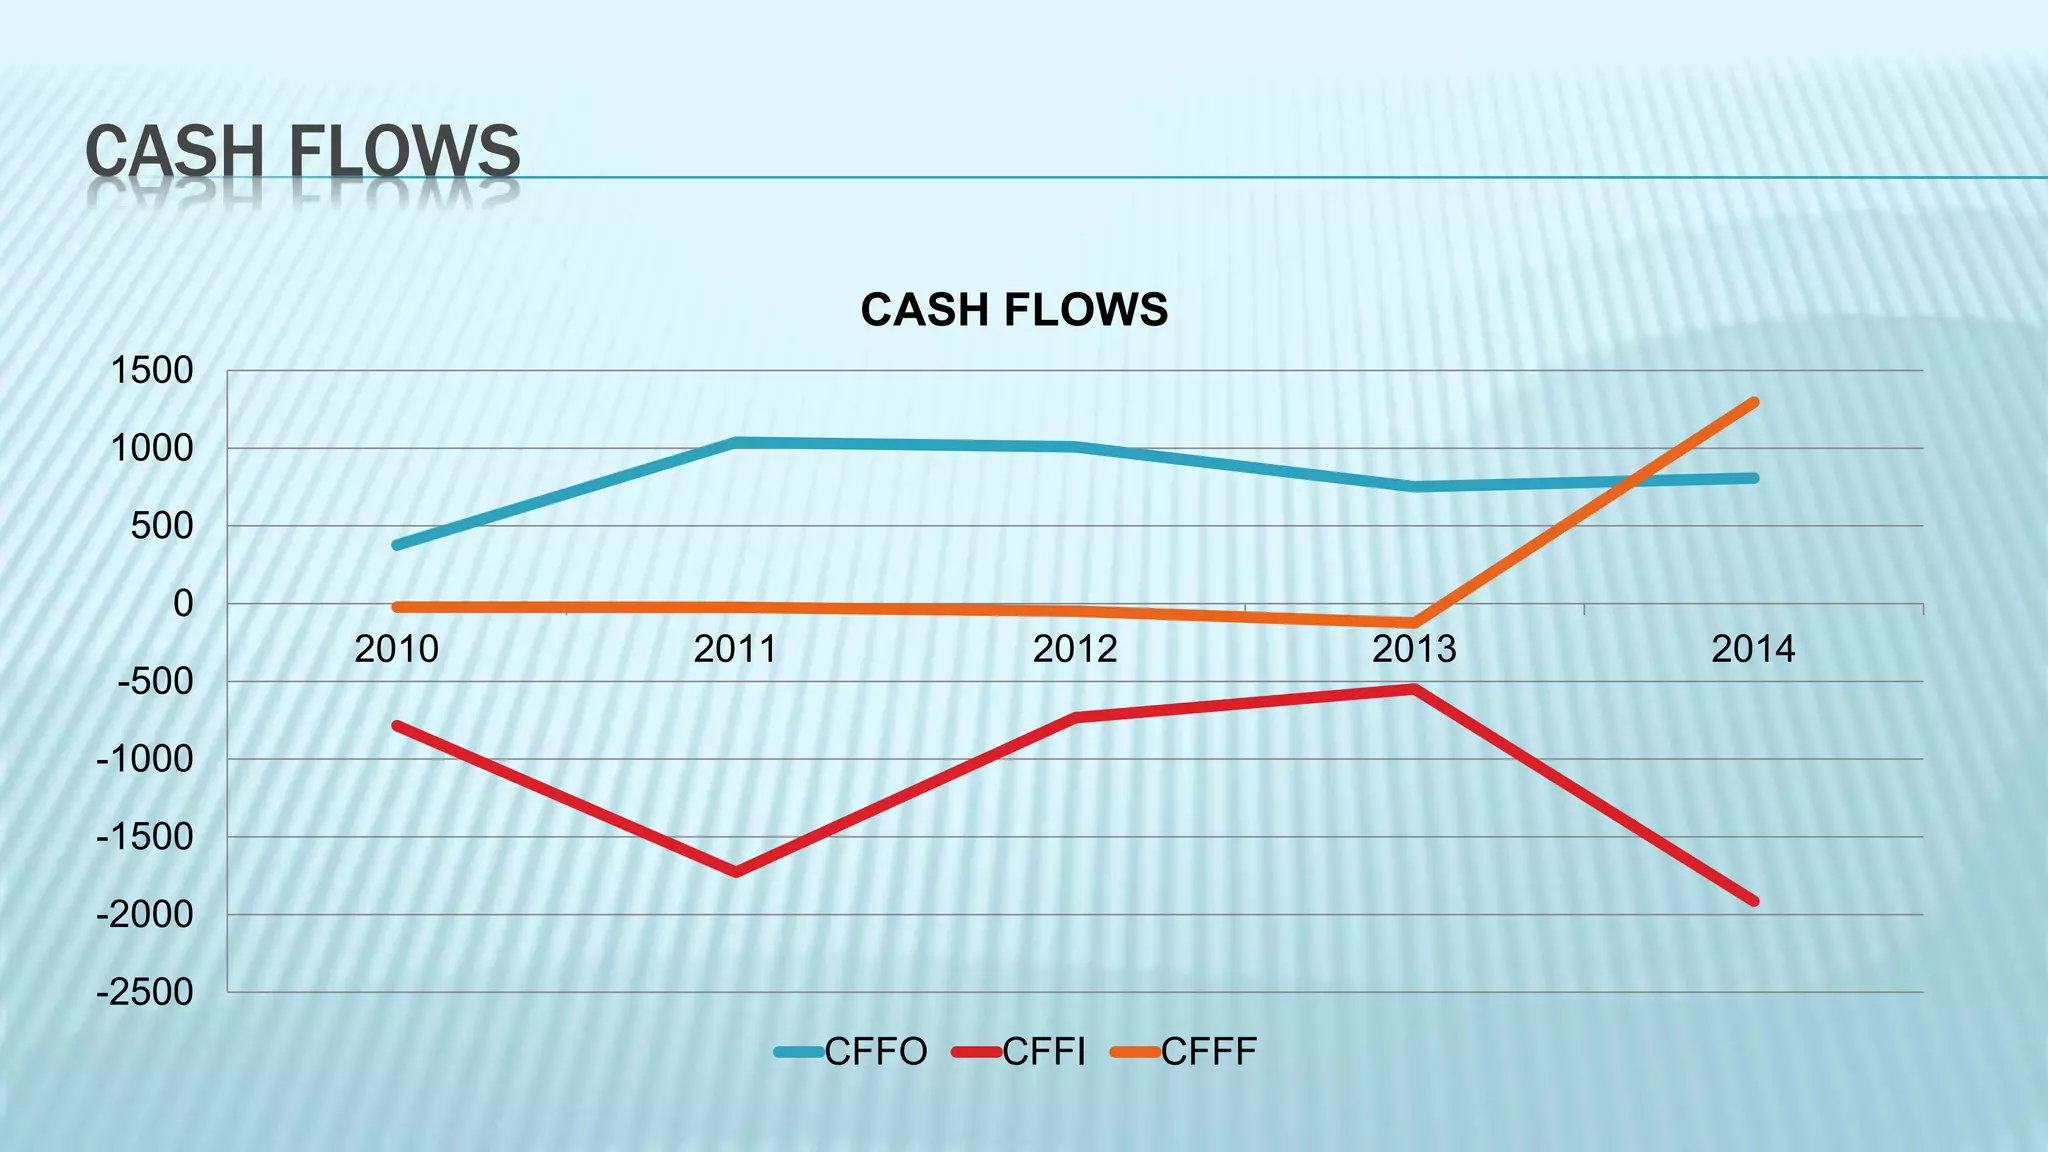
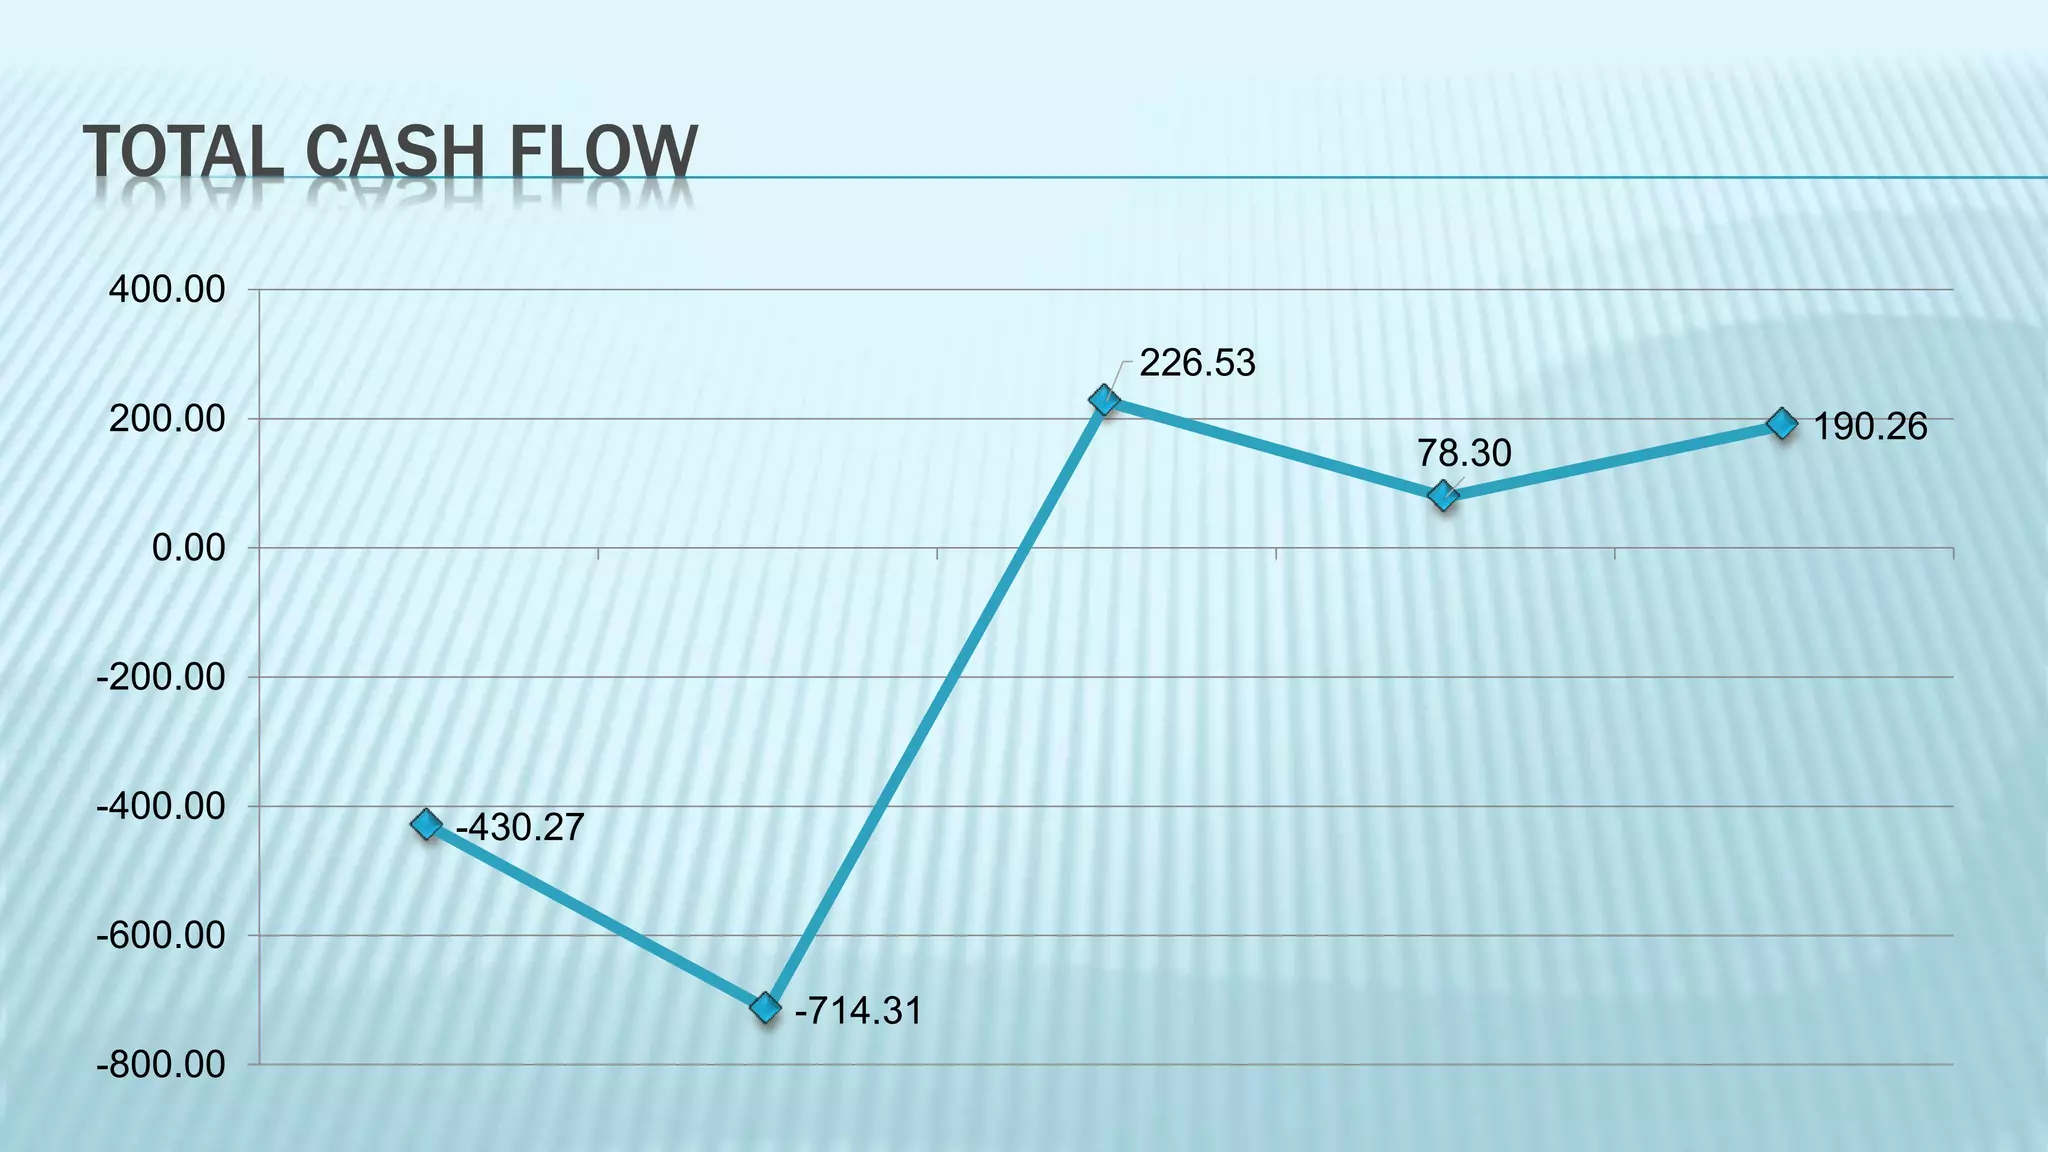
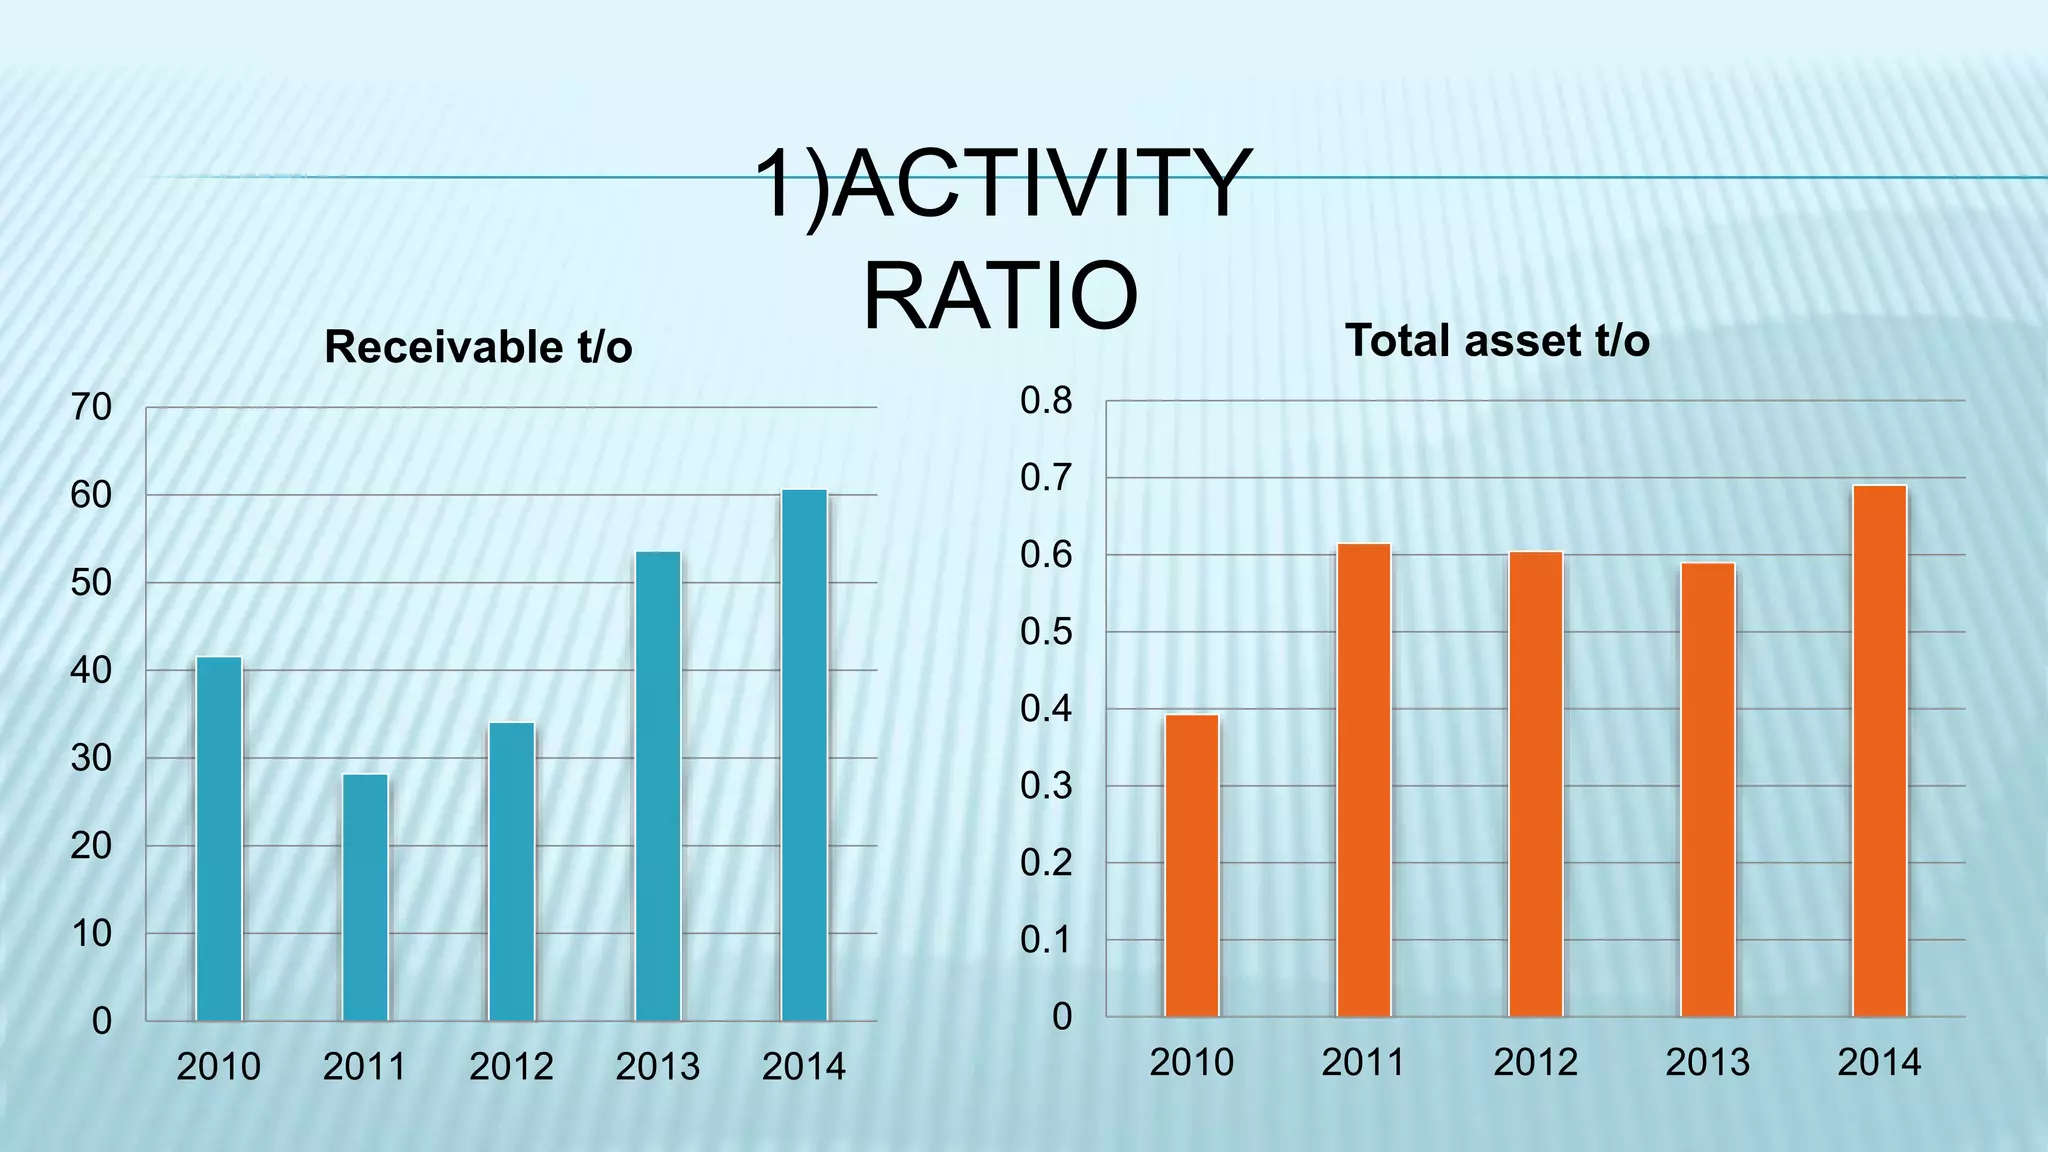
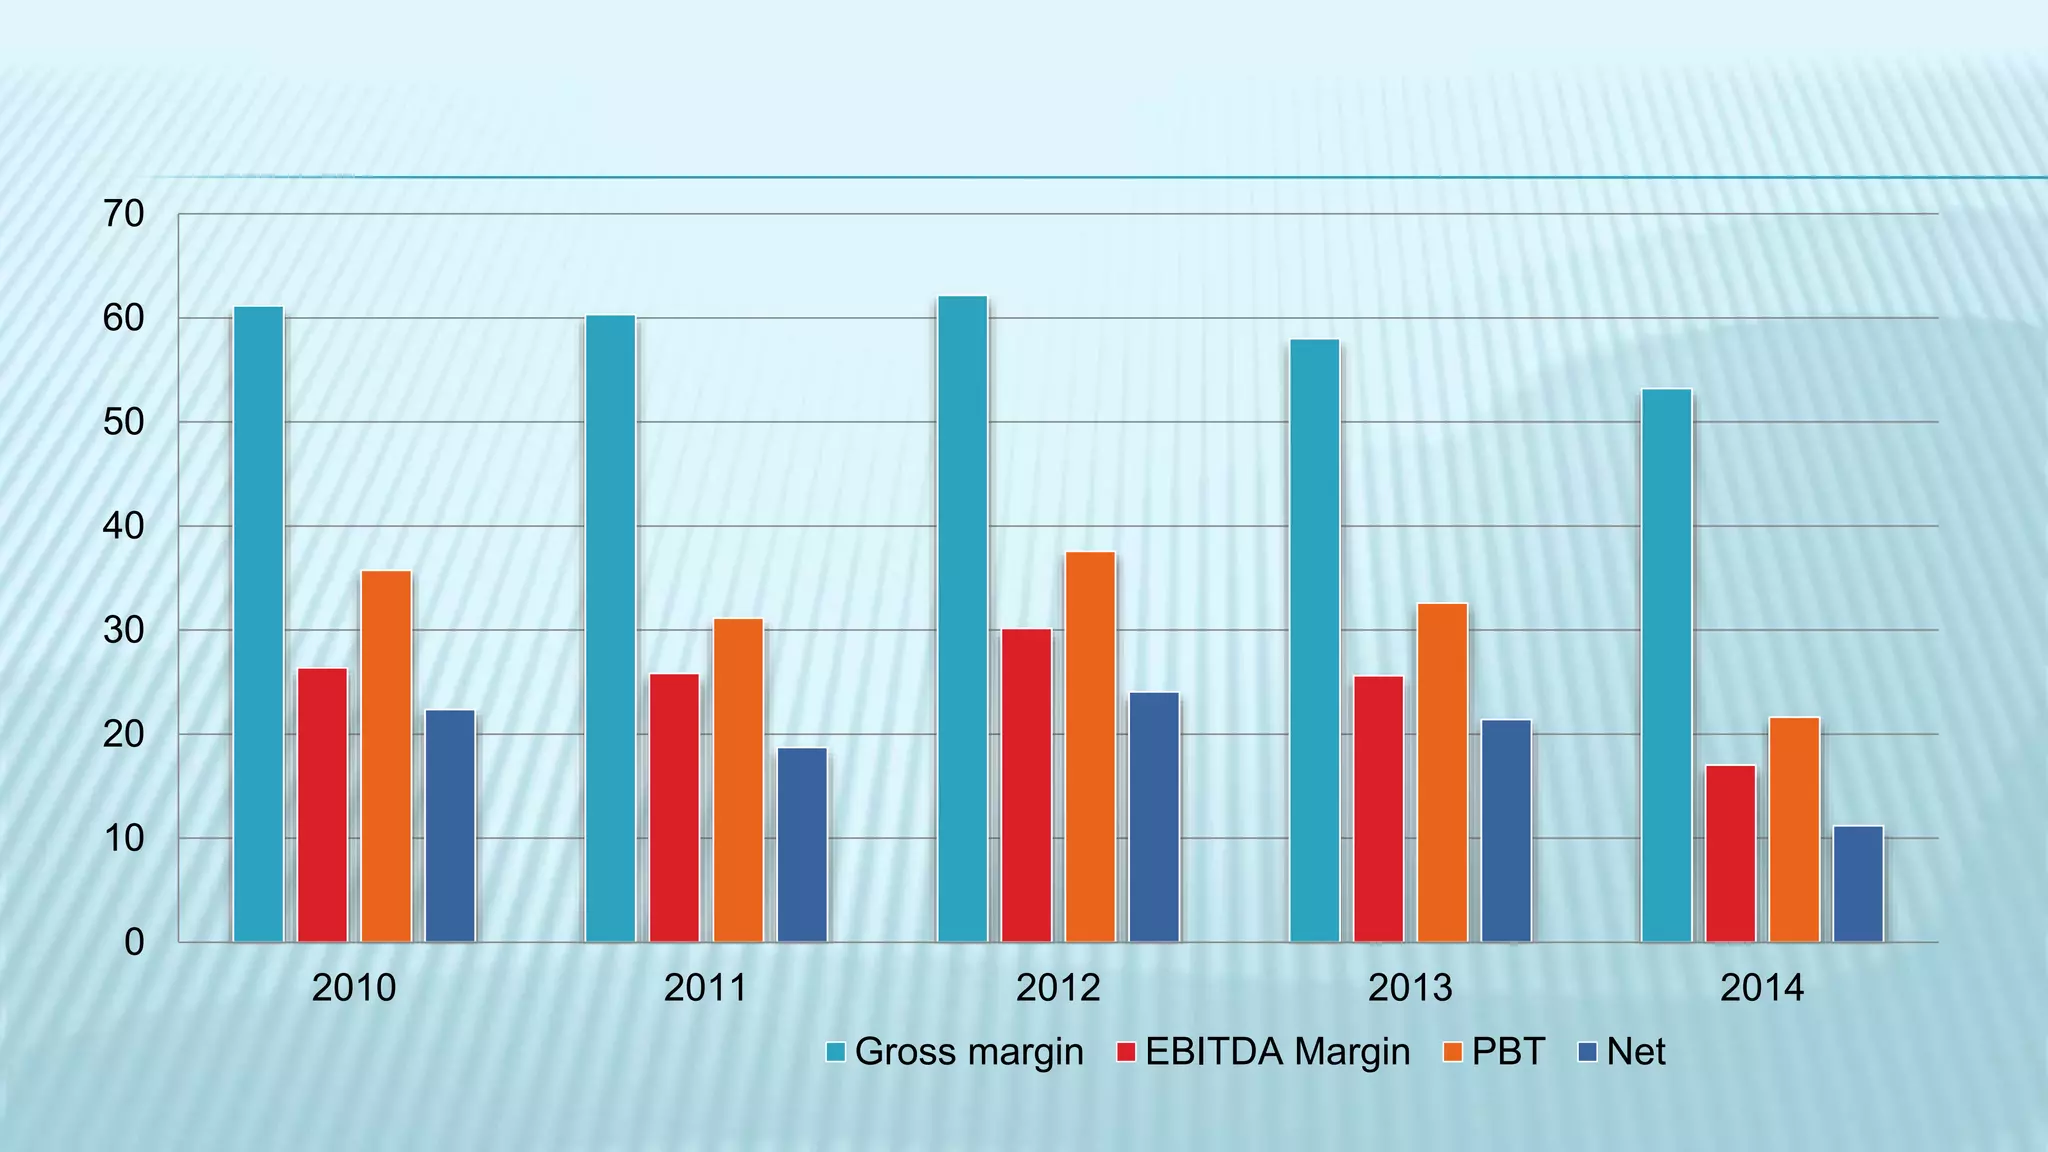
SUBMITTED BY :
ZIL SHAH
INTRODUCTION
 Info Edge(India) Ltd.is an Indian e-commerce/on-lineclassifiedscompany
 Foundedin 1995by SanjeevBikhchandani
 BUSINESSES:
 Recruitment–naukri.com,www.brijj.com,
www.firstnaukri.com,www.quadranglesearch.com.
 Matrimony-www.jeevansathi.com
 Real estate-www.99acres.com,www.allcheckdeals.com, Allcheckdeals.com
 Education- www.shiksha.com
REVENUE MODEL
PROFIT AND LOSS
0
1000
2000
3000
4000
5000
6000
2010 2011 2012 2013 2014
REVENUE COGS PAT
PROFIT AND LOSS
0
500
1000
1500
2000
2500
2010 2011 2012 2013 2014
DEPRE & AMM INT EXP SG&A
BALANCE SHEET
0
5000
10000
15000
20000
25000
2010 2011 2012 2013 2014
TOTAL ASSETS AND LIABILITIES
TOTAL LIABILITIES TOTAL ASSETS
CASH FLOWS
-2500
-2000
-1500
-1000
-500
0
500
1000
1500
2010 2011 2012 2013 2014
CASH FLOWS
CFFO CFFI CFFF
TOTAL CASH FLOW
-430.27
-714.31
226.53
78.30
190.26
-800.00
-600.00
-400.00
-200.00
0.00
200.00
400.00
RATIOS
ACTIVITYRATIOS:
Receivable t/o = sales / average receivables
Inventory t/o = Cost of goods sold(COGS) / average inventory
Payable t/o = Purchase / average trade payable
Total asset t/o = Revenue/ average total assets
0
0.1
0.2
0.3
0.4
0.5
0.6
0.7
0.8
2010 2011 2012 2013 2014
Total asset t/o
0
10
20
30
40
50
60
70
2010 2011 2012 2013 2014
Receivable t/o
1)ACTIVITY
RATIO
LIQUIDITY RATIO:
Current ratio = Current asset / Current liability.
Quickratio = Cash + MES + AR / Current liability (exclude inventory).
Cash ratio = Cash + MES / Current liability.
2014 2013 2012 2011 2010
Current Ratio = current asset/current liability 3.139231199 1.906980702 1.831745278 2.422964562 4.6480168
Quick Ratio=Cash + MES + AR / Current liab
(exclude inventory)
3.06 1.811000306 1.748840674 2.341420043 4.403098586
Cash Ratio = Cash + MES / Current liab 3.02604295 1.764707026 1.705134503 2.241919418 4.31429085
0
0.5
1
1.5
2
2.5
3
3.5
4
4.5
5
LIQUIDITY RATIO
3) SOLVENCY RATIO :
Debt to equity(DER) = Total debt / Total equity
Debt to assets = Total debt / Total assets
Interestcoverage ratio = Operating income (or EBIT) / Interestexpense
0
10
20
30
40
50
60
2010 2011 2012 2013 2014
SOLVENCY RATIO
DER = totoal Debt / Total equity
Debt to Asset
Interest coverage ratio
0
0.05
0.1
0.15
0.2
0.25
0.3
0.35
0.4
2010 2011 2012 2013 2014
DER and Debt to Assets
DER = totoal Debt / Total equity Debt to Asset
0
10
20
30
40
50
60
70
2010 2011 2012 2013 2014
Gross margin EBITDA Margin PBT Net
VALUATION RATIO
Price/EarningsPAT /NO.EQUITY SHARES
P/E RATIO = MPS/EPS
=807.60(BSE)/8.21
=98.36 times
Info Edge (India) Ltd.

Info Edge (India) Ltd.