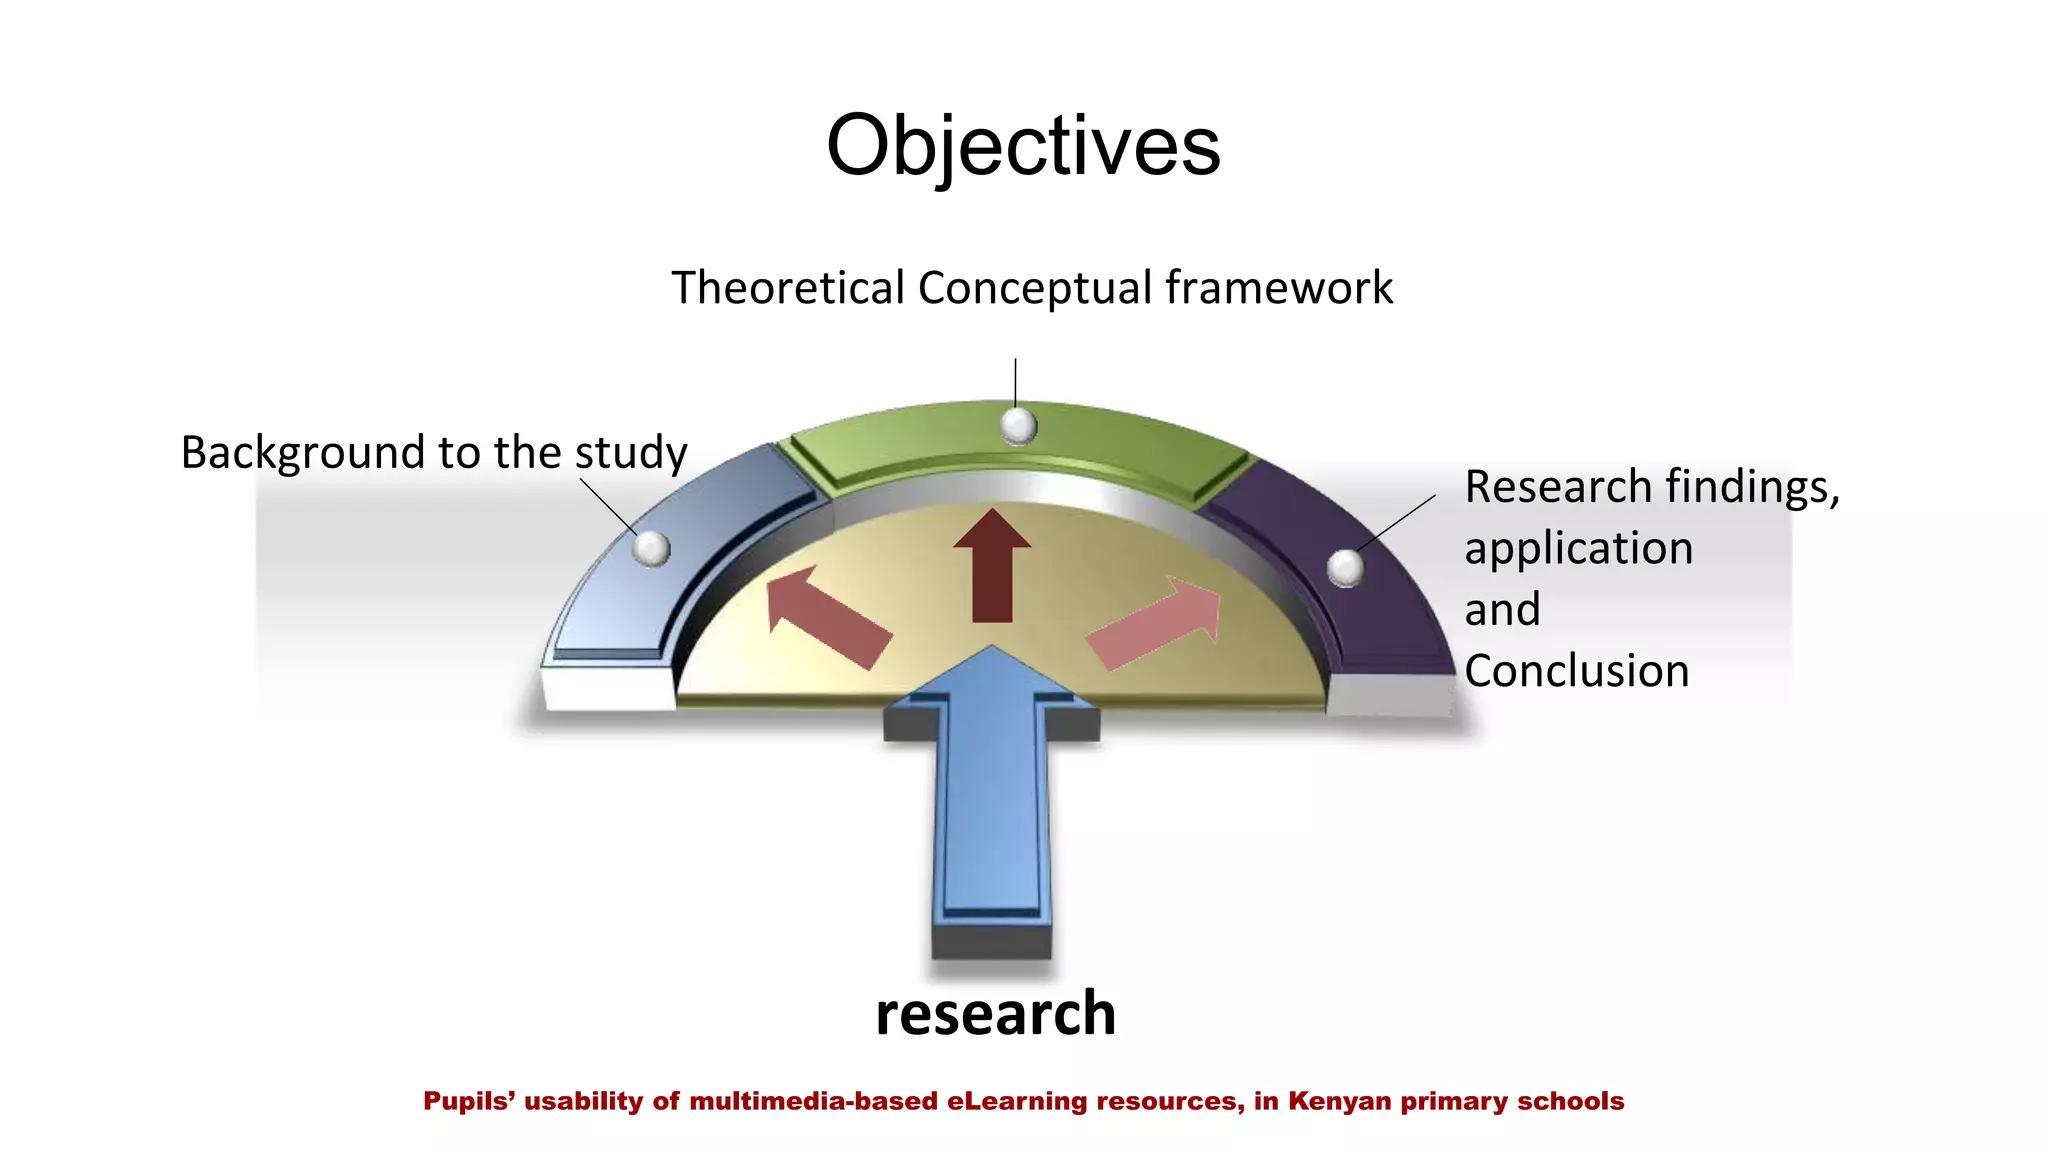
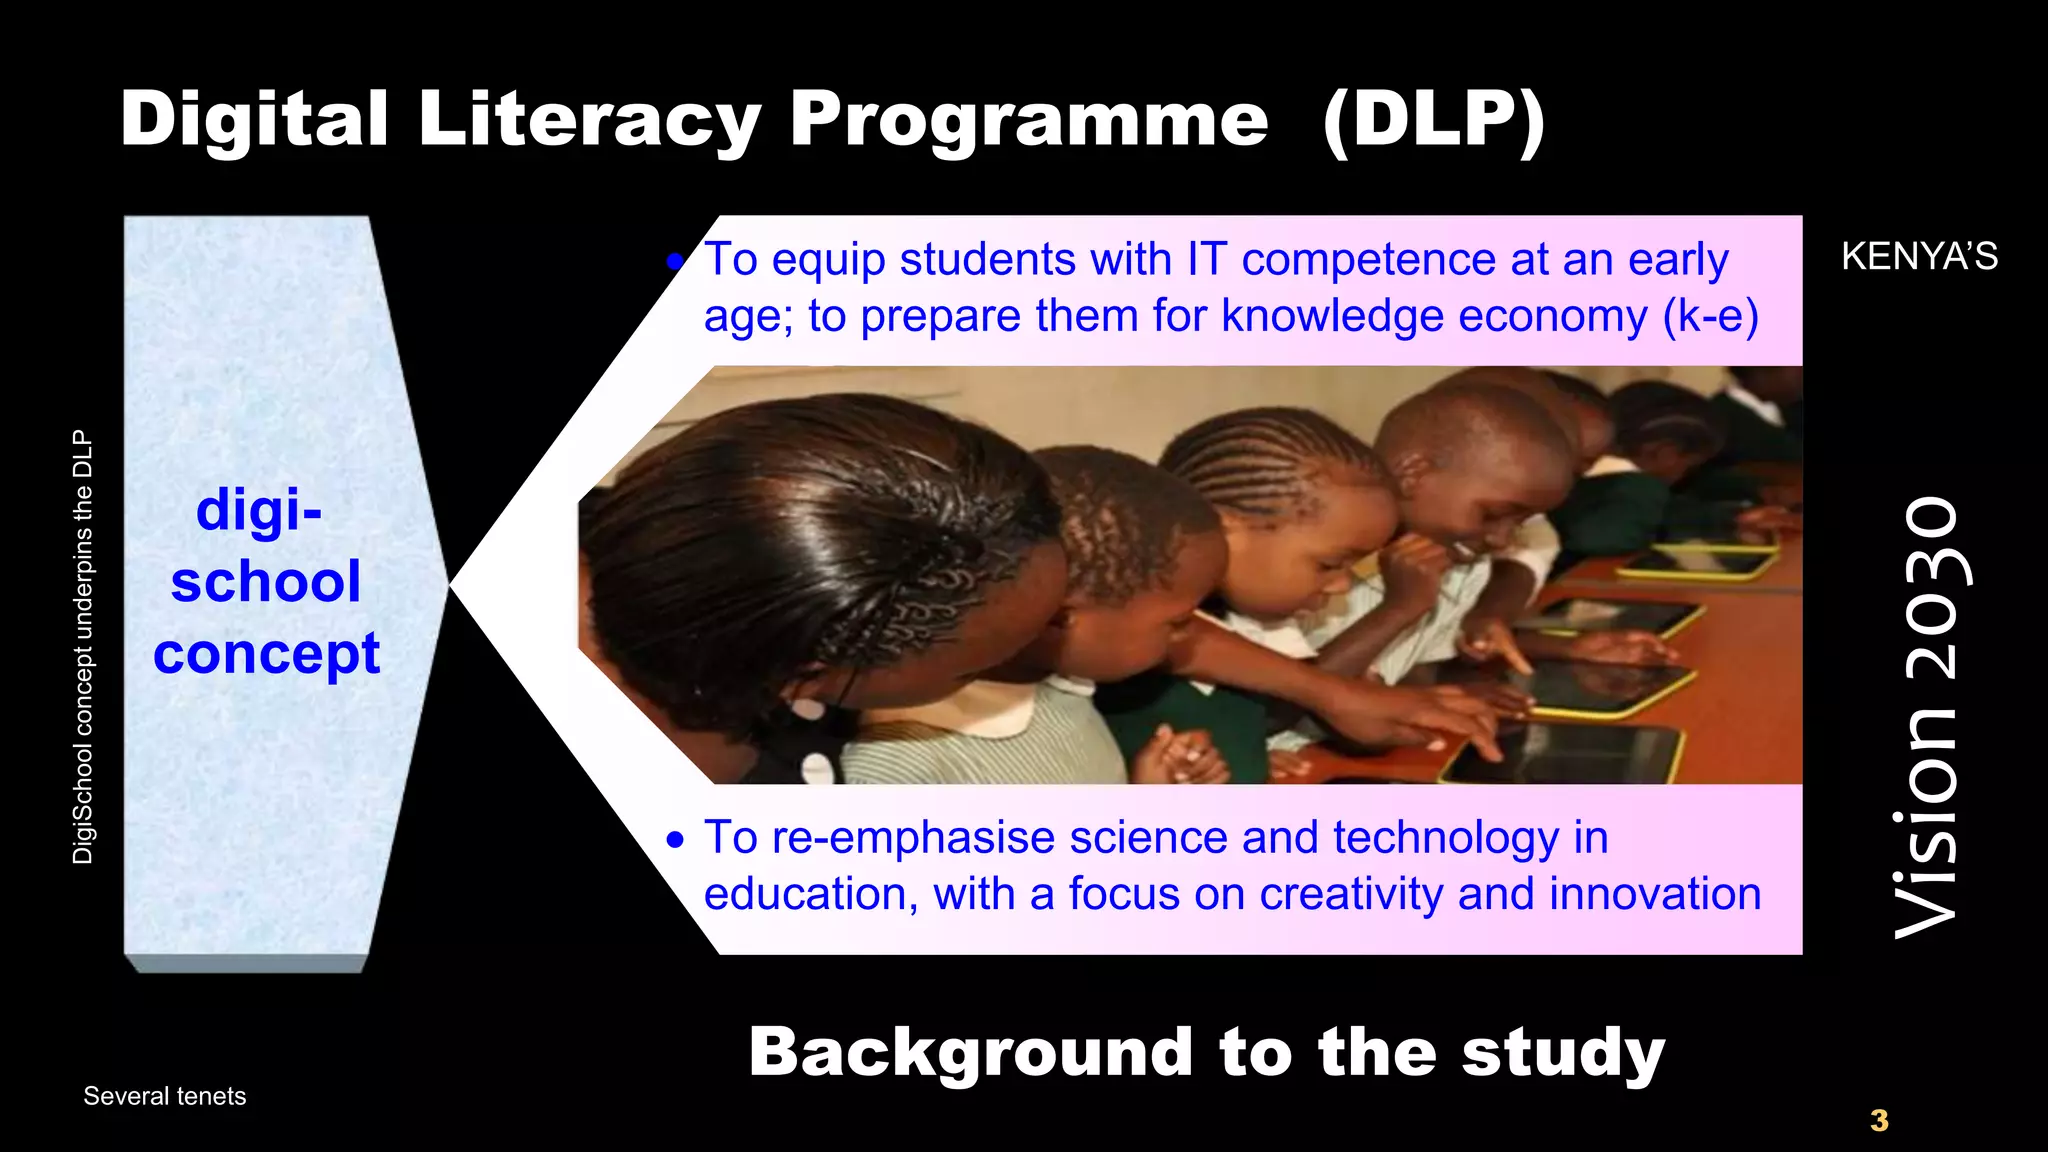
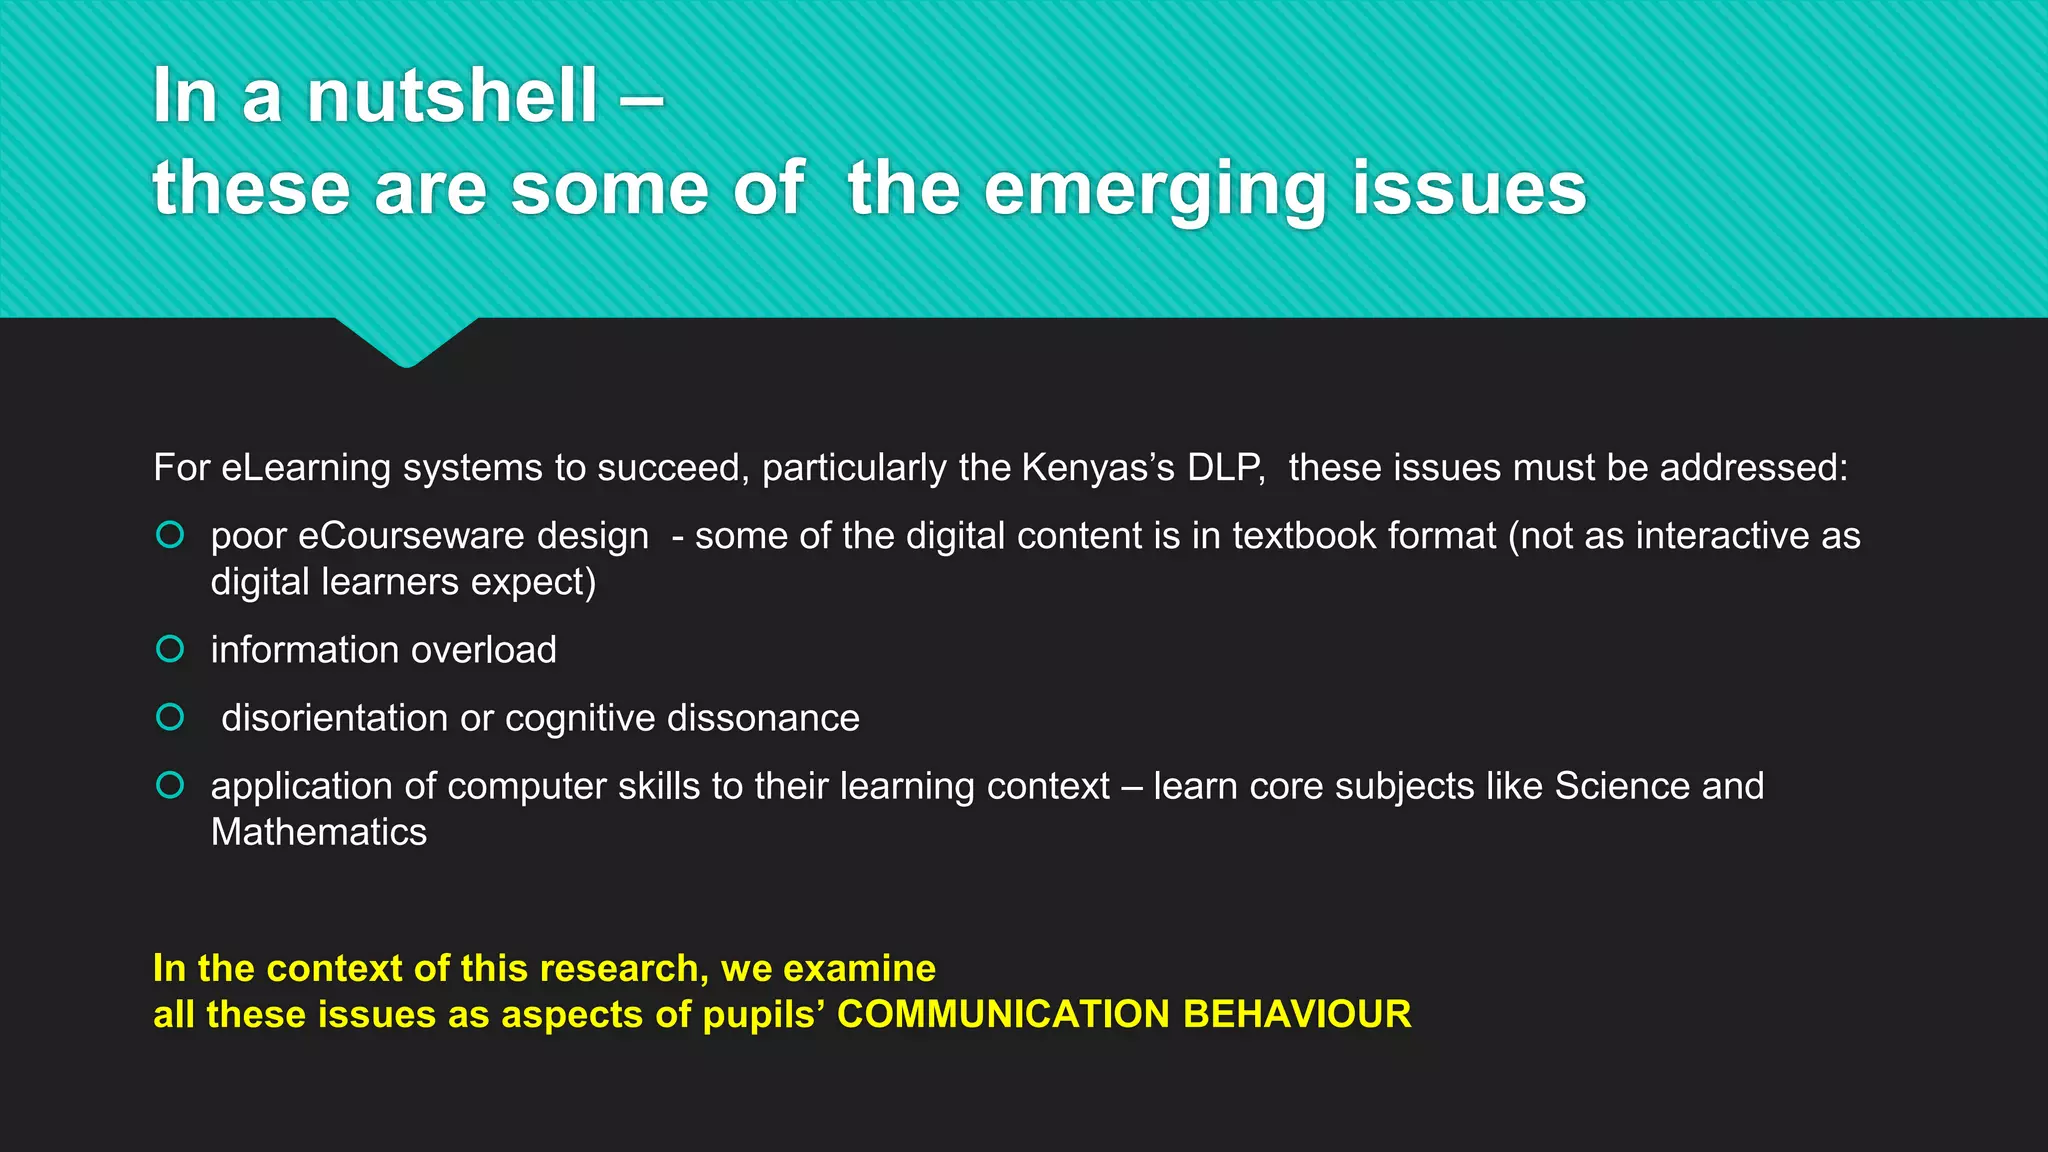
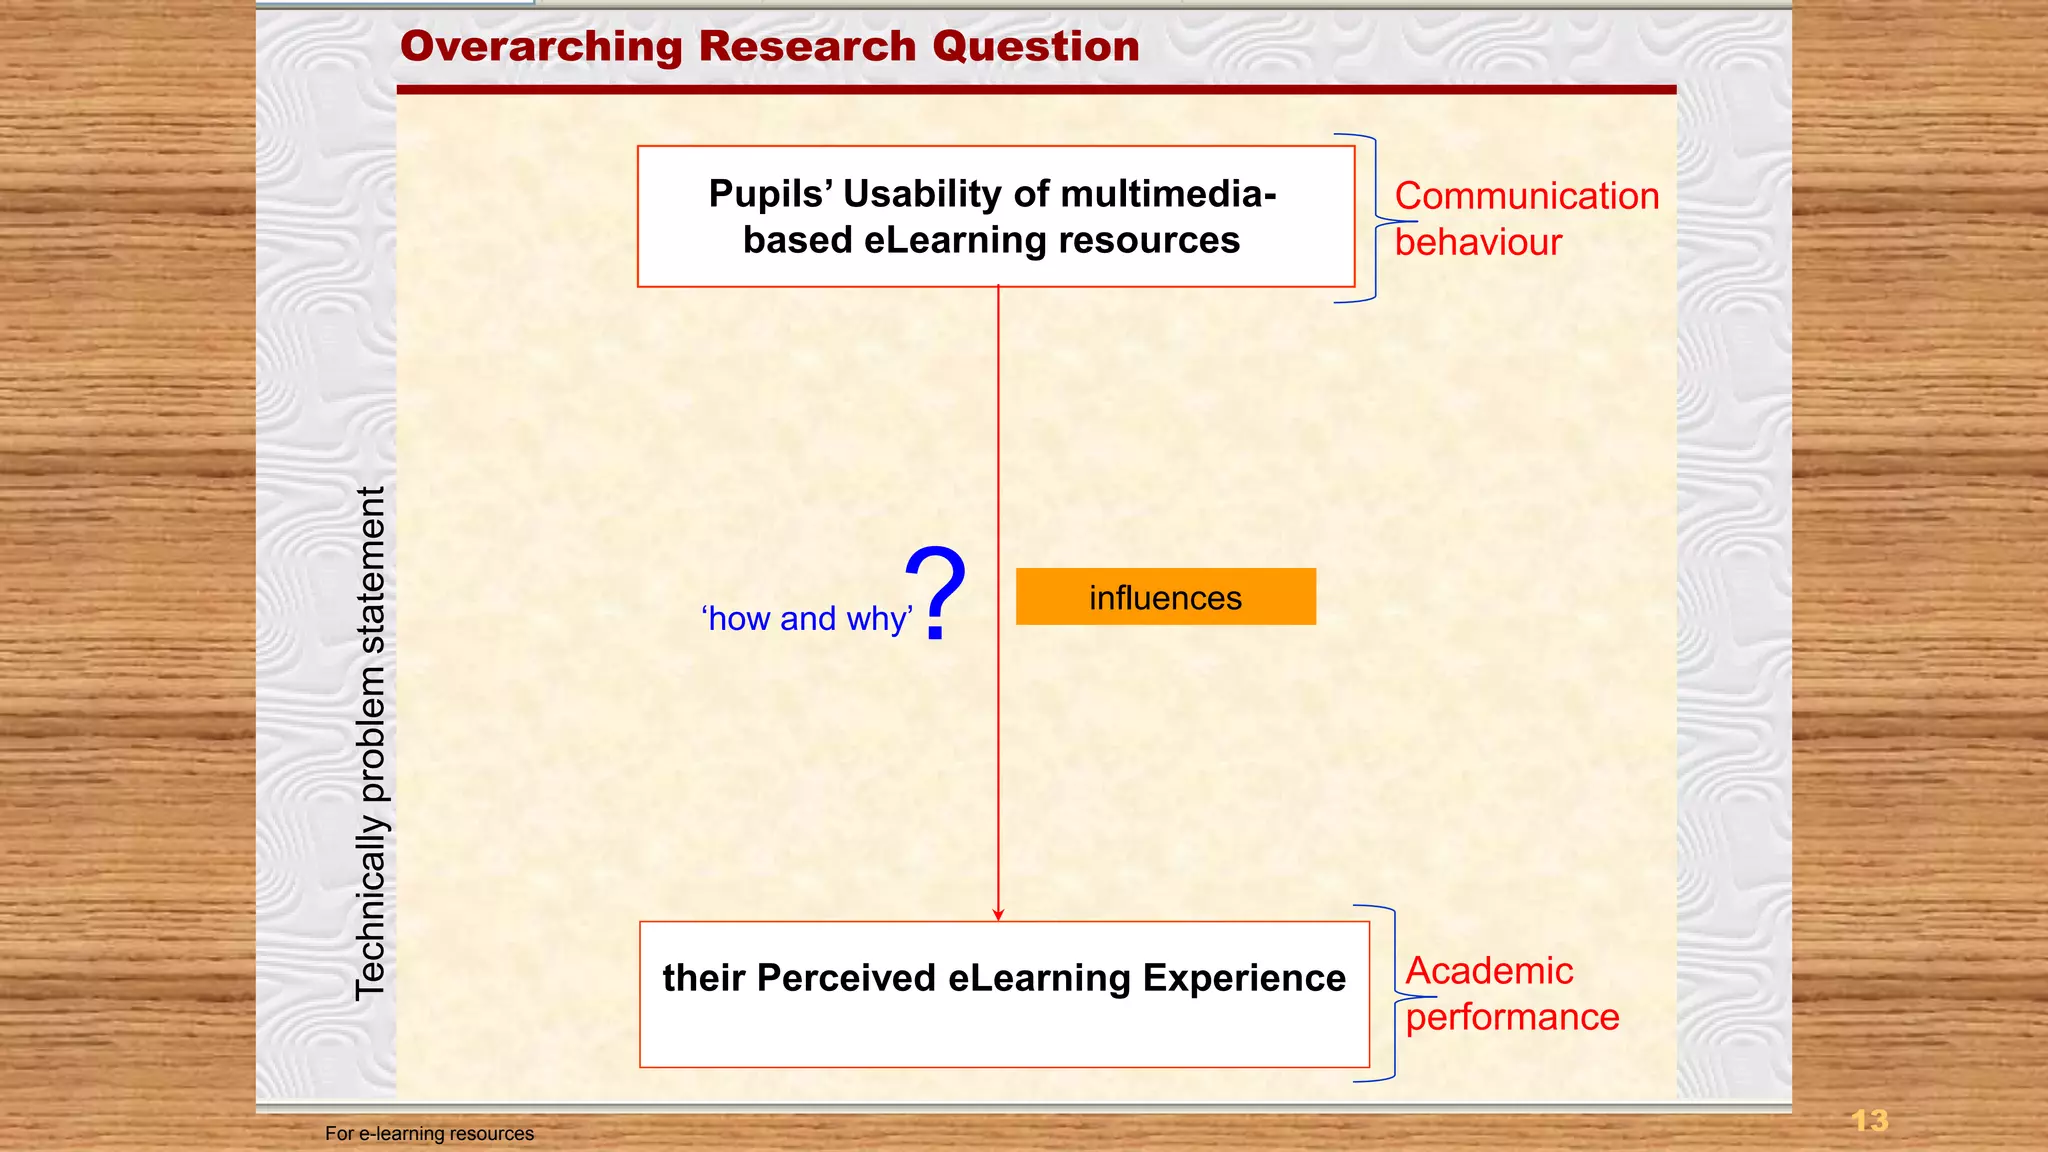
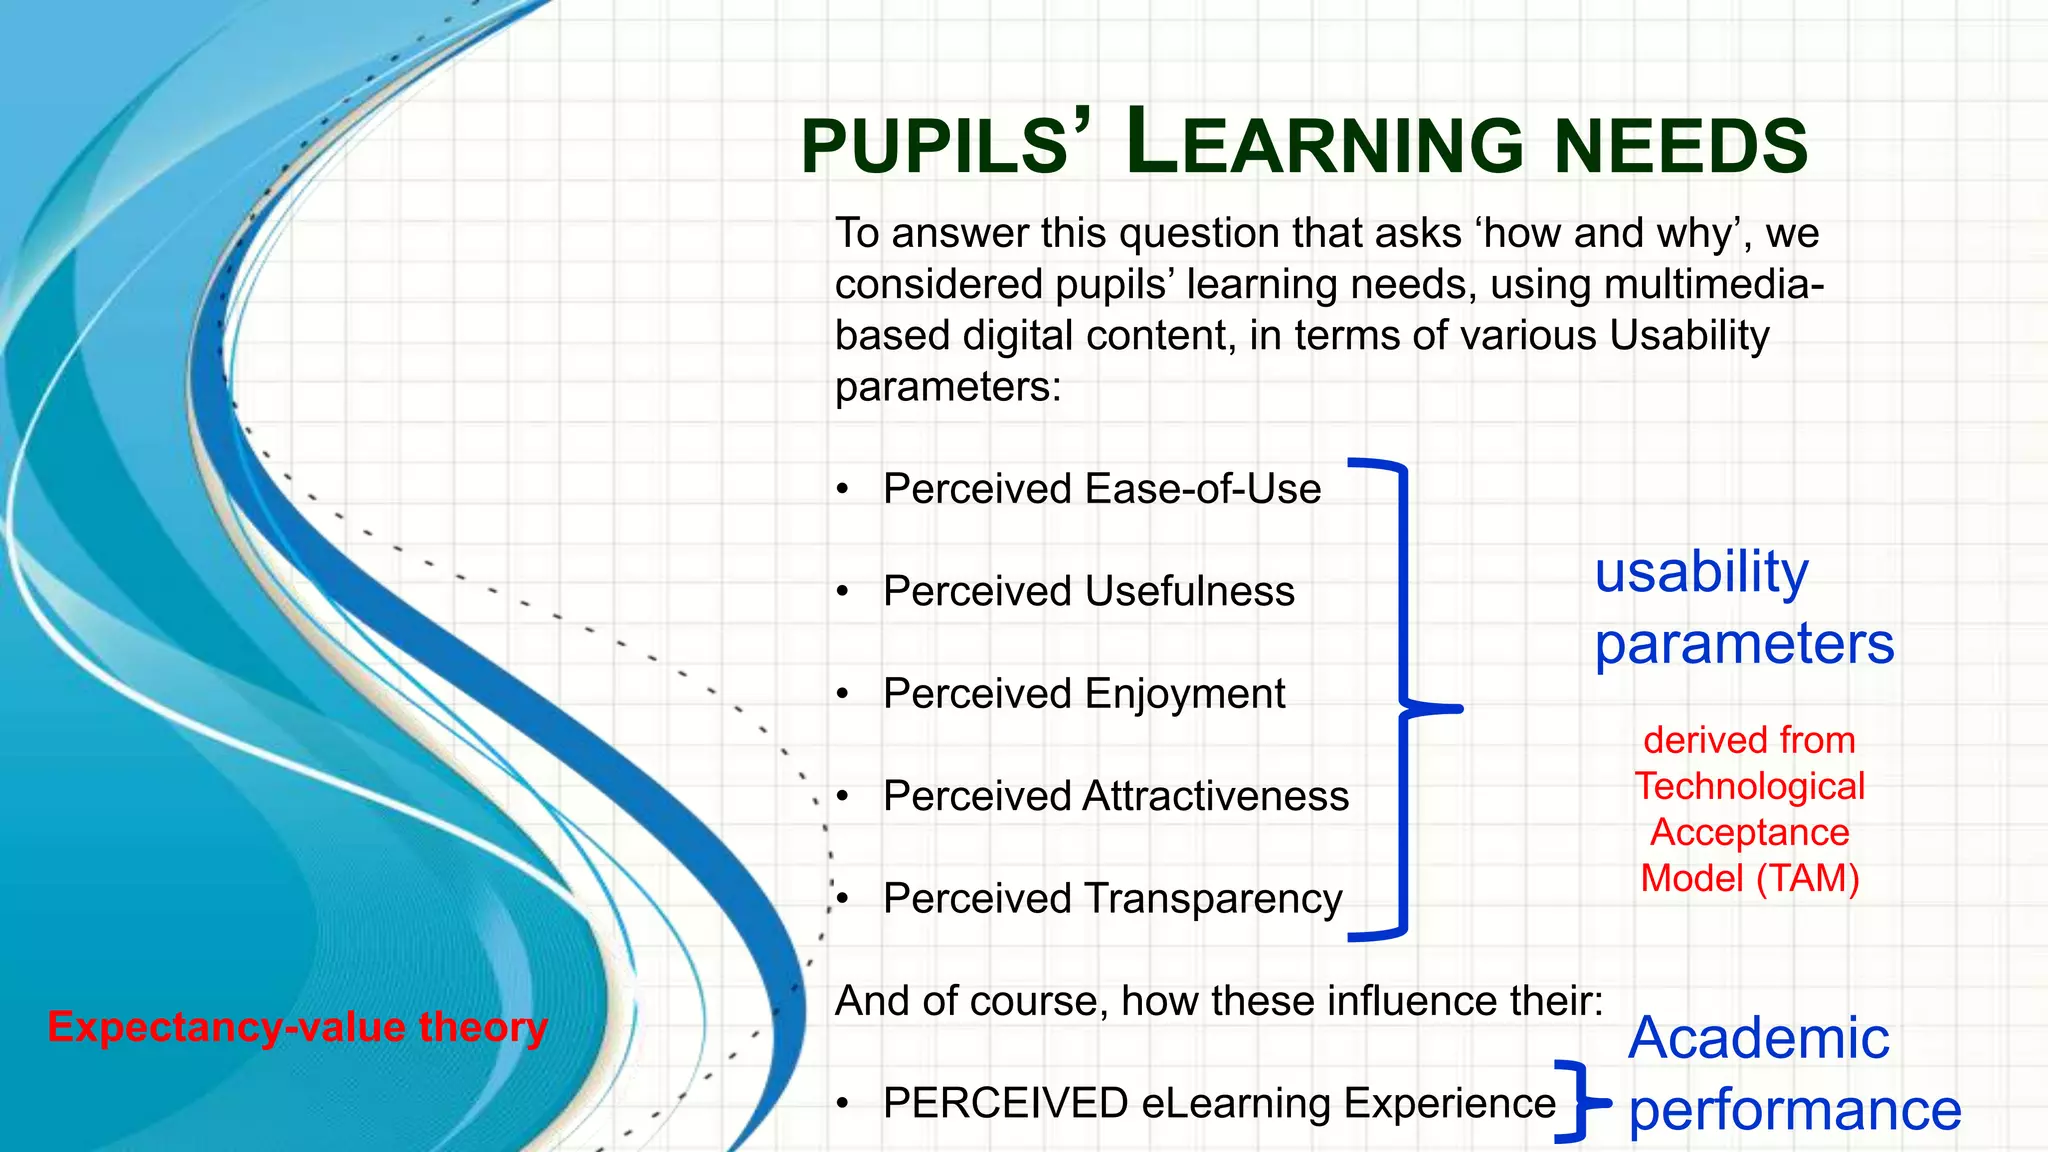
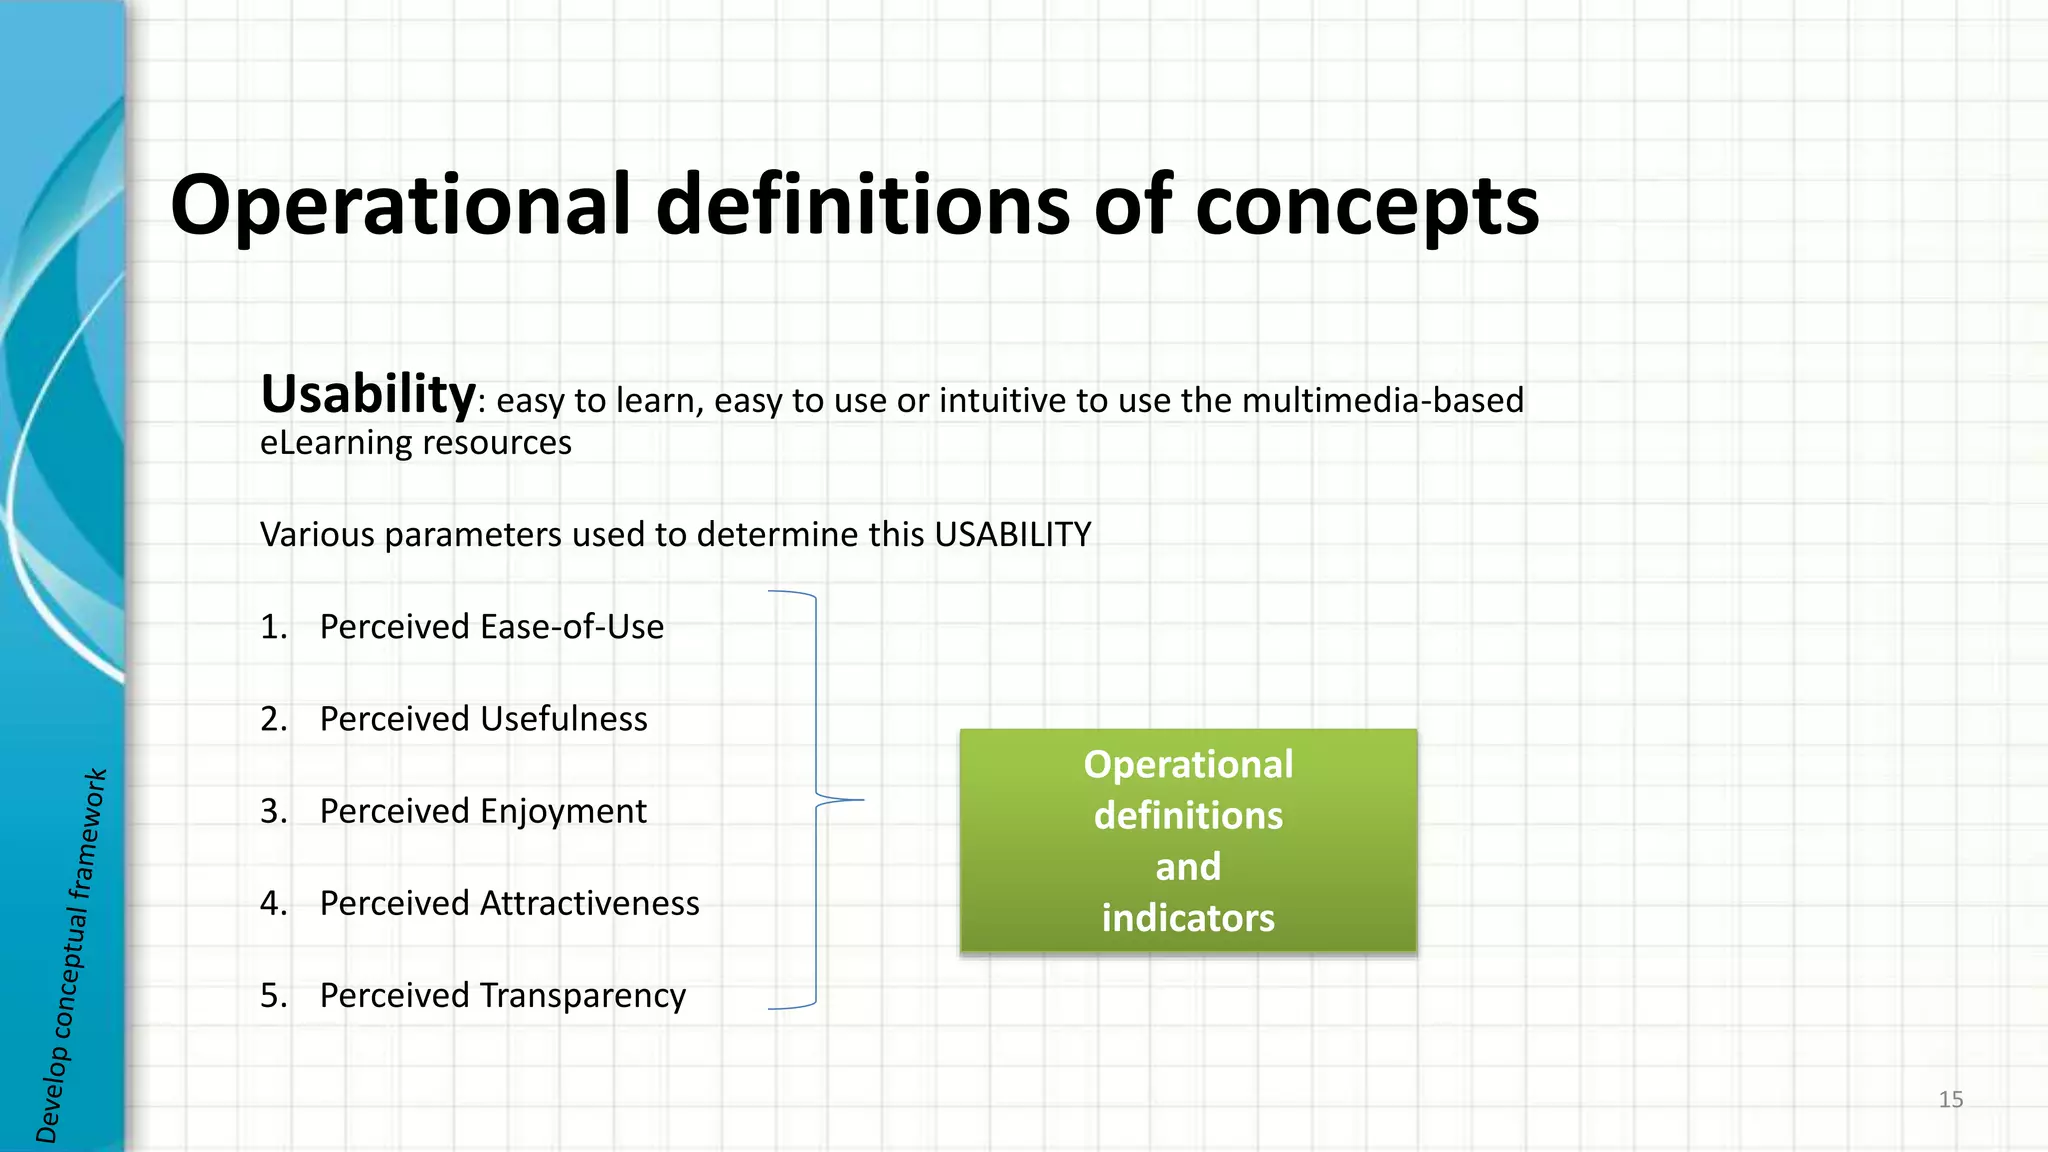
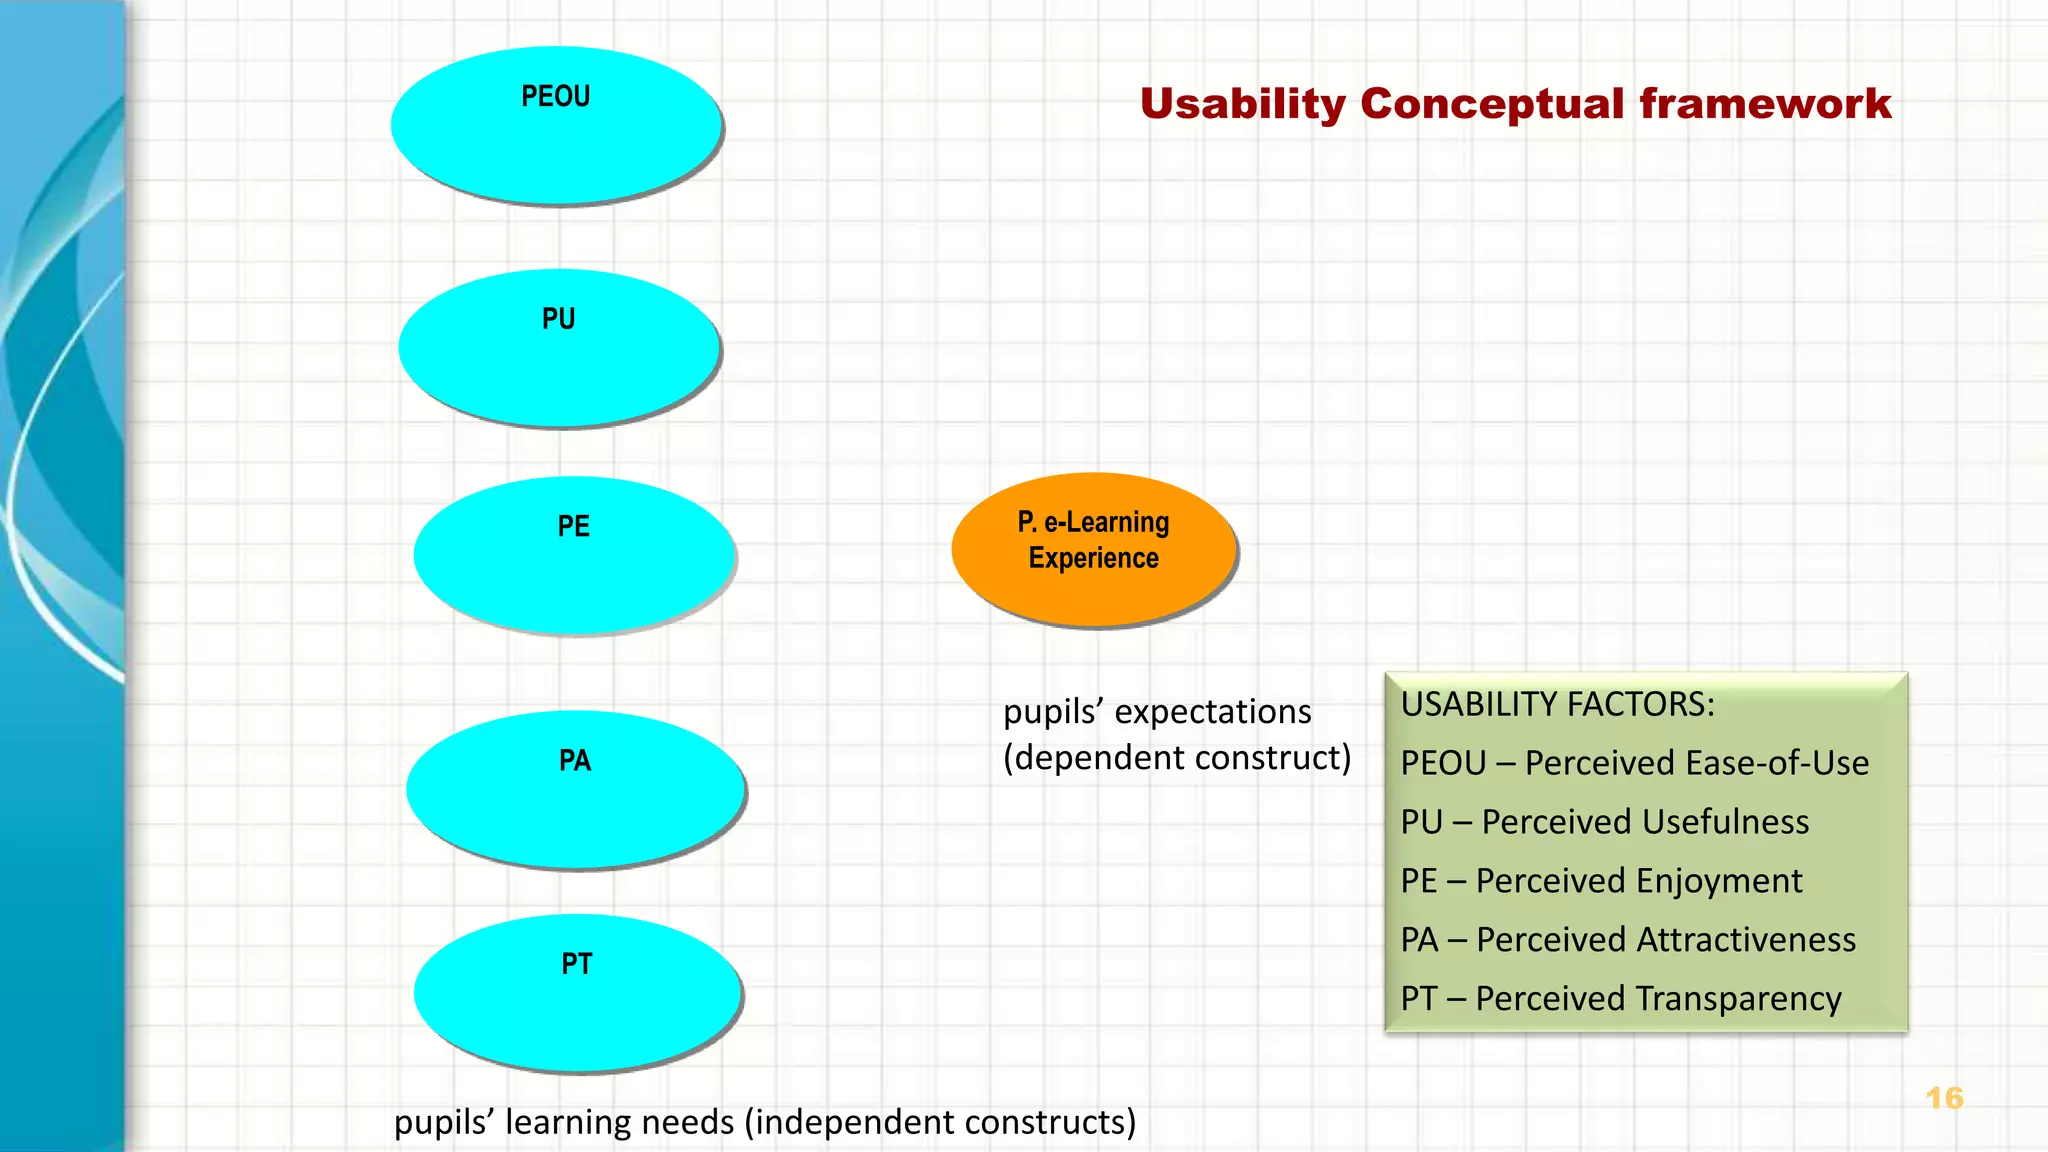
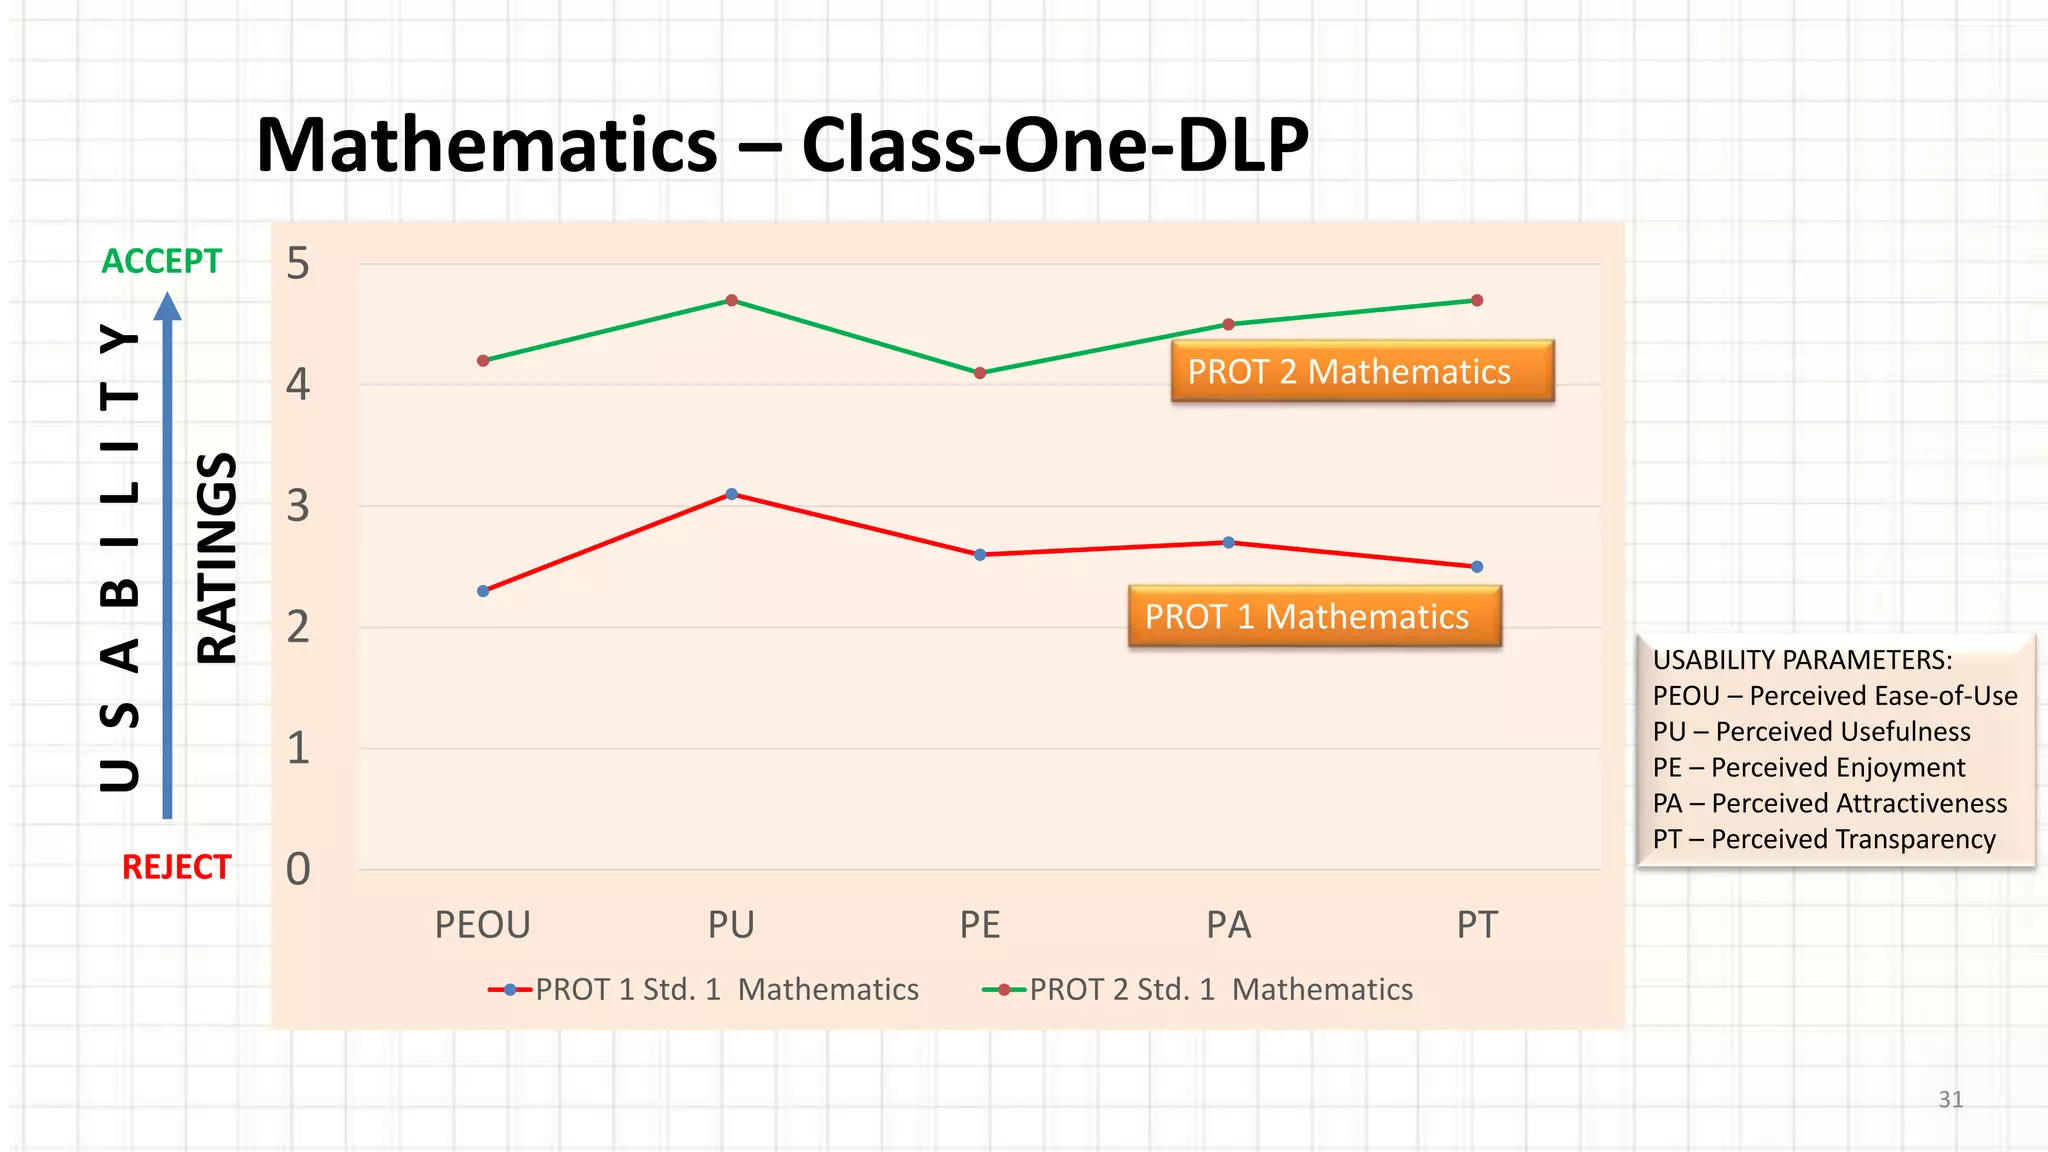
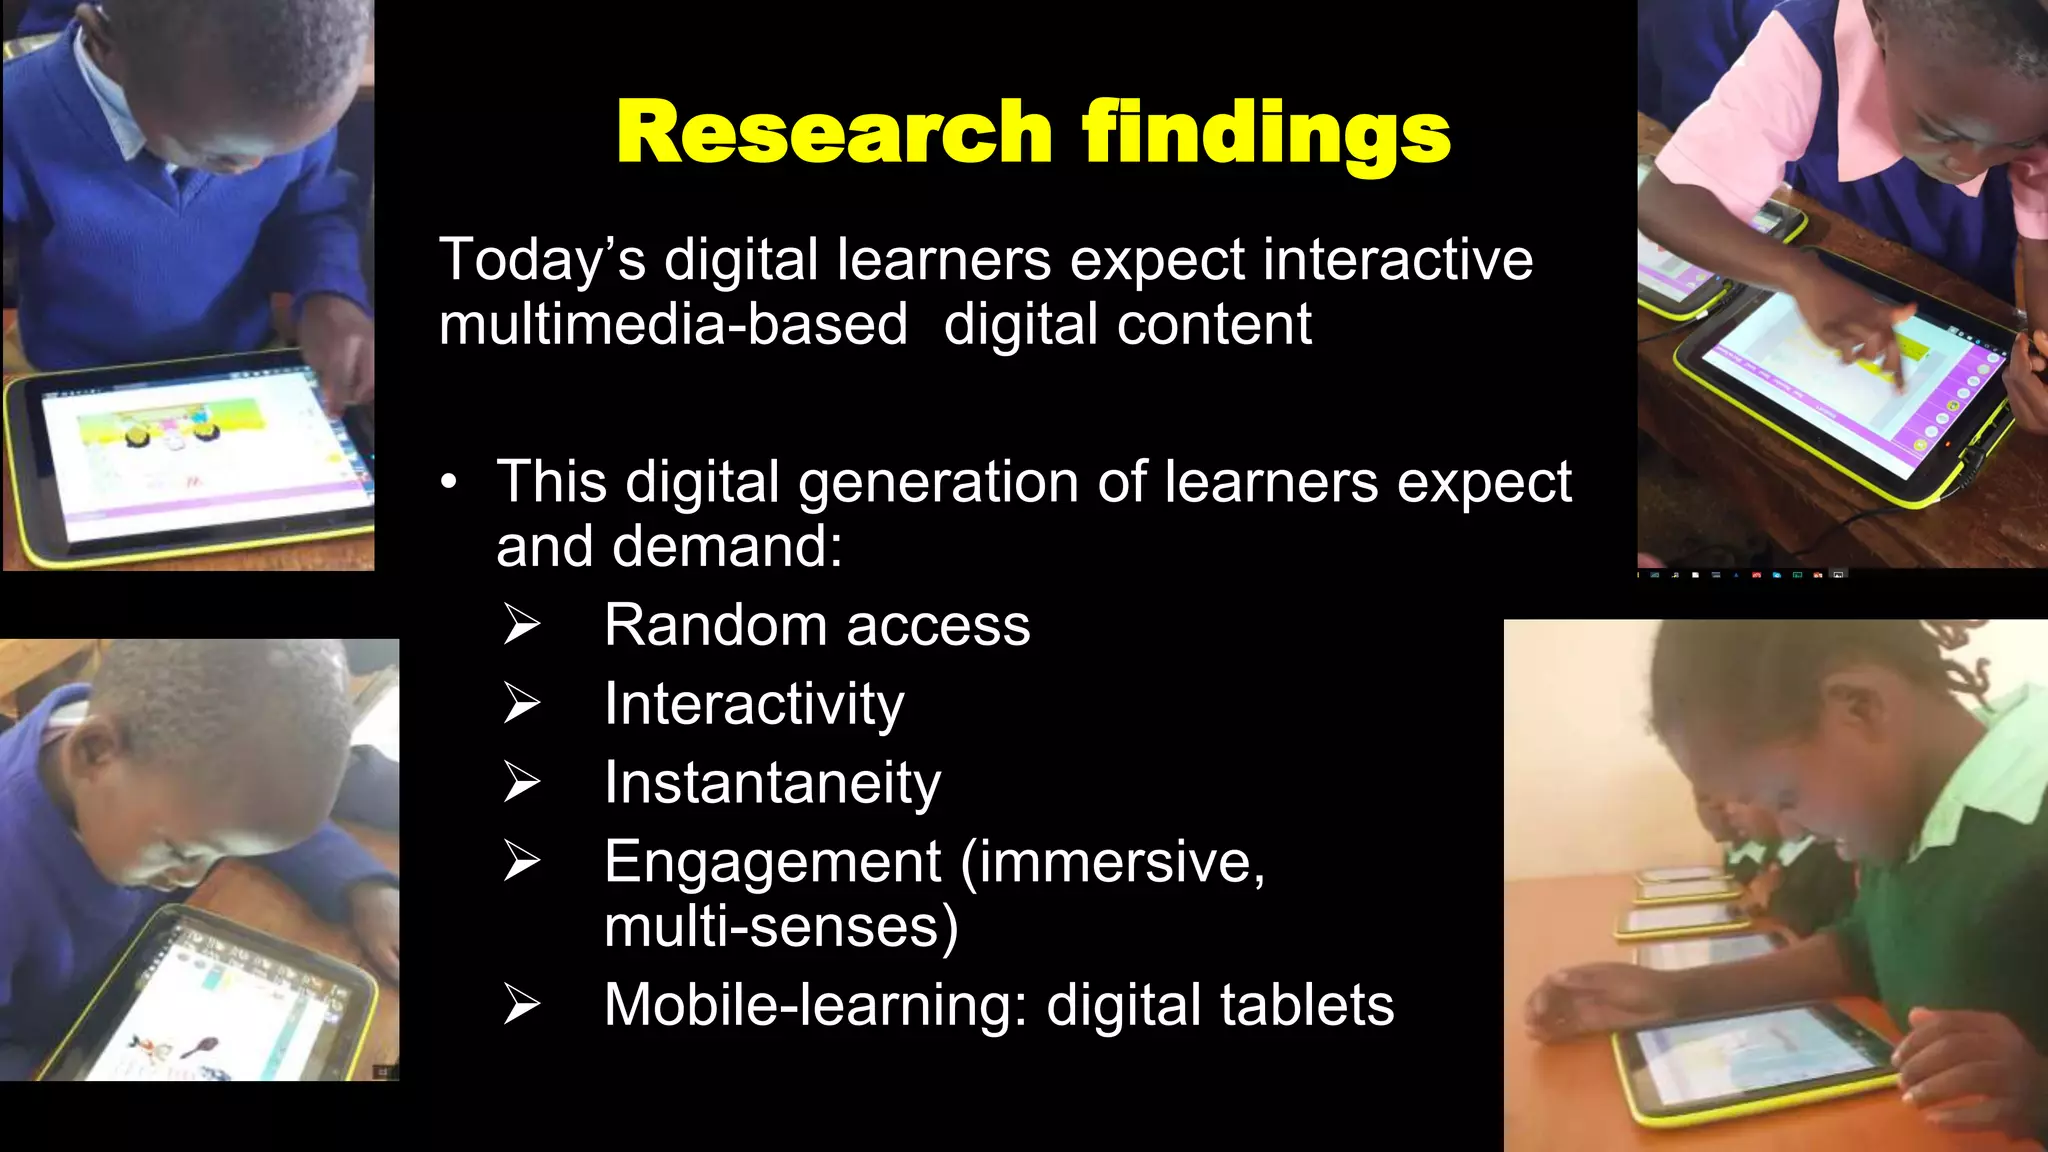
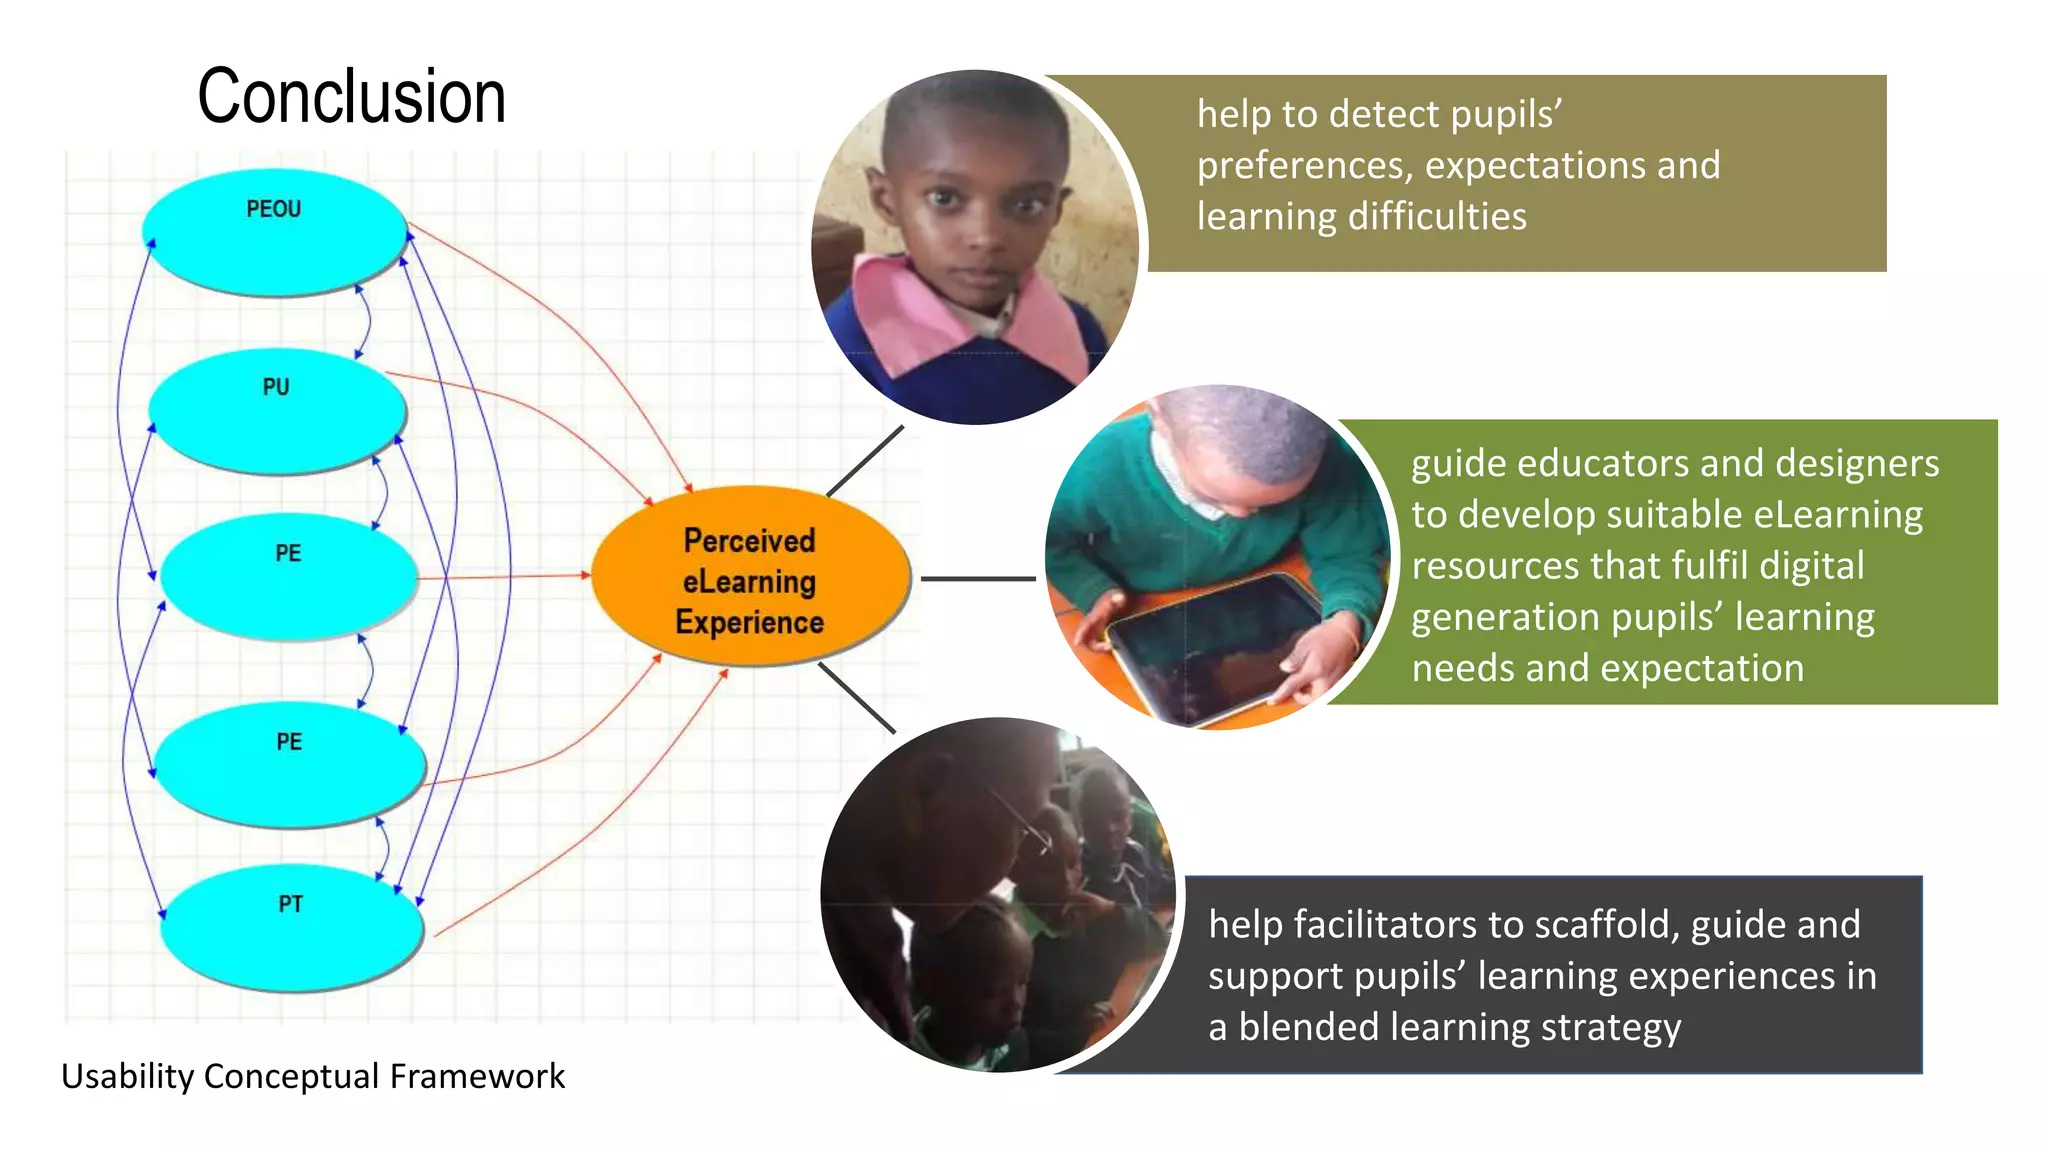
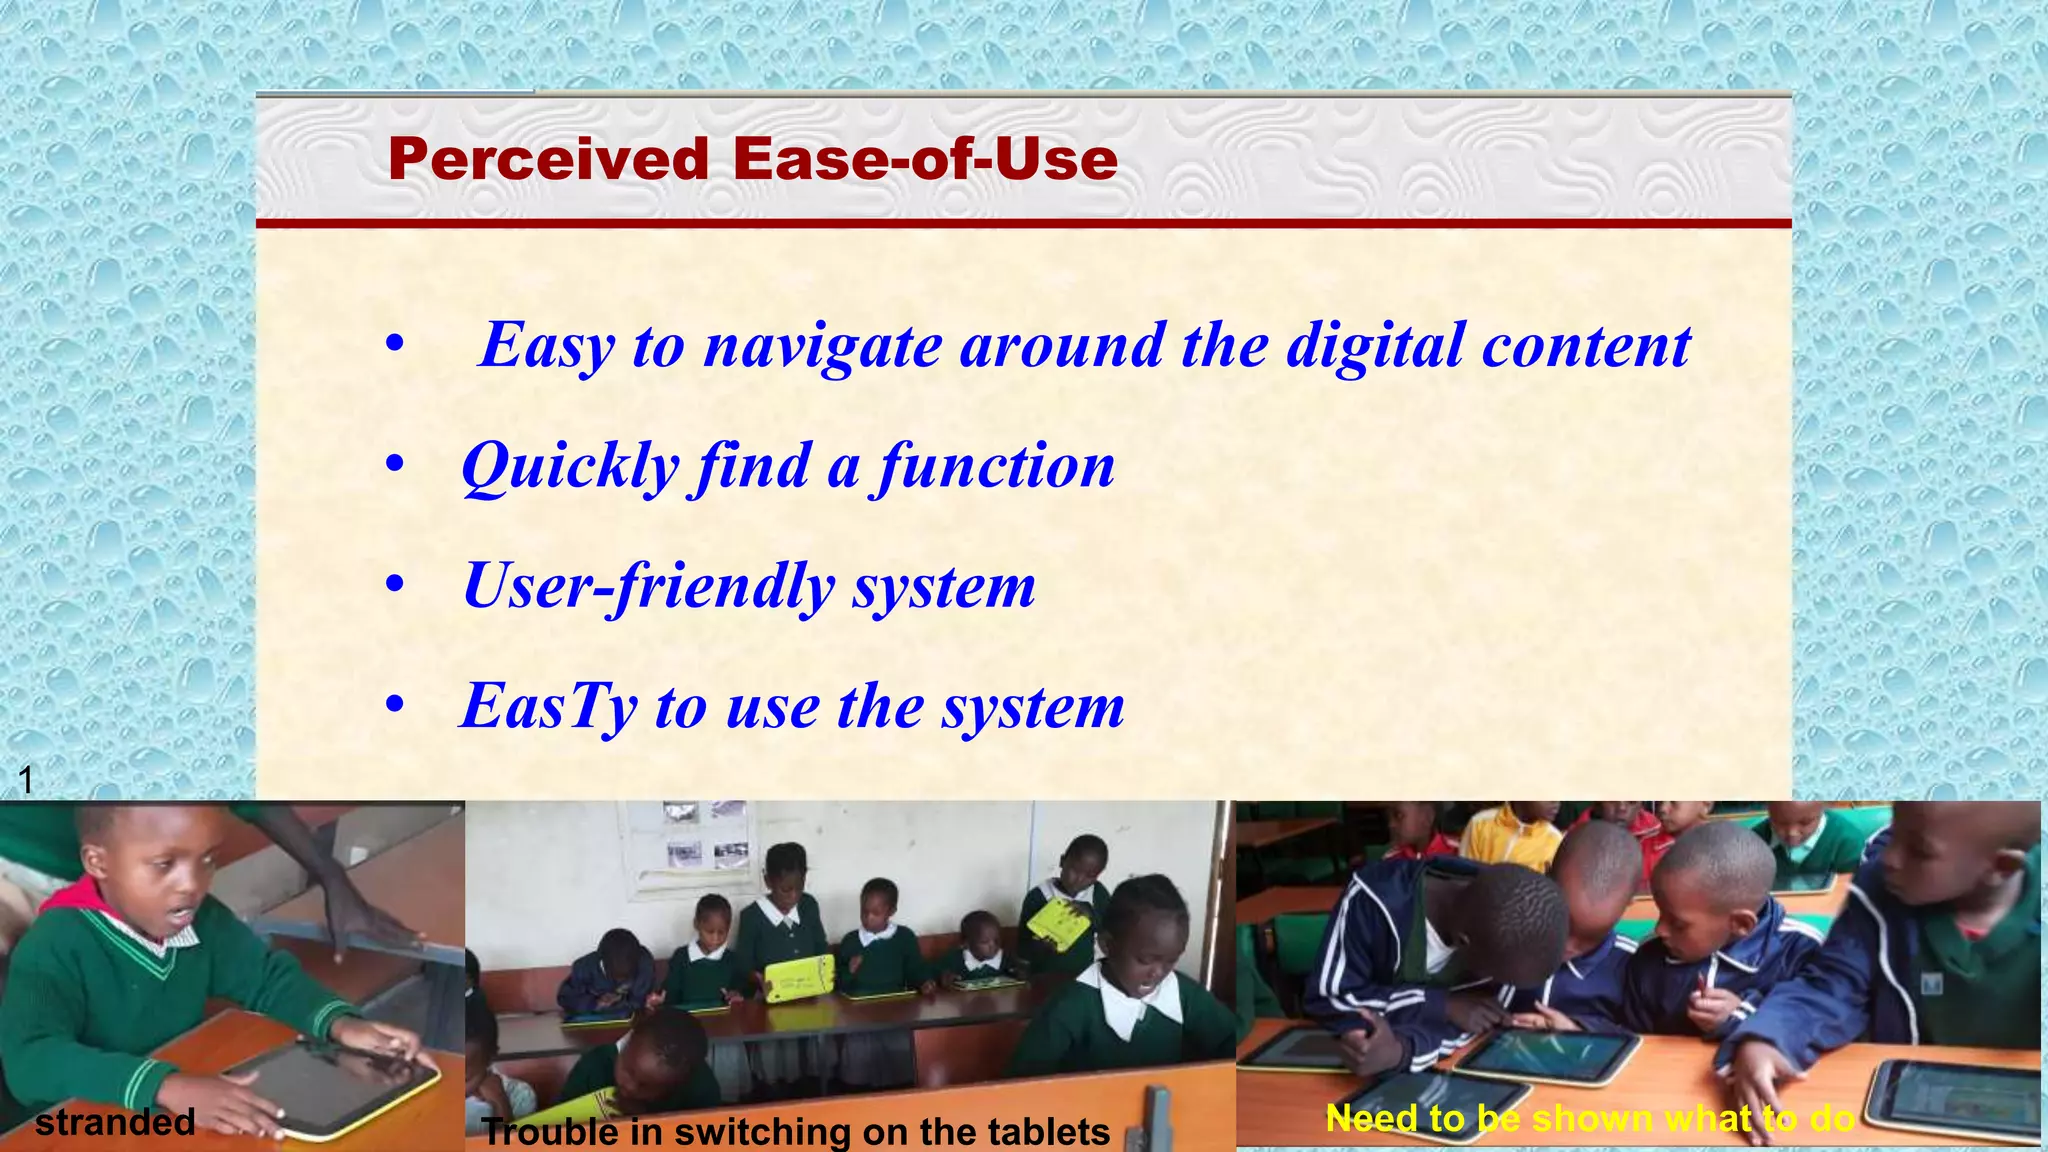
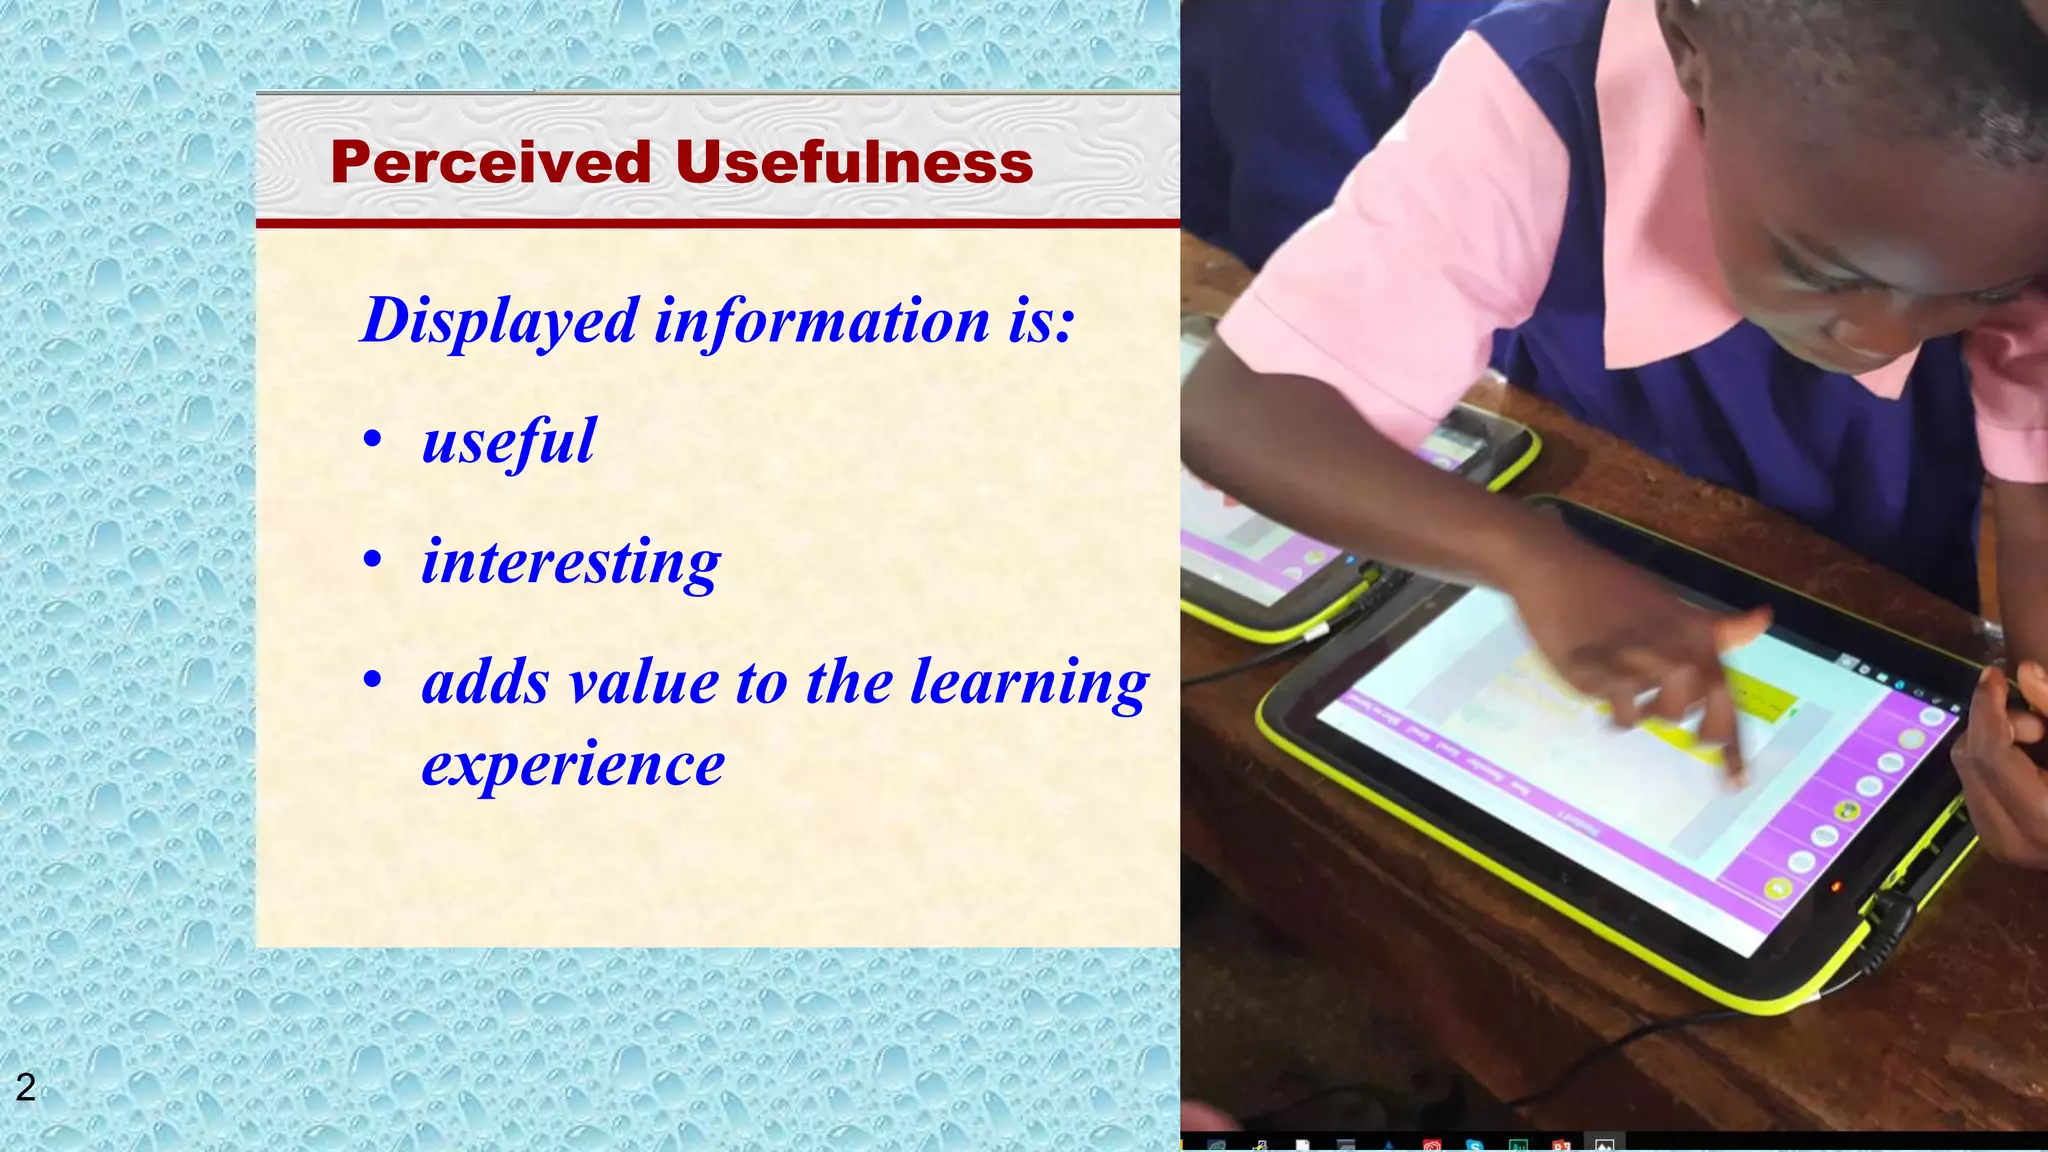
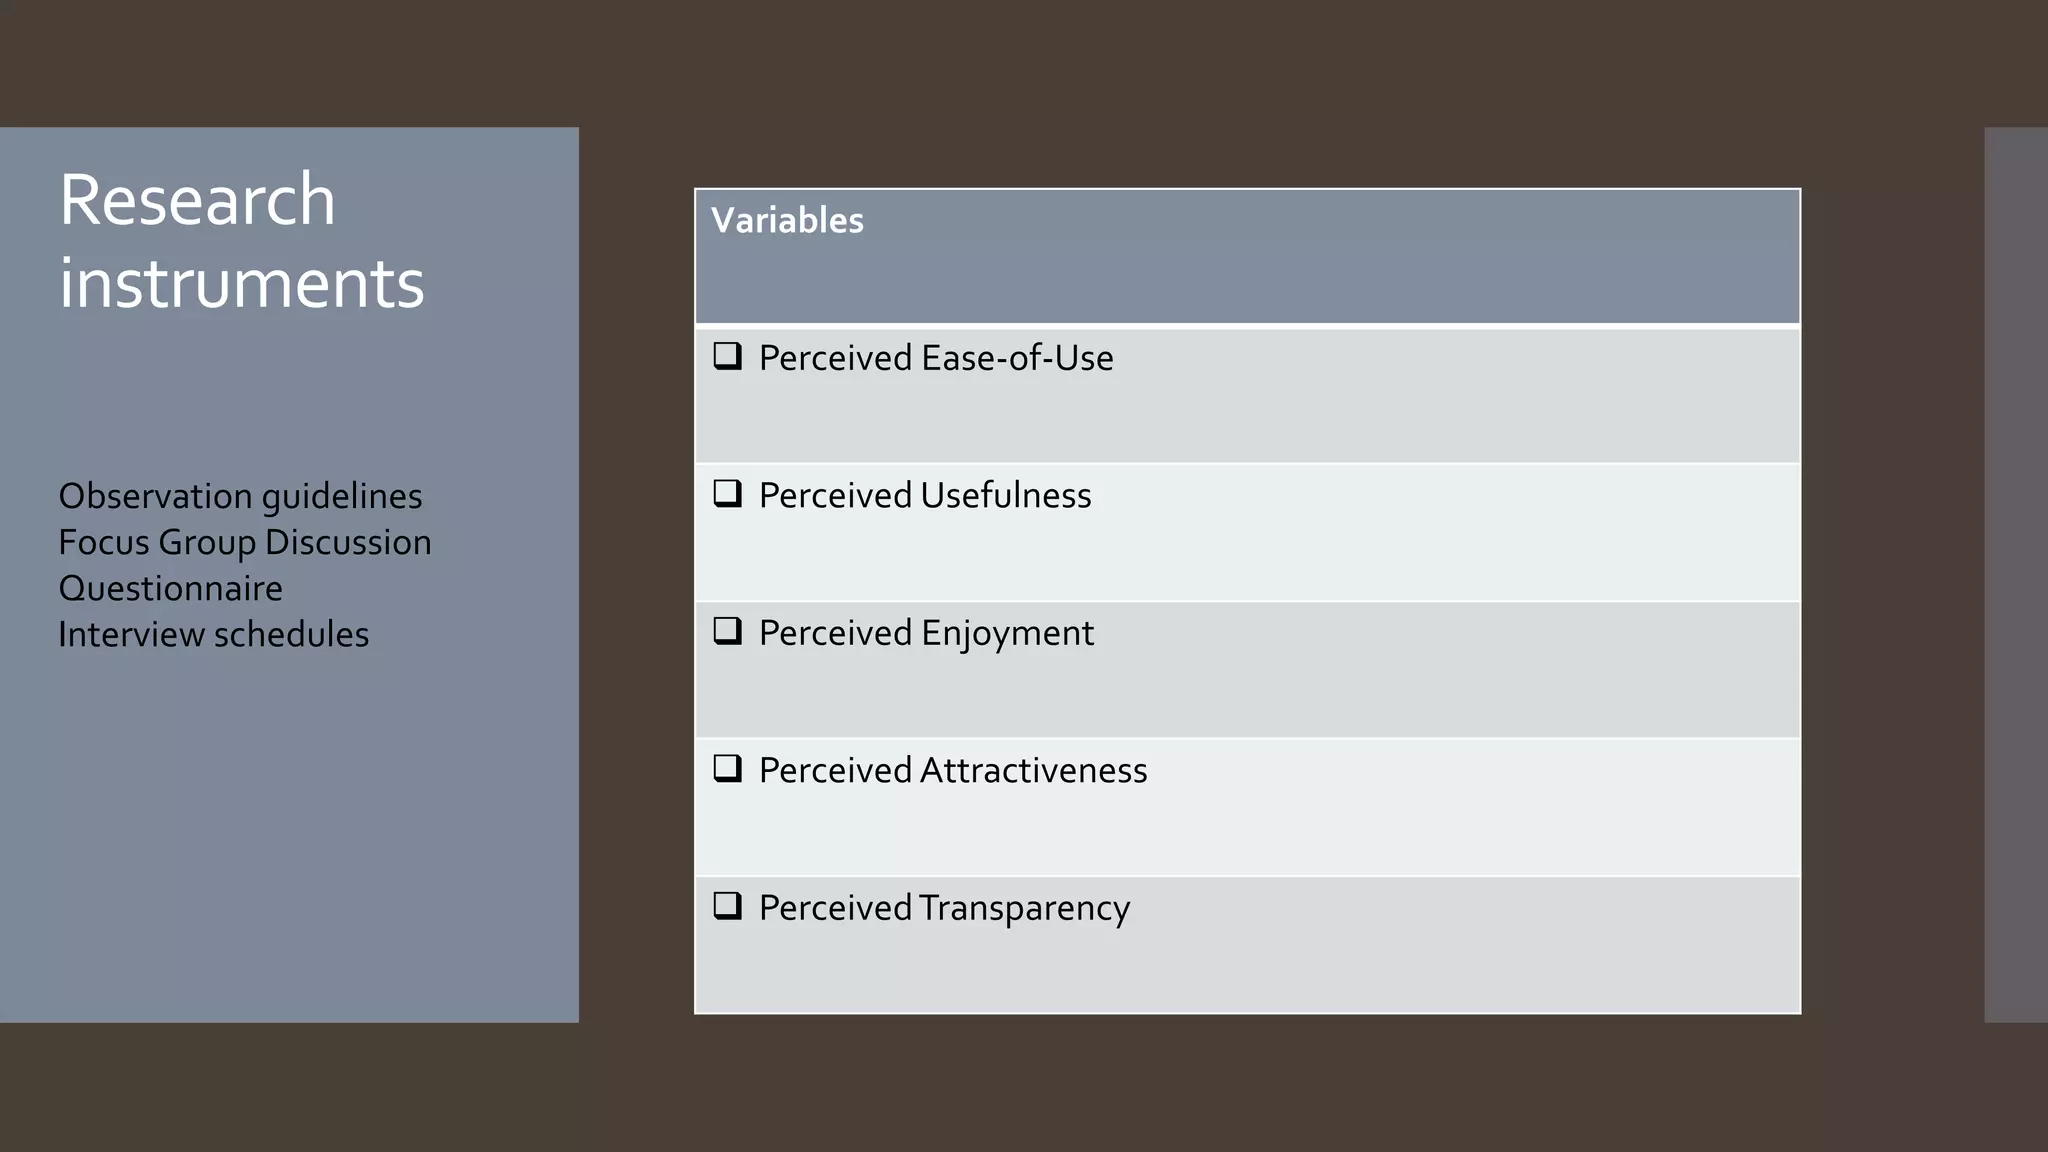
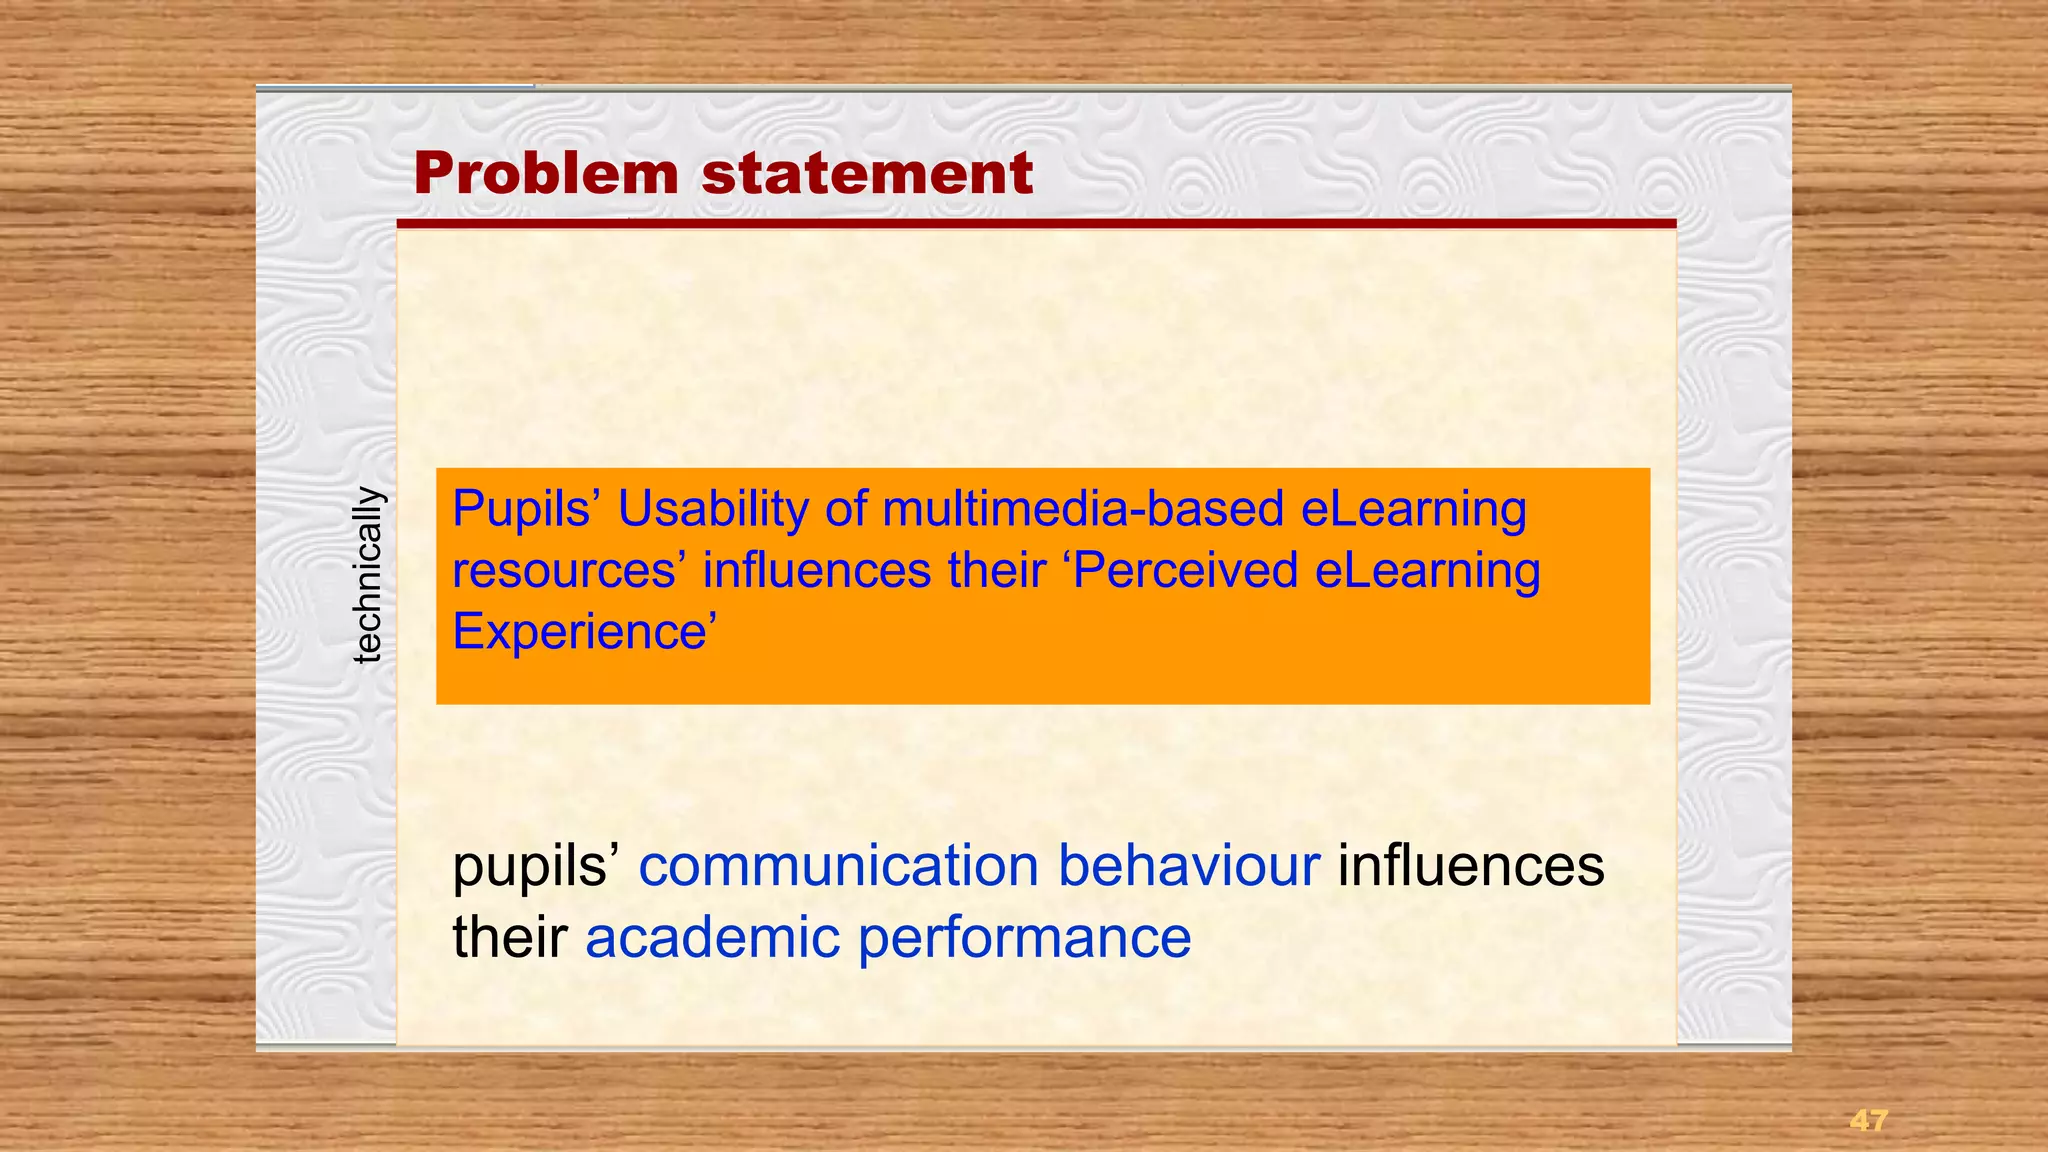
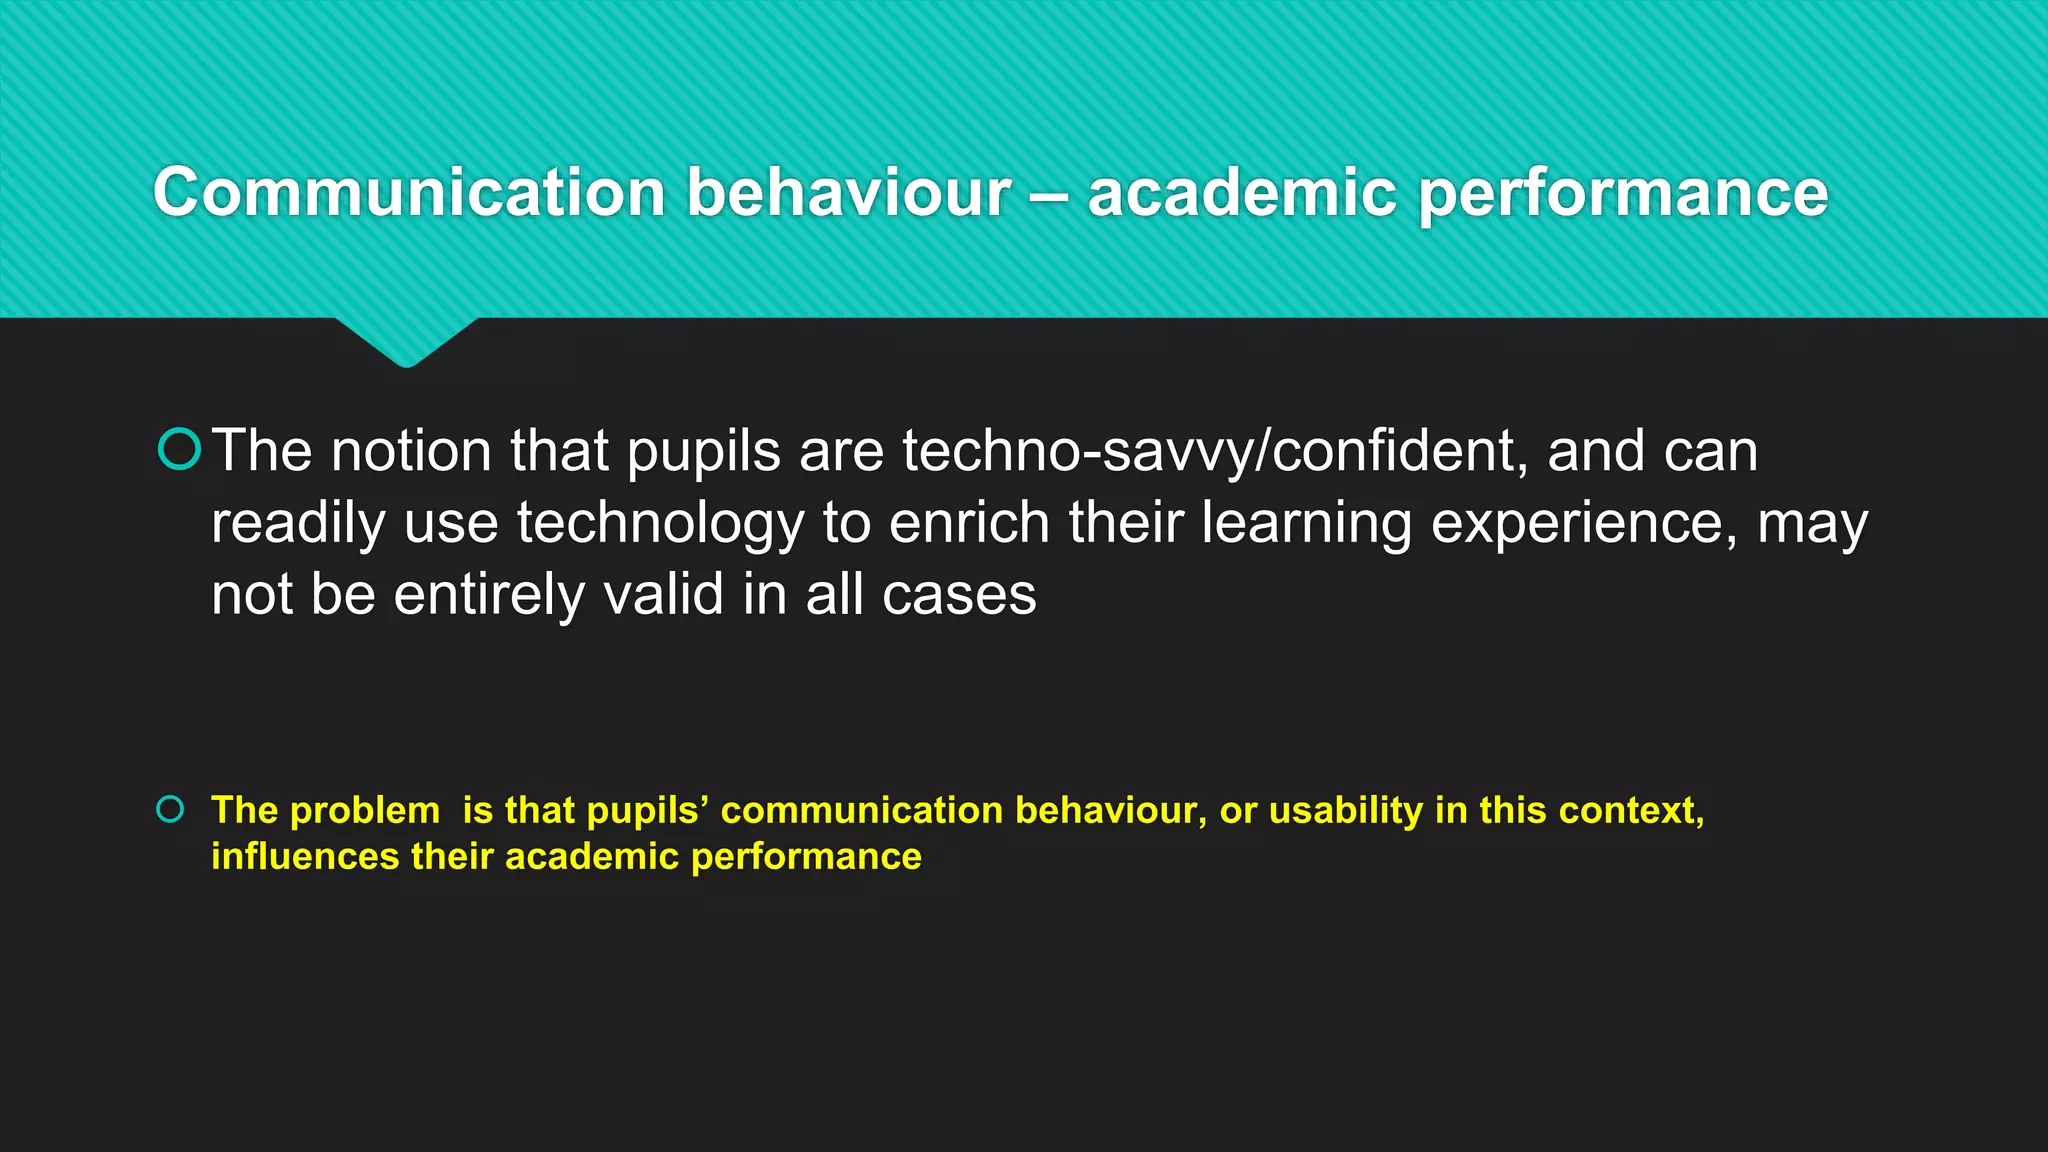
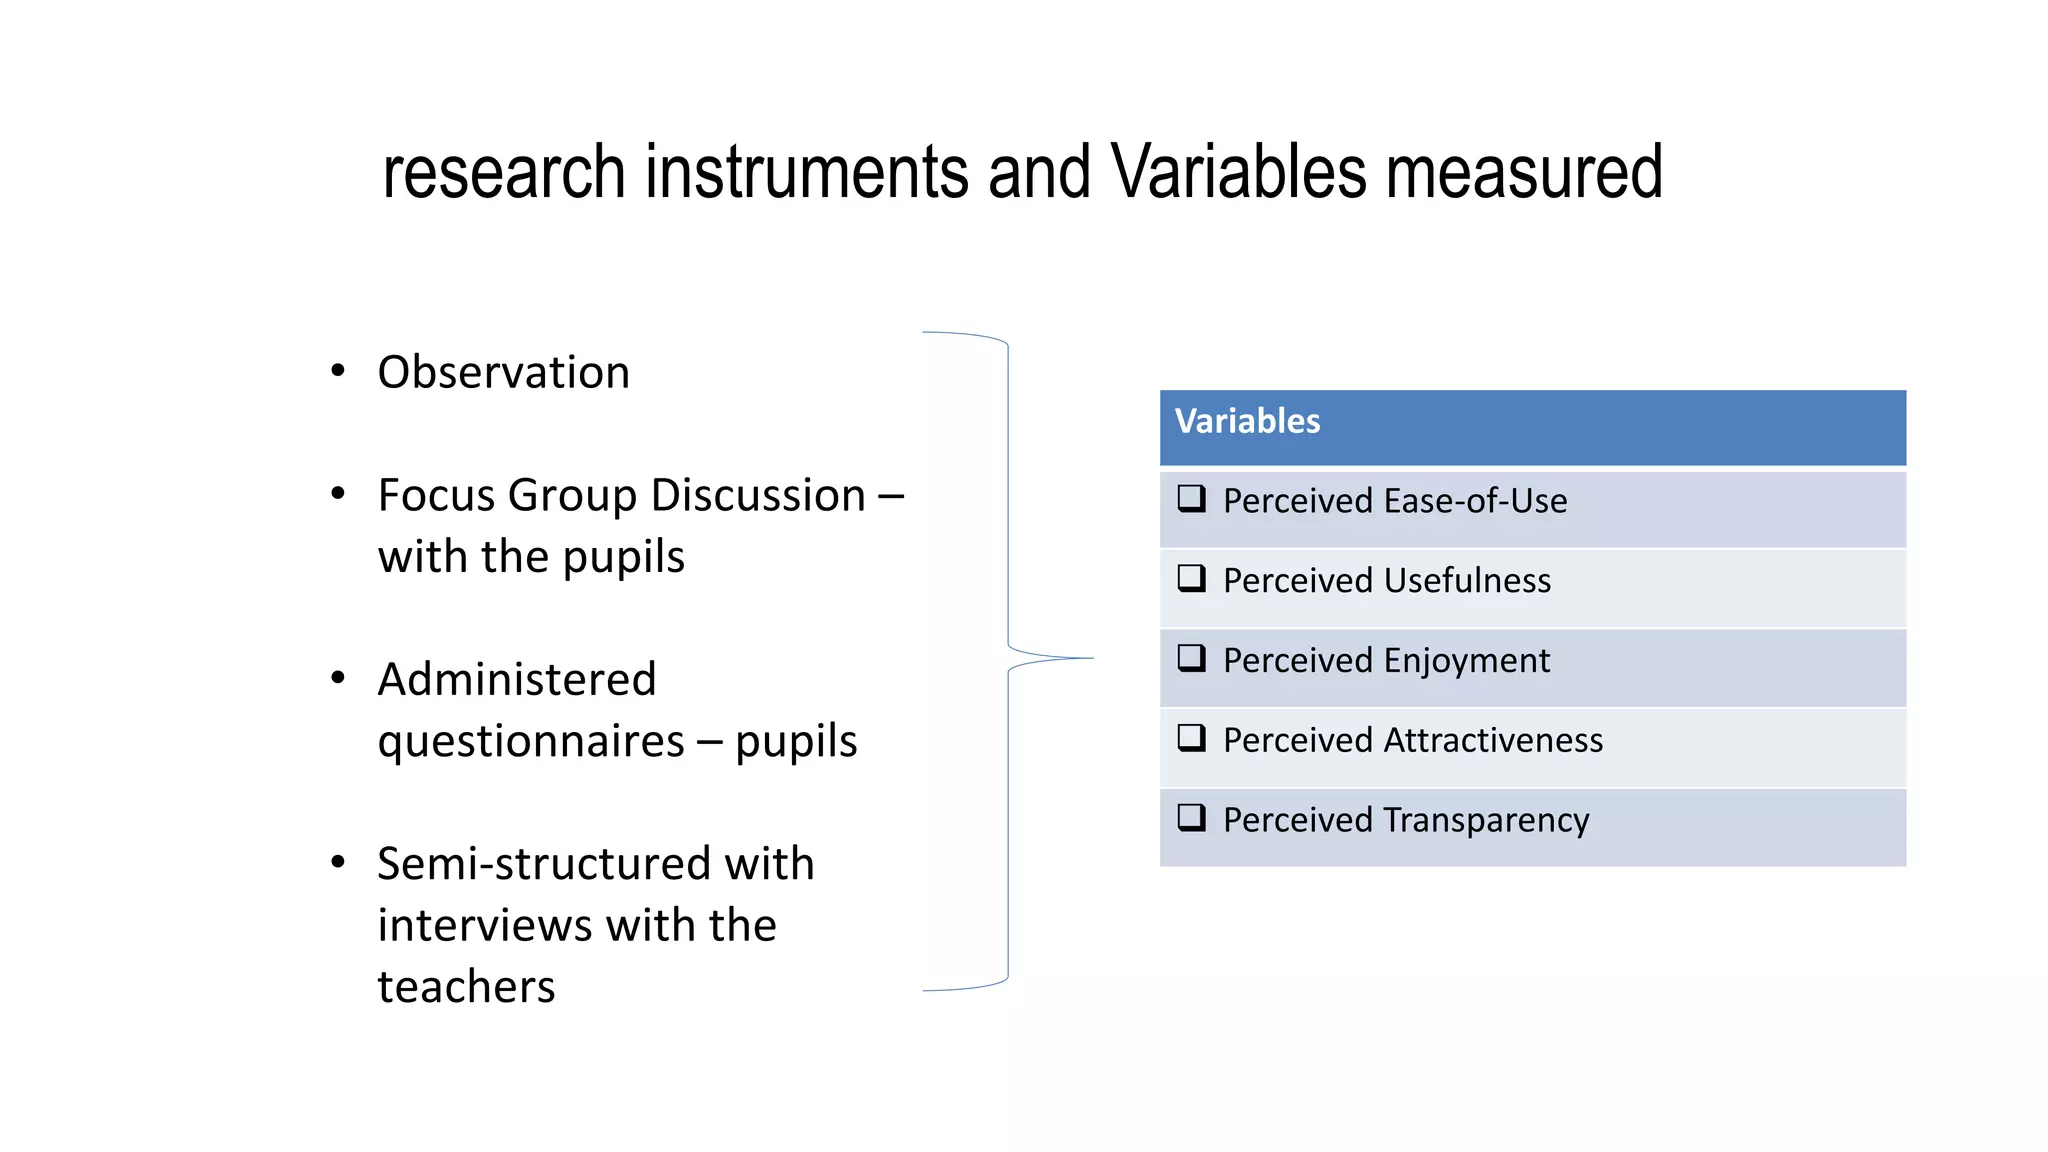
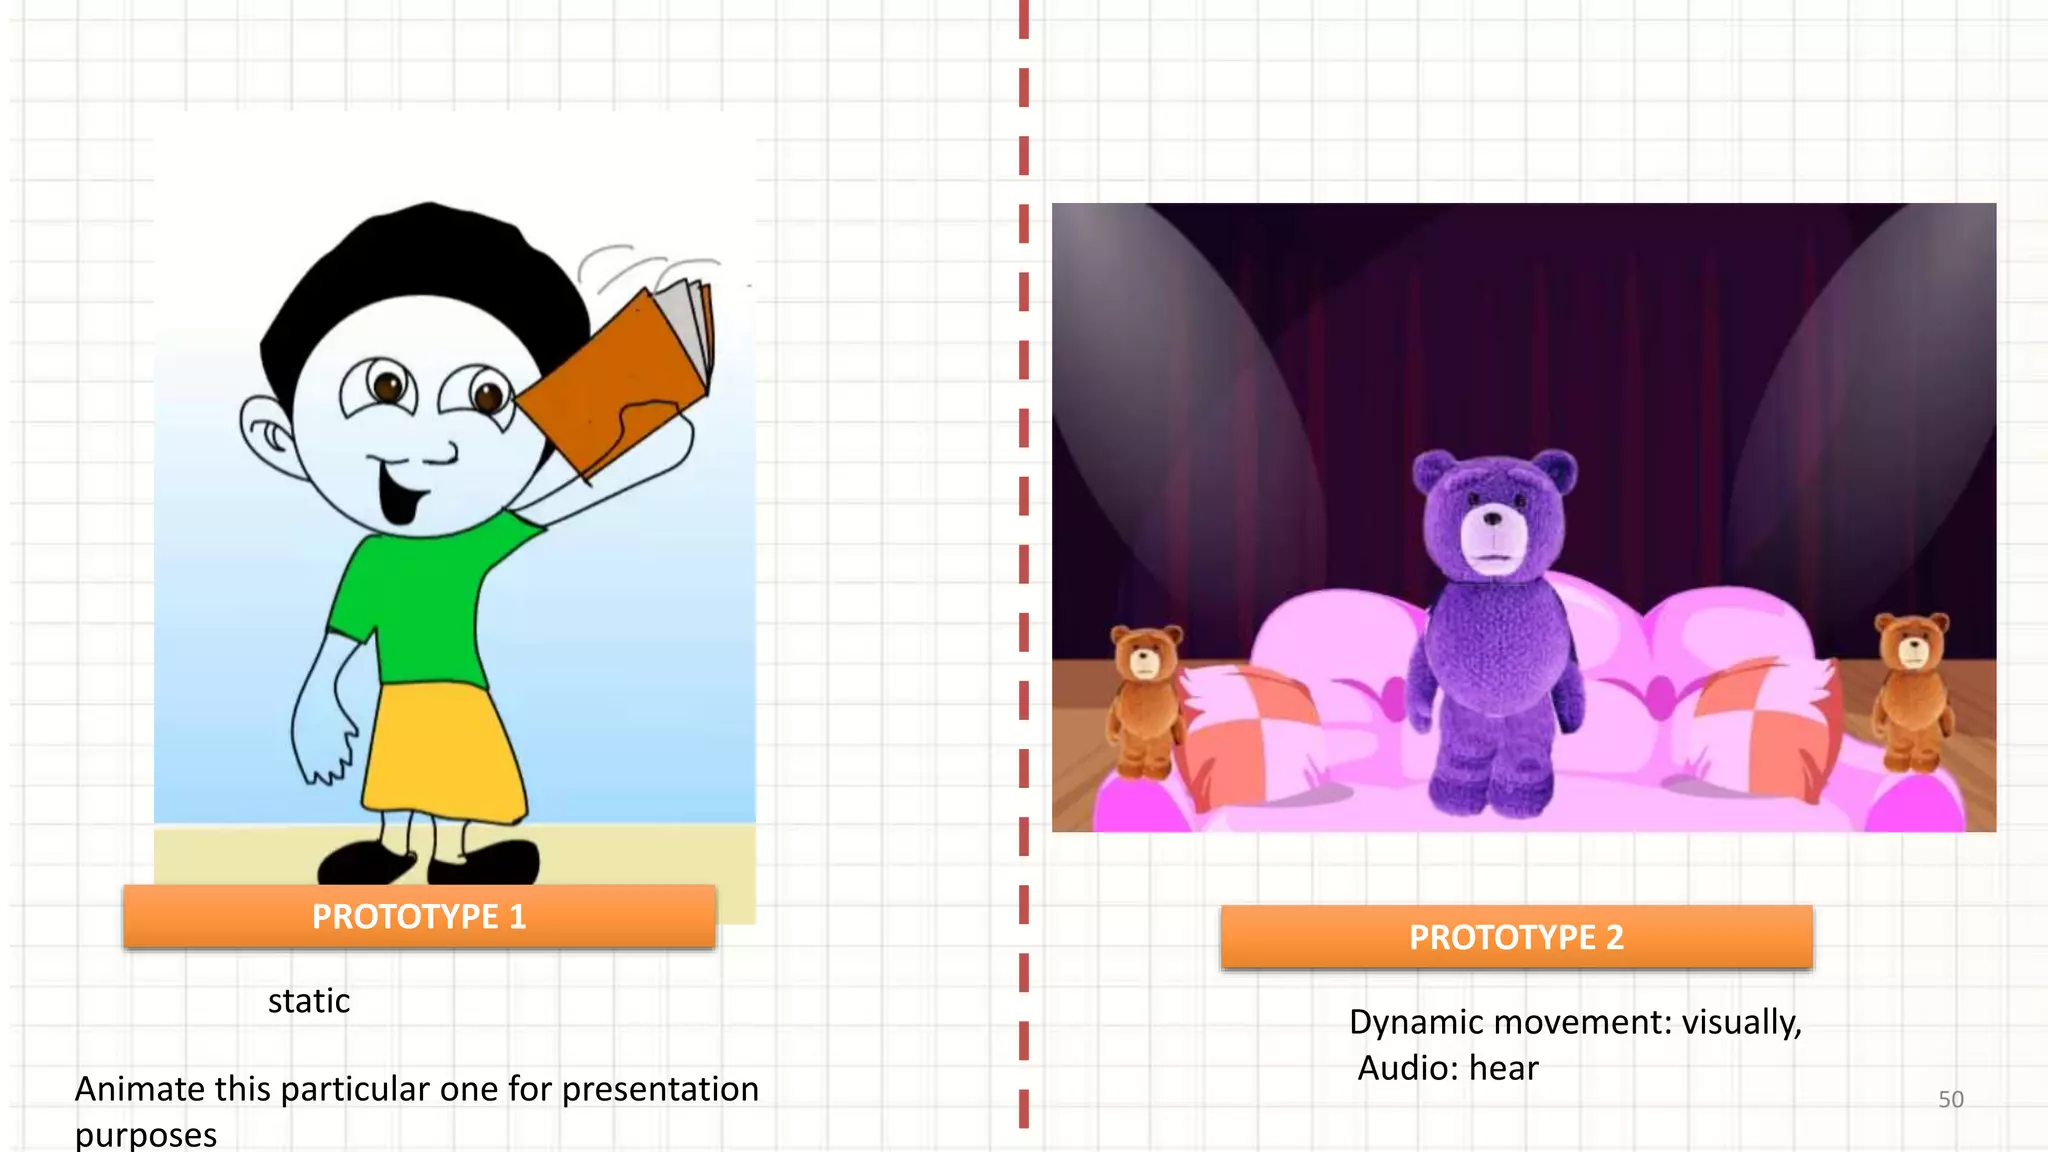
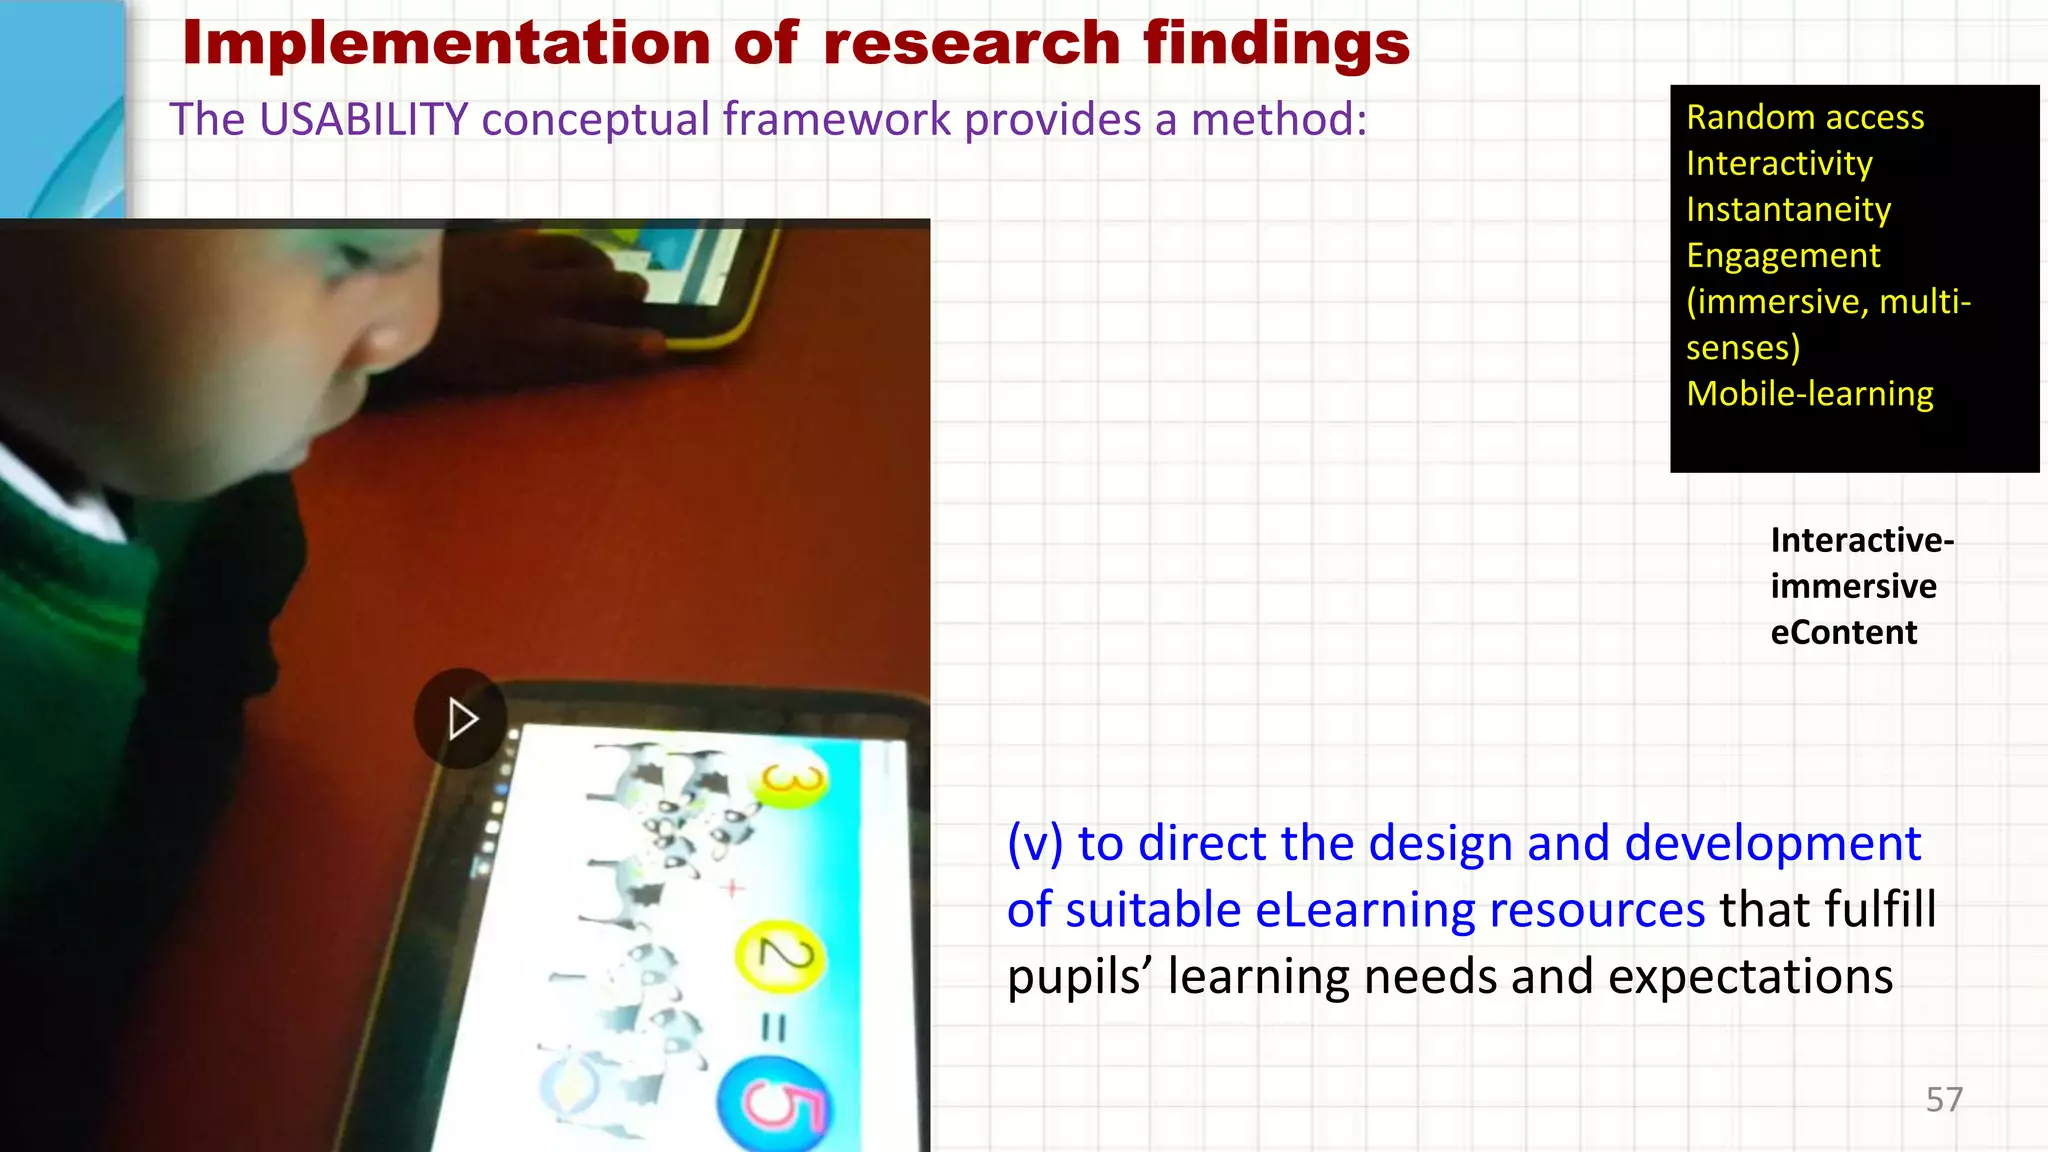
PUPILS’ USABILITY OF
MULTIMEDIA-BASED
ELEARNING RESOURCES, IN
KENYAN PRIMARY SCHOOLS
by
Dr. Makingu Mondi
Directorate of eLearning
Kenyatta University
Objectives
Theoretical Conceptual framework
Background to the study
Research findings,
application
and
Conclusion
research
Pupils’ usability of multimedia-based eLearning resources, in Kenyan primary schools
3
Digital Literacy Programme (DLP)
digi-
school
concept
Several tenets
Vision2030
 To equip students with IT competence at an early
age; to prepare them for knowledge economy (k-e)
KENYA’S
 To re-emphasise science and technology in
education, with a focus on creativity and innovation
Background to the study
DigiSchoolconceptunderpinstheDLP
4
Rural schoolUrban school
Peri-urban school
47 x 3 = 141
Plus 9
Special schools
Total = 150
6 primary schools
2 Urban Pri. schools
2 Peri-urban Pri. schools
2 Rural Pri. schools
150 pilot primary
schools, DLP
Out of
22,000 public primary
schools in all the 47
counties, in Kenya
GoK thro’ MOEST has enlisted
digiSchool
concept
5
Pupils are excited to have the tablets,
but are they learning anything?
SOME OF THE EMERGING ISSUES
The introduction of eLearning resources in
schools raises some pertinent issues that
may influence pupils’ learning experience
Techno-savvy
• Need scaffolding
The notion that all
pupils are techno savvy
Although today’s pupils are
regarded as being technology
savvy, there is a danger of
underestimating the support
they need in order to utilise
eLearning resources
 Scaffolding
 Guidance
Scaffolding
On how:
(1) Operate complex ICT-
based learning environment,
embedded with unfamiliar
navigational and browsing
features
as well as
On how , (2) to integrate
technology in learning core
subjects like Science and
mathematics
Left on their own, some pupils ….
 Not all pupils are techno-savvy – some
need assistance, guidance and
scaffolding
Overwhelming: and experience information overload
intimidating
Disorientation or Cognitive dissonance
Scary gadgets
 Afraid and fearful
In a nutshell –
these are some of the emerging issues
For eLearning systems to succeed, particularly the Kenyas’s DLP, these issues must be addressed:
 poor eCourseware design - some of the digital content is in textbook format (not as interactive as
digital learners expect)
 information overload
 disorientation or cognitive dissonance
 application of computer skills to their learning context – learn core subjects like Science and
Mathematics
In the context of this research, we examine
all these issues as aspects of pupils’ COMMUNICATION BEHAVIOUR
13
Purpose of the Study
Pupils’ Usability of multimedia-
based eLearning resources
their Perceived eLearning Experience
Overarching Research Question
?
For e-learning resources
influences
‘how and why’
Communication
behaviour
Academic
performance
Technicallyproblemstatement
PUPILS’ LEARNING NEEDS
To answer this question that asks ‘how and why’, we
considered pupils’ learning needs, using multimedia-
based digital content, in terms of various Usability
parameters:
• Perceived Ease-of-Use
• Perceived Usefulness
• Perceived Enjoyment
• Perceived Attractiveness
• Perceived Transparency
And of course, how these influence their:
• PERCEIVED eLearning Experience
usability
parameters
Academic
performance
derived from
Technological
Acceptance
Model (TAM)
Expectancy-value theory
Operational definitions of concepts
Usability: easy to learn, easy to use or intuitive to use the multimedia-based
eLearning resources
Various parameters used to determine this USABILITY
1. Perceived Ease-of-Use
2. Perceived Usefulness
3. Perceived Enjoyment
4. Perceived Attractiveness
5. Perceived Transparency
15
Operational
definitions
and
indicators
16
Usability Conceptual frameworkPEOU
PU
PA
PT
PE P. e-Learning
Experience
pupils’ learning needs (independent constructs)
pupils’ expectations
(dependent construct)
USABILITY FACTORS:
PEOU – Perceived Ease-of-Use
PU – Perceived Usefulness
PE – Perceived Enjoyment
PA – Perceived Attractiveness
PT – Perceived Transparency
17
Usability Conceptual frameworkPEOU
PU
PA
PT
PE P. e-Learning
Experience
USABILITY FACTORS:
PEOU – Perceived Ease-of-Use
PU – Perceived Usefulness
PE – Perceived Enjoyment
PA – Perceived Attractiveness
PT – Perceived Transparency
regression
18
Usability Conceptual frameworkPEOU
PU
PA
PT
PE P. e-Learning
Experience
USABILITY FACTORS:
PEOU – Perceived Ease-of-Use
PU – Perceived Usefulness
PE – Perceived Enjoyment
PA – Perceived Attractiveness
PT – Perceived Transparency
correlational
19
Usability
Conceptual
framework
PEOU
PU
PE
PT
PE Perceived
eLearning
Experience
USABILITY FACTORS:
PEOU – Perceived Ease-of-U
PU – Perceived Usefulness
PE – Perceived Enjoyment
PA – Perceived Attractivenes
PT – Perceived Transparency
20
Possible hypothesesPEOU
ξ1
PU
ξ2
PE
ξ4
PT
ξ5
PE
ξ3
P. e-Learning
Experience
η1
H3
USABILITY FACTORS:
PEOU – Perceived Ease-of-Use
PU – Perceived Usefulness
PE – Perceived Enjoyment
PA – Perceived Attractiveness
PT – Perceived Transparency
To test
21
Research Hypotheses
Research Hypotheses
H1: Pupils’ Perceived Ease of Use for multimedia-based eLearning
resources is positively related to their Perceived eLearning Experience
H2: Pupils’ Perceived Usefulness for multimedia-based eLearning resources
is positively related to their Perceived eLearning Experience
H3: Pupils’ Perceived Enjoyment for multimedia-based eLearning resources
is positively related to their Perceived eLearning Experience
H4: Pupils’ Perceived Attractiveness for multimedia-based eLearning
resources is positively related to their Perceived eLearning Experience
H5: Pupils’ Perceived Transparency for multimedia-based eLearning
resources is positively related to their Perceived eLearning Experience
To test
22
Research Hypotheses
22
Research Methods
Research Methods
Qualitative
and
Quantitative
23
Research Design
Participants Teachers
Questionnaire
(TAM)
Quantitative Data Analysis
Research findings, Application and Conclusion
Research
Instruments
Data Analysis
Document
Reviews
Observation
Photo, Video
Focus Group
Discussions
Semi-structured
Interviews
Descriptive
Statistics
Normality tests
KMO tests,
Reliability,
& Validity
Exploratory
Factor
Analysis
(EFA)
Confirmatory
Factor
Analysis
(CFA)
Structural
Equation
Modelling
(SEM)
Research Design
Pupils
Qualitative Data Analysis
TRANSCRIPTION THEMATIC ANALYSIS
120
12
Observation:
facial expression,
use of gestures
on the touch-
screen, Excited,
neutral and
bored/frustrated
Focus Group Discussions - participation
Prototype testing: Prototype 1, Prototype 2
PROTOTYPE 1: Science
PROTOTYPE 2: Science
The pupils were also asked to rate their preferences for :
Multimedia-based eLearning resources
PROTOTYPE 1: Mathematics
PROTOTYPE 2: Mathematics
Prototype 1: Science Prototype 2: Science
 Perceived Ease-of-Use  Perceived Ease-of-Use
 Perceived Usefulness  Perceived Usefulness
 Perceived Enjoyment  Perceived Enjoyment
 Perceived Attractiveness  Perceived Attractiveness
 Perceived Transparency  Perceived Transparency
Prototype 1: Mathematics Prototype 2: Mathematics
 Perceived Ease-of-Use  Perceived Ease-of-Use
 Perceived Usefulness  Perceived Usefulness
 Perceived Enjoyment  Perceived Enjoyment
 Perceived Attractiveness  Perceived Attractiveness
 Perceived Transparency  Perceived Transparency
For Class One (Std. 1)
28
QUANTITATIVE
data collected
was analysed
Using
MS Excel and
SPSS
PROTOTYPE 1
PROTOTYPE 2
RESULTS FOR
QUANTITATIVE DATA ANALYSIS
29
30
Science – Class-One-DLP
0.0
1.0
2.0
3.0
4.0
5.0
PEOU PU PE PA PT
PROT1 Std 1 Science PROT2 Std 1 Science
ACCEPT
REJECT
USABILITY
RATINGS
USABILITY PARAMETERS:
PEOU – Perceived Ease-of-Use
PU – Perceived Usefulness
PE – Perceived Enjoyment
PA – Perceived Attractiveness
PT – Perceived Transparency
PROT 2 Science
PROT 1 Science
y
x
31
Mathematics – Class-One-DLP
0
1
2
3
4
5
PEOU PU PE PA PT
PROT 1 Std. 1 Mathematics PROT 2 Std. 1 Mathematics
ACCEPT
REJECT
USABILITY
RATINGS
USABILITY PARAMETERS:
PEOU – Perceived Ease-of-Use
PU – Perceived Usefulness
PE – Perceived Enjoyment
PA – Perceived Attractiveness
PT – Perceived Transparency
PROT 2 Mathematics
PROT 1 Mathematics
Research findings
Today’s digital learners expect interactive
multimedia-based digital content
• This digital generation of learners expect
and demand:
 Random access
 Interactivity
 Instantaneity
 Engagement (immersive,
multi-senses)
 Mobile-learning: digital tablets
Conclusion help to detect pupils’
preferences, expectations and
learning difficulties
guide educators and designers
to develop suitable eLearning
resources that fulfil digital
generation pupils’ learning
needs and expectation
help facilitators to scaffold, guide and
support pupils’ learning experiences in
a blended learning strategy
Usability Conceptual Framework
Thank you for your attention
34
Q & A
35
Cognitive UGE
Perceived Ease-of-Use
• Easy to navigate around the digital content
• Quickly find a function
• User-friendly system
• EasTy to use the system
stranded Need to be shown what to doTrouble in switching on the tablets
1
Cognitive UGE
Perceived Usefulness
Displayed information is:
• useful
• interesting
• adds value to the learning
experience
2
Cognitive UGE
Perceived Enjoyment
• Digital content is entertaining
• Using the system (tablet and digital
content) is a pleasant experience
• Like using the system
• Use the system to learn
3
Cognitive UGE
Perceived Attractiveness
• The system looks attractive
• Digital content is pleasantly
organized
• Attractive layout of displayed
information
• Colours used are attractive
4
Cognitive UGE
Perceived Transparency
Displayed information is:
• easy to see
• easy to understand
• clear
The steps to perform a task are easy to:
• follow
• understand
5
Observation guidelines
Focus Group Discussion
Questionnaire
Interview schedules
Variables
 Perceived Ease-of-Use
 Perceived Usefulness
 Perceived Enjoyment
 Perceived Attractiveness
 PerceivedTransparency
Research
instruments
Use of wifi connectivity
Issues:
• Teachers may not have the necessary
skills to connect the Teacher’s laptop,
and the pupils’ tablet
Use of wifi connectivity
Issues:
• Teacher able to see all the pupils who
are logged on
Use of wifi connectivity
PROJECTOR
• Teacher able to control what appears
on the pupils tablet, and what is
projected
Use of wifi connectivity
Issues:
• Teachers may not have the necessary
skills to connect the Teacher’s laptop,
and the pupils’ tablet
46
Research InstrumentsResearch Instruments
Q = Questionnaires (pupils)
I = Semi-structured interviews (teachers)
FGD = Focus Group Discussions (pupils)
OD= Observation and Document reviews
(multimedia-based digital content
evaluations)
Q
FGDI
OD
Triangulation improve reliability and validity of the data
47
Problem statement
Pupils’ Usability of multimedia-based eLearning
resources’ influences their ‘Perceived eLearning
Experience’
pupils’ communication behaviour influences
their academic performance
technically
Communication behaviour – academic performance
The notion that pupils are techno-savvy/confident, and can
readily use technology to enrich their learning experience, may
not be entirely valid in all cases
 The problem is that pupils’ communication behaviour, or usability in this context,
influences their academic performance
research instruments and Variables measured
Variables
 Perceived Ease-of-Use
 Perceived Usefulness
 Perceived Enjoyment
 Perceived Attractiveness
 Perceived Transparency
• Observation
• Focus Group Discussion –
with the pupils
• Administered
questionnaires – pupils
• Semi-structured with
interviews with the
teachers
50
static
Dynamic movement: visually,
Audio: hear
Animate this particular one for presentation
purposes
PROTOTYPE 1
PROTOTYPE 2
Implementation of research findings
(i) to detect pupils’ preferences, expectations and learning difficulties
53
The USABILITY conceptual framework provides a method:
Implementation of
research findings
(ii) to help facilitators to guide and
support pupils’ learning
experiences in a blended learning
strategy
54
The USABILITY conceptual framework
provides a method:
Implementation of
research findings
(iii) to guide teachers, pupils,
educators, e-courseware
developers and researchers to
ascertain the efficacy of e-learning
systems intended to enhance
pupils’ learning experience
55
The UGE model will provide a framework:
The USABILITY conceptual
framework provides a method:
Implementation of research
findings
(iv) to forecast the success of integration of
eLearning resources in the school-curriculum
that promises to enhance pupils’ learning
experience
56
The USABILITY conceptual framework provides a
method:
Implementation of research findings
(v) to direct the design and development
of suitable eLearning resources that fulfill
pupils’ learning needs and expectations
57
The USABILITY conceptual framework provides a method:
Interactive-
immersive
eContent
Random access
Interactivity
Instantaneity
Engagement
(immersive, multi-
senses)
Mobile-learning
Interviews with the teachers: excerpts
Two to three weeks training on how to integrate ICT in
lesson-delivery, was not adequate
Teachers lack technical-expertise in using computers in
classroom
Effective training …. depends on various factors, such as:
the level of teacher education, socioeconomic context,
training resources, and even teacher’s pedagogical beliefs
Training teachers to adopt and integrate new computing
technologies is critically important for the success of DLP
Interviews with the teachers: excerpts
Handling over 40 pupils, per class session, all fidgeting with
the tablets, is not an easy task; given their short attention
span
Pupils are not allowed to take the tablets with them to their
homes
Some of the tablets are not functioning well; normally,
taken to the suppliers for repair e.g JKUAT, Moi University
Some teachers focusing too much on technology
61
62
Strongly
Disagree
Disagree
Neutral
Agree
Strongly
Agree
1 2 3 4 5
A. Perceived Ease-of-Use
1. It is easy to navigate around the digital content
2. I can quickly find the function I need
3. I think it is a user-friendly system
4. I find the system easy to use
Instruments:
Reliability = 0.65
Validity
- Use SPSS
63
Strongly
Disagree
Disagree
Neutral
Agree
Strongly
Agree
1 2 3 4 5
B. Perceived Usefulness
1. I find the displayed information useful in the performing tasks
2.The displayed information is interesting to me, in performing tasks
3. The displayed information adds value when performing tasks
4. I find the displayed information important in the performing tasks
64
Strongly
Disagree
Disagree
Neutral
Agree
Strongly
Agree
1 2 3 4 5
C. Perceived Enjoyment
1. I find the system overall an entertaining one
2. I find using the system to be pleasurable
3. I like using the system
4. Using this system would enable me to learn many things
65
Strongly
Disagree
Disagree
Neutral
Agree
Strongly
Agree
1 2 3 4 5
D. Perceived Attractiveness
1. Overall, I find that the system looks attractive
2. The layout of displayed information is attractive
3. The displayed information is pleasantly organized
4. The colours that are used are attractive
66
Strongly
Disagree
Disagree
Neutral
Agree
Strongly
Agree
1 2 3 4 5
E. PerceivedTransparency
1. The displayed information is easy to see 2.
2. The displayed information is easy to understand 3.
3. The displayed information is clear
4. The steps to perform a task are easy to follow
68
PROTOTYPE 1
PROTOTYPE 2
Already coloured Pupils have
opportunity to
colour
69
PROTOTYPE 1
PROTOTYPE 2
Textbook format
interactivity
70
PROTOTYPE 1
PROTOTYPE 2
arm
legs
chest
head
neck
Textbook format Drag-and drop
(interactivity)
71
PROTOTYPE 1
Textbook format
chest
head
leg
arm
neck
PROTOTYPE 2
Touch-screen gestures
or point-and-click
72
matches
sun
firewoodfirefly
PROTOTYPE 1
PROTOTYPE 2
73
PROTOTYPE 1
PROTOTYPE 2
static
dynamic
74
A B C
PROTOTYPE 1
PROTOTYPE 2
75
PROTOTYPE 1
PROTOTYPE 2
Focus Group Discussion
Self-regulated learning Collaborative learning
Scaffolding: guidance
Teacher-led learning
Varying class ecologies:
• Participation that were established
• discourses that were encouraged
Group discussion learning
79
Research Hypotheses
79
Research Methods
Research Methods
Research Design
Research Instruments
Sampling method
Data Collection methods
TRIANGULATION: BOTH QUANTITATIVE AND QUALITATIVE RESEARCH
METHODS
Qualitative
and
Quantitative
Focus Group Discussion
Traumatising
 Some find the tablet to be
puzzling and traumatising

Pupils’ usability of multimedia-based eLearning resources, in Kenyan primary schools

  • 1.
    PUPILS’ USABILITY OF MULTIMEDIA-BASED ELEARNINGRESOURCES, IN KENYAN PRIMARY SCHOOLS by Dr. Makingu Mondi Directorate of eLearning Kenyatta University
  • 2.
    Objectives Theoretical Conceptual framework Backgroundto the study Research findings, application and Conclusion research Pupils’ usability of multimedia-based eLearning resources, in Kenyan primary schools
  • 3.
    3 Digital Literacy Programme(DLP) digi- school concept Several tenets Vision2030  To equip students with IT competence at an early age; to prepare them for knowledge economy (k-e) KENYA’S  To re-emphasise science and technology in education, with a focus on creativity and innovation Background to the study DigiSchoolconceptunderpinstheDLP
  • 4.
    4 Rural schoolUrban school Peri-urbanschool 47 x 3 = 141 Plus 9 Special schools Total = 150 6 primary schools 2 Urban Pri. schools 2 Peri-urban Pri. schools 2 Rural Pri. schools 150 pilot primary schools, DLP Out of 22,000 public primary schools in all the 47 counties, in Kenya GoK thro’ MOEST has enlisted
  • 5.
    digiSchool concept 5 Pupils are excitedto have the tablets, but are they learning anything?
  • 6.
    SOME OF THEEMERGING ISSUES The introduction of eLearning resources in schools raises some pertinent issues that may influence pupils’ learning experience
  • 7.
    Techno-savvy • Need scaffolding Thenotion that all pupils are techno savvy Although today’s pupils are regarded as being technology savvy, there is a danger of underestimating the support they need in order to utilise eLearning resources
  • 8.
     Scaffolding  Guidance Scaffolding Onhow: (1) Operate complex ICT- based learning environment, embedded with unfamiliar navigational and browsing features as well as On how , (2) to integrate technology in learning core subjects like Science and mathematics
  • 9.
    Left on theirown, some pupils ….  Not all pupils are techno-savvy – some need assistance, guidance and scaffolding Overwhelming: and experience information overload
  • 10.
  • 11.
  • 12.
    In a nutshell– these are some of the emerging issues For eLearning systems to succeed, particularly the Kenyas’s DLP, these issues must be addressed:  poor eCourseware design - some of the digital content is in textbook format (not as interactive as digital learners expect)  information overload  disorientation or cognitive dissonance  application of computer skills to their learning context – learn core subjects like Science and Mathematics In the context of this research, we examine all these issues as aspects of pupils’ COMMUNICATION BEHAVIOUR
  • 13.
    13 Purpose of theStudy Pupils’ Usability of multimedia- based eLearning resources their Perceived eLearning Experience Overarching Research Question ? For e-learning resources influences ‘how and why’ Communication behaviour Academic performance Technicallyproblemstatement
  • 14.
    PUPILS’ LEARNING NEEDS Toanswer this question that asks ‘how and why’, we considered pupils’ learning needs, using multimedia- based digital content, in terms of various Usability parameters: • Perceived Ease-of-Use • Perceived Usefulness • Perceived Enjoyment • Perceived Attractiveness • Perceived Transparency And of course, how these influence their: • PERCEIVED eLearning Experience usability parameters Academic performance derived from Technological Acceptance Model (TAM) Expectancy-value theory
  • 15.
    Operational definitions ofconcepts Usability: easy to learn, easy to use or intuitive to use the multimedia-based eLearning resources Various parameters used to determine this USABILITY 1. Perceived Ease-of-Use 2. Perceived Usefulness 3. Perceived Enjoyment 4. Perceived Attractiveness 5. Perceived Transparency 15 Operational definitions and indicators
  • 16.
    16 Usability Conceptual frameworkPEOU PU PA PT PEP. e-Learning Experience pupils’ learning needs (independent constructs) pupils’ expectations (dependent construct) USABILITY FACTORS: PEOU – Perceived Ease-of-Use PU – Perceived Usefulness PE – Perceived Enjoyment PA – Perceived Attractiveness PT – Perceived Transparency
  • 17.
    17 Usability Conceptual frameworkPEOU PU PA PT PEP. e-Learning Experience USABILITY FACTORS: PEOU – Perceived Ease-of-Use PU – Perceived Usefulness PE – Perceived Enjoyment PA – Perceived Attractiveness PT – Perceived Transparency regression
  • 18.
    18 Usability Conceptual frameworkPEOU PU PA PT PEP. e-Learning Experience USABILITY FACTORS: PEOU – Perceived Ease-of-Use PU – Perceived Usefulness PE – Perceived Enjoyment PA – Perceived Attractiveness PT – Perceived Transparency correlational
  • 19.
    19 Usability Conceptual framework PEOU PU PE PT PE Perceived eLearning Experience USABILITY FACTORS: PEOU– Perceived Ease-of-U PU – Perceived Usefulness PE – Perceived Enjoyment PA – Perceived Attractivenes PT – Perceived Transparency
  • 20.
    20 Possible hypothesesPEOU ξ1 PU ξ2 PE ξ4 PT ξ5 PE ξ3 P. e-Learning Experience η1 H3 USABILITYFACTORS: PEOU – Perceived Ease-of-Use PU – Perceived Usefulness PE – Perceived Enjoyment PA – Perceived Attractiveness PT – Perceived Transparency To test
  • 21.
    21 Research Hypotheses Research Hypotheses H1:Pupils’ Perceived Ease of Use for multimedia-based eLearning resources is positively related to their Perceived eLearning Experience H2: Pupils’ Perceived Usefulness for multimedia-based eLearning resources is positively related to their Perceived eLearning Experience H3: Pupils’ Perceived Enjoyment for multimedia-based eLearning resources is positively related to their Perceived eLearning Experience H4: Pupils’ Perceived Attractiveness for multimedia-based eLearning resources is positively related to their Perceived eLearning Experience H5: Pupils’ Perceived Transparency for multimedia-based eLearning resources is positively related to their Perceived eLearning Experience To test
  • 22.
    22 Research Hypotheses 22 Research Methods ResearchMethods Qualitative and Quantitative
  • 23.
    23 Research Design Participants Teachers Questionnaire (TAM) QuantitativeData Analysis Research findings, Application and Conclusion Research Instruments Data Analysis Document Reviews Observation Photo, Video Focus Group Discussions Semi-structured Interviews Descriptive Statistics Normality tests KMO tests, Reliability, & Validity Exploratory Factor Analysis (EFA) Confirmatory Factor Analysis (CFA) Structural Equation Modelling (SEM) Research Design Pupils Qualitative Data Analysis TRANSCRIPTION THEMATIC ANALYSIS 120 12
  • 24.
    Observation: facial expression, use ofgestures on the touch- screen, Excited, neutral and bored/frustrated
  • 25.
    Focus Group Discussions- participation
  • 26.
    Prototype testing: Prototype1, Prototype 2 PROTOTYPE 1: Science PROTOTYPE 2: Science The pupils were also asked to rate their preferences for : Multimedia-based eLearning resources PROTOTYPE 1: Mathematics PROTOTYPE 2: Mathematics
  • 27.
    Prototype 1: SciencePrototype 2: Science  Perceived Ease-of-Use  Perceived Ease-of-Use  Perceived Usefulness  Perceived Usefulness  Perceived Enjoyment  Perceived Enjoyment  Perceived Attractiveness  Perceived Attractiveness  Perceived Transparency  Perceived Transparency Prototype 1: Mathematics Prototype 2: Mathematics  Perceived Ease-of-Use  Perceived Ease-of-Use  Perceived Usefulness  Perceived Usefulness  Perceived Enjoyment  Perceived Enjoyment  Perceived Attractiveness  Perceived Attractiveness  Perceived Transparency  Perceived Transparency For Class One (Std. 1)
  • 28.
    28 QUANTITATIVE data collected was analysed Using MSExcel and SPSS PROTOTYPE 1 PROTOTYPE 2
  • 29.
  • 30.
    30 Science – Class-One-DLP 0.0 1.0 2.0 3.0 4.0 5.0 PEOUPU PE PA PT PROT1 Std 1 Science PROT2 Std 1 Science ACCEPT REJECT USABILITY RATINGS USABILITY PARAMETERS: PEOU – Perceived Ease-of-Use PU – Perceived Usefulness PE – Perceived Enjoyment PA – Perceived Attractiveness PT – Perceived Transparency PROT 2 Science PROT 1 Science y x
  • 31.
    31 Mathematics – Class-One-DLP 0 1 2 3 4 5 PEOUPU PE PA PT PROT 1 Std. 1 Mathematics PROT 2 Std. 1 Mathematics ACCEPT REJECT USABILITY RATINGS USABILITY PARAMETERS: PEOU – Perceived Ease-of-Use PU – Perceived Usefulness PE – Perceived Enjoyment PA – Perceived Attractiveness PT – Perceived Transparency PROT 2 Mathematics PROT 1 Mathematics
  • 32.
    Research findings Today’s digitallearners expect interactive multimedia-based digital content • This digital generation of learners expect and demand:  Random access  Interactivity  Instantaneity  Engagement (immersive, multi-senses)  Mobile-learning: digital tablets
  • 33.
    Conclusion help todetect pupils’ preferences, expectations and learning difficulties guide educators and designers to develop suitable eLearning resources that fulfil digital generation pupils’ learning needs and expectation help facilitators to scaffold, guide and support pupils’ learning experiences in a blended learning strategy Usability Conceptual Framework
  • 34.
    Thank you foryour attention 34 Q & A
  • 35.
  • 36.
    Cognitive UGE Perceived Ease-of-Use •Easy to navigate around the digital content • Quickly find a function • User-friendly system • EasTy to use the system stranded Need to be shown what to doTrouble in switching on the tablets 1
  • 37.
    Cognitive UGE Perceived Usefulness Displayedinformation is: • useful • interesting • adds value to the learning experience 2
  • 38.
    Cognitive UGE Perceived Enjoyment •Digital content is entertaining • Using the system (tablet and digital content) is a pleasant experience • Like using the system • Use the system to learn 3
  • 39.
    Cognitive UGE Perceived Attractiveness •The system looks attractive • Digital content is pleasantly organized • Attractive layout of displayed information • Colours used are attractive 4
  • 40.
    Cognitive UGE Perceived Transparency Displayedinformation is: • easy to see • easy to understand • clear The steps to perform a task are easy to: • follow • understand 5
  • 41.
    Observation guidelines Focus GroupDiscussion Questionnaire Interview schedules Variables  Perceived Ease-of-Use  Perceived Usefulness  Perceived Enjoyment  Perceived Attractiveness  PerceivedTransparency Research instruments
  • 42.
    Use of wificonnectivity Issues: • Teachers may not have the necessary skills to connect the Teacher’s laptop, and the pupils’ tablet
  • 43.
    Use of wificonnectivity Issues: • Teacher able to see all the pupils who are logged on
  • 44.
    Use of wificonnectivity PROJECTOR • Teacher able to control what appears on the pupils tablet, and what is projected
  • 45.
    Use of wificonnectivity Issues: • Teachers may not have the necessary skills to connect the Teacher’s laptop, and the pupils’ tablet
  • 46.
    46 Research InstrumentsResearch Instruments Q= Questionnaires (pupils) I = Semi-structured interviews (teachers) FGD = Focus Group Discussions (pupils) OD= Observation and Document reviews (multimedia-based digital content evaluations) Q FGDI OD Triangulation improve reliability and validity of the data
  • 47.
    47 Problem statement Pupils’ Usabilityof multimedia-based eLearning resources’ influences their ‘Perceived eLearning Experience’ pupils’ communication behaviour influences their academic performance technically
  • 48.
    Communication behaviour –academic performance The notion that pupils are techno-savvy/confident, and can readily use technology to enrich their learning experience, may not be entirely valid in all cases  The problem is that pupils’ communication behaviour, or usability in this context, influences their academic performance
  • 49.
    research instruments andVariables measured Variables  Perceived Ease-of-Use  Perceived Usefulness  Perceived Enjoyment  Perceived Attractiveness  Perceived Transparency • Observation • Focus Group Discussion – with the pupils • Administered questionnaires – pupils • Semi-structured with interviews with the teachers
  • 50.
    50 static Dynamic movement: visually, Audio:hear Animate this particular one for presentation purposes PROTOTYPE 1 PROTOTYPE 2
  • 53.
    Implementation of researchfindings (i) to detect pupils’ preferences, expectations and learning difficulties 53 The USABILITY conceptual framework provides a method:
  • 54.
    Implementation of research findings (ii)to help facilitators to guide and support pupils’ learning experiences in a blended learning strategy 54 The USABILITY conceptual framework provides a method:
  • 55.
    Implementation of research findings (iii)to guide teachers, pupils, educators, e-courseware developers and researchers to ascertain the efficacy of e-learning systems intended to enhance pupils’ learning experience 55 The UGE model will provide a framework: The USABILITY conceptual framework provides a method:
  • 56.
    Implementation of research findings (iv)to forecast the success of integration of eLearning resources in the school-curriculum that promises to enhance pupils’ learning experience 56 The USABILITY conceptual framework provides a method:
  • 57.
    Implementation of researchfindings (v) to direct the design and development of suitable eLearning resources that fulfill pupils’ learning needs and expectations 57 The USABILITY conceptual framework provides a method: Interactive- immersive eContent Random access Interactivity Instantaneity Engagement (immersive, multi- senses) Mobile-learning
  • 59.
    Interviews with theteachers: excerpts Two to three weeks training on how to integrate ICT in lesson-delivery, was not adequate Teachers lack technical-expertise in using computers in classroom Effective training …. depends on various factors, such as: the level of teacher education, socioeconomic context, training resources, and even teacher’s pedagogical beliefs Training teachers to adopt and integrate new computing technologies is critically important for the success of DLP
  • 60.
    Interviews with theteachers: excerpts Handling over 40 pupils, per class session, all fidgeting with the tablets, is not an easy task; given their short attention span Pupils are not allowed to take the tablets with them to their homes Some of the tablets are not functioning well; normally, taken to the suppliers for repair e.g JKUAT, Moi University Some teachers focusing too much on technology
  • 61.
  • 62.
    62 Strongly Disagree Disagree Neutral Agree Strongly Agree 1 2 34 5 A. Perceived Ease-of-Use 1. It is easy to navigate around the digital content 2. I can quickly find the function I need 3. I think it is a user-friendly system 4. I find the system easy to use Instruments: Reliability = 0.65 Validity - Use SPSS
  • 63.
    63 Strongly Disagree Disagree Neutral Agree Strongly Agree 1 2 34 5 B. Perceived Usefulness 1. I find the displayed information useful in the performing tasks 2.The displayed information is interesting to me, in performing tasks 3. The displayed information adds value when performing tasks 4. I find the displayed information important in the performing tasks
  • 64.
    64 Strongly Disagree Disagree Neutral Agree Strongly Agree 1 2 34 5 C. Perceived Enjoyment 1. I find the system overall an entertaining one 2. I find using the system to be pleasurable 3. I like using the system 4. Using this system would enable me to learn many things
  • 65.
    65 Strongly Disagree Disagree Neutral Agree Strongly Agree 1 2 34 5 D. Perceived Attractiveness 1. Overall, I find that the system looks attractive 2. The layout of displayed information is attractive 3. The displayed information is pleasantly organized 4. The colours that are used are attractive
  • 66.
    66 Strongly Disagree Disagree Neutral Agree Strongly Agree 1 2 34 5 E. PerceivedTransparency 1. The displayed information is easy to see 2. 2. The displayed information is easy to understand 3. 3. The displayed information is clear 4. The steps to perform a task are easy to follow
  • 68.
    68 PROTOTYPE 1 PROTOTYPE 2 Alreadycoloured Pupils have opportunity to colour
  • 69.
  • 70.
  • 71.
    71 PROTOTYPE 1 Textbook format chest head leg arm neck PROTOTYPE2 Touch-screen gestures or point-and-click
  • 72.
  • 73.
  • 74.
    74 A B C PROTOTYPE1 PROTOTYPE 2
  • 75.
  • 76.
  • 77.
  • 78.
    Self-regulated learning Collaborativelearning Scaffolding: guidance Teacher-led learning Varying class ecologies: • Participation that were established • discourses that were encouraged Group discussion learning
  • 79.
    79 Research Hypotheses 79 Research Methods ResearchMethods Research Design Research Instruments Sampling method Data Collection methods TRIANGULATION: BOTH QUANTITATIVE AND QUALITATIVE RESEARCH METHODS Qualitative and Quantitative
  • 80.
  • 81.
    Traumatising  Some findthe tablet to be puzzling and traumatising